September 1, 1994
SRC
Research
Report
128a
A Library for Visualizing
Combinatorial Structures
Marc A. Najork and Marc H. Brown
d i g i t a l
Systems Research Center
130 Lytton Avenue
Systems Research Center
The charter of SRC is to advance both the state of knowledge and the state of the art in computer systems. From our establishment in 1984, we have performed basic and applied research to support Digital’s business objectives. Our current work includes exploring distributed personal computing on multiple platforms, network-ing, programming technology, system modelling and management techniques, and selected applications.
Our strategy is to test the technical and practical value of our ideas by building hardware and software prototypes and using them as daily tools. Interesting systems are too complex to be evaluated solely in the abstract; extended use allows us to investigate their properties in depth. This experience is useful in the short term in refining our designs, and invaluable in the long term in advancing our knowledge. Most of the major advances in information systems have come through this strategy, including personal computing, distributed systems, and the Internet.
We also perform complementary work of a more mathematical flavor. Some of it is in established fields of theoretical computer science, such as the analysis of algorithms, computational geometry, and logics of programming. Other work explores new ground motivated by problems that arise in our systems research.
We have a strong commitment to communicating our results; exposing and testing our ideas in the research and development communities leads to improved un-derstanding. Our research report series supplements publication in professional journals and conferences. We seek users for our prototype systems among those with whom we have common interests, and we encourage collaboration with uni-versity researchers.
A Library for Visualizing
Combinatorial Structures
Marc A. Najork and Marc H. Brown
A preliminary version of this report will appear in the proceedings of the 1994
IEEE Visualization’94 conference, October 1994.
Color versions of Figures 1 and 3 appear in SRC Research Report 110.
c
Digital Equipment Corporation 1994
Abstract
1
Background
Algorithm animation is concerned with visualizing the internal operations of a running program in such a way that the user gains some understanding of the workings of the algorithm. Due to lack of adequate hardware, early algorithm animation systems were restricted to black-and-white animations at low frame rates [6]. As hardware has improved, smooth motion [11, 15], color [1], and sound [4] have been used to increase the level of expressiveness of the visualizations. Constructing an enlightening visualization of an algorithm in action is a tricky proposition, involving both the artistic and pedagogical skills of the animator. Most successful views undergo dozens of design iterations. Based on our experiences in the 1992 and 1993 SRC Algorithm Animation Festivals [2, 3] (20 SRC researchers participated each year), we found that a high-level animation library, coupled with an interpreted language, was instrumental in developing high-quality views [12].
A high-level animation library allows users to focus on what they want to animate, without having to spend too much time on the how. An interpreted language significantly shortens the time needed for each iteration in the design cycle because users do not need to recompile the view after modifying its code. In fact, in our algorithm animation system, users just need to hit the “run” button in the control panel to see their changes in action.
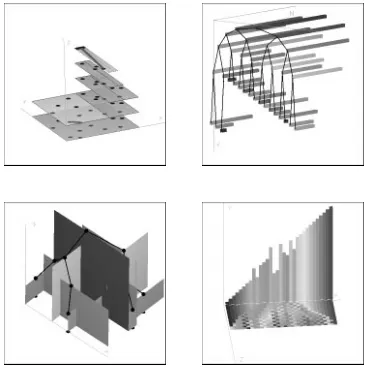
In 1992, we began to explore how 3D graphics could be used to further increase the expressiveness of visualizations [5]. We identified three fundamental uses of 3D for algorithm visualization: Expressing fundamental information about structures that are inherently two-dimensional; uniting multiple views of the underlying struc-tures; and capturing a history of a two-dimensional view. Fig. 1 shows snapshots of some of the 3D animations we developed.
Figure 1: These snapshots are examples of the type of views for which ANIM3D is very well suited. Each view requires from 50 to 200 lines of code to produce. The top-left snapshot shows a divide-and-conquer algorithm for finding the closest pair of a set of points in the plane. The third dimension is used here to show the recursive structure of the algorithm. The top-right snapshot shows a view of Heapsort. Each element of the array is displayed as a stick whose length and color is proportional to its value. With clever placement, the tree structure of the heap is visible from the front and the array implementation of the tree is revealed from the side. The bottom-left snapshot shows ak-d tree,
fork =2. When viewed from the top, the walls reveal how the plane has been partitioned by the
animation (Dijkstra’s shortest-path algorithm) decreased from about 2000 lines of Modula-3 to 70 lines of Obliq, and the part of the design cycle time devoted to compiling, linking, and restarting the application from about 7 minutes to about 10 seconds of reloading by the Obliq interpreter (on a DECstation 5000/200).
Although ANIM3D was designed with algorithm animation in mind, it is a
general-purpose animation system. We believe it to be particularly well suited for visualizing and animating combinatorial structures.
The remainder of this report is structured as follows. After presenting an overview of ANIM3D, we show how to use the library to construct a simple anima-tion. The animation is of a trivial solar system. We then build a 3D visualization of Dijkstra’s algorithm for finding the shortest path in a graph. This animation can also serve as an introduction to our methodology for animating algorithms. Finally, we discuss how ANIM3D compares with other general-purpose animation systems and with other algorithm animation systems.
2
An Overview of Anim3D
ANIM3D is built upon three basic concepts: graphical objects, properties, and callbacks.
A graphical object, or “GO”, can be a geometric primitive such as a line, polygon, sphere, or cone, a light source, a camera, or a group of other GOs. Graphical objects form a directed acyclic graph; typically, the roots of the DAG are the top-level windows, the internal nodes are groups of other GOs, and the leaves are geometric primitives, lights, or cameras. The GO class hierarchy is as follows:
RootGO OrthoCameraGO PerspCameraGO AmbientLightGO VectorLightGO PointLightGO SpotLightGO LineGO MarkerGO PolygonGO BoxGO SphereGO ConeGO CylinderGO DiskGO TorusGO GroupGO CameraGO LightGO NonSurfaceGO SurfaceGO GO
(in an object-oriented programming sense) representing colors, 3D points, reals, etc. Because property values are objects, they are mutable and can be shared by several GOs. In addition, property values are time-variant: the actual value encapsulated by the property value depends on the current animation time, a system-wide resource. Associated with each graphical object
o
is a property mapping, a partial function from property names to property values. A property associated witho
affects not only the appearance ofo
, but also the appearance of all those descendants ofo
that do not explicitly override the property.Although it is legal to associate any property with any graphical object, the property does not necessarily affect the object. For example, associating a “Sphere Radius” property with an ambient light source does not affect the appearance or behavior of the light. However, associating this property with a group
g
potentially affects all spheres contained ing
.Graphical objects are reactive, that is, they can respond to events. We distin-guish three different kinds of events: mouse events are triggered by pressing or releasing mouse buttons, position events are triggered by moving the mouse, and
key events are triggered by pressing keyboard keys.
Events are handled by callbacks. There are three types of callbacks, corre-sponding to the three kinds of events. Associated with each graphical object are three callback stacks. The client can define or redefine the reactive behavior of a graphical object by pushing a new callback onto the appropriate stack. The previous behavior of the graphical object can easily be reestablished by popping the stack.
Consider a mouse event
e
that occurs within the extent of a top-level windoww
. Associated withw
is aRootGOr
. The top callback onr
’s mouse callback stack will be invoked (if the callback stack is empty, the event will simply be dropped). The callback might perform an action, such as starting to spin the scene, or it might delegate the event to one ofr
’s children.3
Using Anim3D
Both Modula-3 and Obliq support the concepts of modules and classes. (Obliq is based on prototypes and delegation, not classes and inheritance; however, it is expressive enough to simulate them.) For each kind of graphical object, there is a Modula-3 module in ANIM3D. This module contains the class of the graphical
object, and a set of its associated functions and variables. For each Modula-3 module, there is a “wrapper” that makes it accessible as a module from Obliq.
properties in the property mapping of a graphical object, and methods for pushing and popping the three callback stacks of the graphical object as well as for dispatch-ing events to their top callback objects. In addition, there is one property named
GO Transform, which names the spatial transformation property and is meaning-ful for all graphical objects. Unlike other properties, a transformation property does not “override” other transformations that are closer to the root, but is rather composed with them.
The moduleGroupGO contains the class of all graphical object groups, that is, graphical objects that are used to group other graphical objects together. The
GroupGOclass has methods for adding elements to a group and removing them again. The module also contains a functionNew, which creates a new group and returns it.
A 3D window is regarded as a special form of group, that contains all the objects in a scene (we therefore call it the “root” of the scene), and has some additional properties, such as the color of the background, whether depth cueing is in effect, etc. Also associated with each window is the camera that is currently active, and a “graphics base,” an abstraction of the underlying windows and graphics system. Finally, theRootGOmodule contains functionsNewandNewStd. The latter creates a new scene root object with reasonable default elements, callbacks, and properties (a perspective camera, two white light sources, top-level reactive behavior that allows the user to rotate and move the scene, and various surface properties).
Both PEX and OpenGL distinguish between lines and surfaces: surfaces are affected by light sources, lines are not. There are a variety of properties common to all surfaces: their color, transparency, reflectivity, shading model, and so on. Although it is legal to attach these properties to non-surfaces, it will not affect them. In order to emphasize that these properties are meaningful only for surfaces, we provide a moduleSurfaceGO, which contains the superclass of all graphical objects composed of surfaces, along with their related properties. We also provide aNonSurfaceGOmodule for lines and markers.
The moduleSphereGOcontains the class of spheres, which is a subclass of the
SurfaceGOclass. In addition to the definition of the sphere class,SphereGO con-tains a functionNewfor creating new sphere objects, and property namesCenter
andRadius, which are used to identify the properties determining the center and the radius of the sphere.
let root = RootGO_NewStd();
let planet = SphereGO_New([0,0,0],1); SurfaceGO_SetColor(planet,"lightblue"); root.add(planet);
let moon = SphereGO_New([3,0,0],0.5); SurfaceGO_SetColor(moon,"offwhite"); root.add(moon);
Property values can be time-variant; that is, their value depends on the time of the animation clock. Time-variant property values can either be unsynchronized or synchronized.
An unsynchronized property value starts to change at the moment it is created, and animates the graphical object
o
as long as it is attached too
. The animation does not need to be triggered by any special command. For instance, unsynchronized property values can be used to rotate the scene or some part of it for an indefinite period of time.Synchronized property values, on the other hand, are used to animate several
aspects of a scene in a coordinated fashion. Each synchronized property value is “tied” to an animation handle, and many values can be tied to the same handle. A synchronized property value object accepts animation requests, messages that ask it to change its current value, beginning at some starting time and lasting for a certain duration. When a client sends an animation request to a property value, the request is not immediately satisfied, but instead stored in a request queue local to the property value. Sending the messageanimateto an animation handle causes all property values controlled by this handle to be animated in synchrony. The call toanimatereturns when all animations are completed.
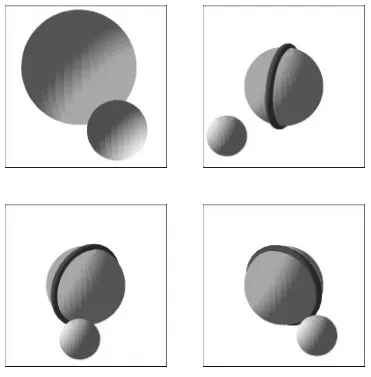
When added to the program above, the following few lines create a 25-second animation. The planet rotates six times about its axis, while the moon revolves once around the planet. In order to show the rotation better, we add a red torus around the planet, aligned to the axis of rotation. See Fig. 2.
let torus = TorusGO_New([0,0,0],[1,0,0],1,0.1); root.add(torus);
SurfaceGO_SetColor(torus,"red"); let ah = AnimHandle_New();
Note that we chose to attach the same transformation property to both the torus and the planet. Alternatively, we could have made a group containing both, and attached the transformation property just to this group.
4
Case Study: Shortest-Path Algorithm Animation
This section contains a case study of using ANIM3D with the Zeus algorithm anima-tion system [1] to develop an animaanima-tion of Dijkstra’s shortest-path algorithm. We first describe the algorithm, then sketch the desired visualization of the algorithm, and finally, present the actual implementation of the animation.
4.1
The Algorithm
The single-source shortest-path problem can be stated as follows: given a directed graph
G
= (
V;E
)
with weighted edges, and a designated vertexs
, called thesource, find the shortest path from
s
to all other vertices. The length of a path is defined to be the sum of the weights of the edges along the path.The following algorithm, due to Dijkstra [10], solves this problem (assuming all edge weights are non-negative):
for all
v
2V
doD
(
v
) :=
1D
(
s
) := 0
;S
:=
; whileV
nS
6=
;dolet
u
2V
nS
such thatD
(
u
)
is minimalS
:=
S
[fu
gfor all neighbors
v
ofu
doD
(
v
) := min
fD
(
v
)
;D
(
u
)+
W
(
u;v
)
g endforendwhile
In this pseudo-code,
D
(
v
)
is the distance froms
tov
,W
(
u;v
)
is the weight of the edge fromu
tov
, andS
is the set of vertices that have been explored thus far.V
nS
denotes those elements in
V
that are not also inS
.4.2
The Desired Visualization
An edge from
u
tov
with weightW
(
u;v
)
is shown by a white arrow which starts at the column overu
at height 0 and ends at the column overv
at heightW
(
u;v
)
.Whenever a vertex
u
is selected to be added toS
, the color of the corresponding disk changes from white to red. The additionD
(
u
) +
W
(
u;v
)
is animated by highlighting the arrow corresponding to the edge(
u;v
)
and lifting it to the top of the column (i.e. raising it byD
(
u
)
). IfD
(
u
) +
W
(
u;v
)
is smaller thanD
(
v
)
, the end of the arrow will still touch the green column overD
(
v
)
, otherwise, it will not. In the former case, we shrink the column overv
to heightD
(
u
)+
W
(
u;v
)
to reflect the assignment of a new value toD
(
v
)
, and color the arrow red, to indicate that it became part of the shortest-path tree. Otherwise, the arrow simply disappears.Upon completion, the 3D view shows a set of red arrows which form the shortest-path tree, and a set of green columns which represent the best distance
D
(
v
)
froms
tov
.4.3
Implementation of the Animation
In the Zeus framework, strategically important points of an algorithm are annotated with procedure calls that generate “interesting events.” These events are reported to the Zeus event manager, which in turn forwards them to all interested views. Each view responds to interesting events by drawing appropriate images. The advantages of this methodology are described elsewhere [6].
4.3.1 The Interesting Events
The interesting events for Dijkstra’s shortest-path algorithm (and many other shortest-path algorithms) are as follows:
addVertex(
u
,x
,y
,d
)adds a vertexu
(whereu
is an integer identifyingthe vertex) to the graph. The vertex is shown at position
(
x;y
)
in thexy
plane. In addition,D
(
u
)
is declared to bed
.selectVertex(
u
)indicates thatu
was added toS
.addEdge(
u
,v
,w
)adds an edge fromu
tov
with weightw
to the graph. raiseEdge(u
,v
,d
)visualizes the additionD
(
u
)+
W
(
u;v
)
by raising theedge
(
u;v
)
byd
(where the caller passesD
(
u
)
ford
).lowerDist(
u
,d
)indicates thatD
(
u
)
gets lowered tod
.promoteEdge(
u
,v
)indicates that the edge(
u;v
)
is part of the shortest-pathdemoteEdge(
u
,v
)indicates that the edge(
u;v
)
is not part of theshortest-path tree.
In addition, we need another event for house keeping purposes:
start(
m
)is called at the very beginning of an algorithm’s execution; itinitializes the view to hold up to
m
vertices and up tom
2edges.
4.3.2 Annotating the Algorithm
Here is an annotated version of the algorithm we showed in Section 4.1:
views.start(j
V
j)for all
v
2V
doD
(
v
) :=
1D
(
s
) := 0
;S
:=
;for all
v
2V
doviews.addVertex(v
,v
x,
v
y,D
(v
)) for all(
u;v
)
2E
doviews.addEdge(u
,v
,W
(u;v
)) whileV
nS
6=
;dolet
u
2V
nS
such thatD
(
u
)
is minimalS
:=
S
[fu
gviews.selectVertex(
u
)for all neighbors
v
ofu
doviews.raiseEdge(
u
,v
,D
(u
)) ifD
(
v
)
< D
(
u
) +
W
(
u;v
)
thenviews.demoteEdge(
u
,v
)else
D
(
v
) :=
D
(
u
) +
W
(
u;v
)
views.promoteEdge(
u
,v
) views.lowerDist(v
,D
(v
)) endifendfor endwhile
In this pseudo-code,viewsis the dispatcher provided by Zeus. The dispatcher will notify all views the user has selected for the algorithm.
4.3.3 The View
A view is an object that has a method corresponding to each interesting event, and a number of data fields. In this view, the data fields are as follows: a RootGO
light sources; arrays of graphical objects holding the disks (vertices), columns (distances), arrows (graph edges), and shortest-path tree edges; and an “animation handle” for triggering animations. This leads us to a skeletal view:
let view = {
scene => RootGO_NewStd(), ah => AnimHandle_New(),
verts => ok, (* initialized by method start *) dists => ok, (* initialized by method start *) parent => ok, (* initialized by method start *) edges => ok, (* initialized by method start *) start => meth(self,m) ... end,
addVertex => meth(self,u,x,y) ... end, selectVertex => meth(self,u) ... end, addEdge => meth(self,u,v,w) ... end, raiseEdge => meth(self,u,v,z) ... end, lowerDist => meth(self,u,z) ... end, promoteEdge => meth(self,u,v) ... end, demoteEdge => meth(self,u,v) ... end };
The Zeus system has a control panel that allows the user to select an algorithm and attach any number of views to it. Whenever the user creates a new 3D view, a new Obliq interpreter is started, and reads the view definition. The algorithm and all views run in the same process, but in different threads; thread creation is very light-weight. The expression above creates a new objectview, and initializes
view.sceneto be aRootGO, andview.ahto be an animation handle.
Thestartmethod is responsible for initializingview.verts,view.dists,
andview.parentto be arrays of size
m
, andview.edgesto be anm
m
array. The elements of the newly created arrays are initialized to the dummy valueok. Here is the code:
start => meth(self,m)
self.verts := array_new(m, ok); self.dists := array_new(m, ok); self.parent := array_new(m, ok); self.edges := array2_new(m, m, ok); end
TheaddVertexmethod adds a new vertex to the view. Vertices are
repre-sented by white disks that lie in the
xy
plane. Above each vertex, we also show a green column of heightd
, provided thatd
is greater than 0. The location of the cylinder’s base is constant, while its top is controlled by an animatable point property value.addVertex => meth(self,u,x,y,d)
self.verts[u] := DiskGO_New([x,y,0], [0,0,1], 0.2); self.scene.add(self.verts[u]);
if d > 0 then
let top = PointProp_NewSync(self.ah,[x,y,d]); self.dists[u] := CylinderGO_New([x,y,0], top, 0.1); SurfaceGO_SetColor(self.dists[u],"green");
self.scene.add(self.dists[u]); end;
end
TheselectVertexmethod indicates that a vertex
u
has been added to theset
S
by coloringu
’s disk red:selectVertex => meth(self,u)
TheaddEdgemethod adds an edge (represented by an arrow) from vertex
u
to vertexv
. The arrow starts at the disk representingu
, and ends at the column overv
at heightw
. An arrow is composed of a cone, a cylinder, and two disks; its geometry is computed based on the “Center” property of the disks representing the vertices to which it is attached. The following diagram illustrates this relationship:w
b a
c e
And here is the code for the method:
addEdge => meth(self,u,v,w)
let a = DiskGO_GetCenter(self.verts[u]).get(); let b = DiskGO_GetCenter(self.verts[v]).get(); let c = Point3_Plus(b,[0,0,w]);
let d = Point3_Minus(c,a);
let e = Point3_Minus(c,Point3_Scale(d,0.4)); let grp = GroupGO_New();
grp.setProp(GO_Transform, TransformProp_NewSync(self.ah)); grp.add(DiskGO_New(a,d,0.1));
TheraiseEdgemethod highlights the edge from
u
tov
by coloring it yellow,and then lifting it up by
z
. The arrow is moved by sending a “translate” request to its transformation property. The translation is controlled by the animation handleself.ah, and shall take 2 seconds to complete. Callingself.ah.animate()causes all animation requests controlled byself.ah
to be processed.
raiseEdge => meth(self,u,v,z)
SurfaceGO_SetColor(self.edges[u][v],"yellow"); let pv = GO_GetTransform(self.edges[u][v]); pv.getBeh().translate(0,0,z,0,2);
self.ah.animate(); end
The methodlowerDistindicates that the cost
D
(
u
)
of vertexu
got lowered,by shrinking the green cylinder representing
D
(
u
)
. This is done by sending alinMoveTo(“move over a linear path to”) request to the “Point2” property of the cylinder.lowerDist => meth(self,u,z)
let pv = CylinderGO_GetPoint2(self.dists[u]); let p = pv.get();
pv.getBeh().linMoveTo([p[0], p[1], z], 0, 2); self.ah.animate();
end
The methodpromoteEdgeindicates that
(
u;v
)
, the edge that is currentlyhighlighted, shall become part of the shortest-path tree. This is indicated by coloring the edge red. If there already was a red edge leading to
v
, it is removed from the view.promoteEdge => meth(self,u,v)
SurfaceGO_SetColor(self.edges[u][v],"red"); if self.parent[v] isnot ok then
self.demoteEdge(self.parent[v],v); end;
Finally, the methoddemoteEdgeremoves the edge
(
u;v
)
from the view:demoteEdge => meth(self,u,v)
self.scene.remove(self.edges[u][v]); end
This completes our example. The complete view is about 70 lines of code, compared to the roughly 2000 lines of the PEXlib-based version that generated the animations presented in [5]. This measure is fairly honest; we did not add any functionality (such as a new classArrowGO) to the base library in order to optimize this example. Furthermore, turnaround time during the design of this view was limited only by the design process per se (and our typing speed), whereas compiling a single file and relinking with the Zeus system takes several minutes.
5
Related Work
There are two areas that have influenced ANIM3D: general-purpose 3D animation libraries and algorithm animation systems that have been used for developing 3D views.
The most closely related general-purpose animation library is OpenInven-tor [17, 18], an object-oriented graphics library with a C++ API. OpenInvenOpenInven-tor, like ANIM3D, represents a scene as a DAG of “nodes”. Geometric primitives,
cameras, lights, and groups are all special types of nodes. However, there are three key differences between ANIM3D and OpenInventor:
ANIM3D includes an embedded interpretive language, which is instrumental
for achieving fast turnaround and short design cycles.
OpenInventor views properties (such as colors and transformations) as
or-dinary nodes in the scene DAG. This means that the order of nodes in a group becomes important. In this respect, ANIM3D is more declarative than OpenInventor: the order in which objects are added to a group does not matter.
In a number of aspects, OpenInventor requires the programmer to do more
work than ANIM3D requires. For example, OpenInventor clients have to explicitly redraw a scene whereas ANIM3D uses a damage-repair model to
Nonetheless, OpenInventor is a very impressive commercial product that greatly simplifies 3D graphics. Many of the ideas of OpenInventor can be found in work done at Brown University [16, 19].
There are three algorithm animation systems that have been used for developing 3D views, Pavane, Polka3D, and GASP.
In Pavane [8], the computational model is based on tuple-spaces and mappings between them. Entering tuples into the “animation tuple space” has the side-effect of updating the view. A small collection of 3D primitives are available (points, lines, polygons, circles, and spheres), and the only animation primitives are to change the positions of the primitives.
Polka3D [14], like Zeus, follows the BALSA model for animating algorithms. Algorithms communicate with views using “interesting events,” and views draw on the screen in response to the events. The graphics library is similar to ANIM3D in goals and features, but it appears to be a bit slimmer and more focused on algorithm animations. Unlike our system, views are not interpreted, so turnaround time is not instantaneous.
The GASP [9] system is tuned for developing animations of computational geometry algorithms involving three (and two) dimensions. Because a primary goal of the system is to isolate the user from details of how the graphics is done, a user is limited to choosing from among a collection of animation effects supplied by the system. The viewing choices are typically stored in a separate “style” file that is read by the system at runtime; thus, GASP provides rapid turnaround. However, it does not provide the flexibility to develop arbitrary views with arbitrary animation effects.
6
Conclusion
The first part of this report described ANIM3D, an object-oriented 3D animation li-brary targeted at visualizing combinatorial structures, and in particular at animating algorithms. The second part presented a case study showing how to use ANIM3D
within the Zeus algorithm animation system for producing a 3D visualization of a graph-traversal algorithm.
ANIM3D is based on three concepts: scenes are described by DAGs of
graph-ical objects, time-variant property values are the basic animation mechanism, and callbacks are the mechanism by which clients can specify reactive behavior. These concepts provide a simple, yet powerful framework for building animations.
References
[1] Marc H. Brown. Zeus: A System for Algorithm Animation and Multi-View Editing. 1991 IEEE Workshop on Visual Languages (October 1991), 4–9.
[2] Marc H. Brown. The 1992 SRC Algorithm Animation Festival. 1993 IEEE
Symposium on Visual Languages (August 1993), 116–123.
[3] Marc H. Brown. The 1993 SRC Algorithm Animation Festival. Research Report 126, Digital Equipment Corp., Systems Research Center, Palo Alto, CA (1994).
[4] Marc H. Brown and John Hershberger. Color and Sound in Algorithm Ani-mation. Computer, 25(12):52–63, December 1992.
[5] Marc H. Brown and Marc Najork. Algorithm Animation Using 3D Interac-tive Graphics. ACM Symposium on User Interface Software and Technology (November 1993), 93–100.
[6] Marc H. Brown and Robert Sedgewick. A System for Algorithm Animation.
Computer Graphics, 18(3):177–186, July 1984.
[7] Luca Cardelli. Obliq: A language with distributed scope. Research Report 122, Digital Equipment Corp., Systems Research Center, Palo Alto, CA (June 1994).
[8] Gruia-Catalin Roman, Kenneth C. Cox, C. Donald Wilcox, and Jerome Y. Plun. Pavane: A System for Declarative Visualization of Concurrent Com-putations. Journal of Visual Languages and Computing, 3(2):161–193, June 1992.
[9] David Dobkin and Ayellet Tal. GASP—A System to Facilitate Animating Geometric Algorithms. Technical Report, Department of Computer Science, Princeton University, 1994.
[10] E. W. Dijkstra. A note on two problems in connexion with graphs. Numerische
Mathematik, 1:269–271, 1959.
[12] Steven C. Glassman. A Turbo Environment for Producing Algorithm Anima-tions. 1993 IEEE Symp. on Visual Languages (August 1993), 32–36.
[13] Mark S. Manasse and Greg Nelson. Trestle Reference Manual. Research Report 68, Digital Equipment Corp., Systems Research Center, Palo Alto, CA, December 1991.
[14] John T. Stasko and Joseph F. Wehrli. Three-Dimensional Computation Visu-alization. 1993 IEEE Symposium on Visual Languages (August 1993), 100 – 107.
[15] John T. Stasko. TANGO: A Framework and System for Algorithm Animation.
Computer, 23(9):27–39, September 1990.
[16] Paul S. Strauss. BAGS: The Brown Animation Generation System. Technical Report CS–88–22, Brown University, May 1988.
[17] Paul S. Strauss. IRIS Inventor, a 3D Graphics Toolkit. OOPSLA’93 Conf.
Proc., (September 1993), 192–200.
[18] Paul S. Strauss and Rikk Carey. An Object-Oriented 3D Graphics Toolkit.
ACM Computer Graphics (SIGGRAPH ’92) (July 1992), 341–349.
[19] Robert C. Zeleznik et al. An Object-Oriented Framework for the Integration of Interactive Animation Techniques. ACM Computer Graphics (SIGGRAPH