ISSN: 1992-8645 www.jatit.org E-ISSN: 1817-3195
INTEGRATED MODEL FOR PRODUCT QUALITY
FORECASTING SYSTEM USING GREY THEORY AND
NEURAL NETWORK
JIHONG PANG, WEI XUE, HONGMING ZHOU, FENGPING LI
College of Mechanical and Electronic Engineering, Wenzhou University, Wenzhou 325035, Zhejiang, China
ABSTRACT
High-quality products are considered as one of the most important practices for achieving success. However, it is really hard to predict and forecast the product quality due to some undetermined parameters. In order to forecast product quality from various aspects, we propose an integrated model of utilizing grey theory and neural network. In this paper, the grey forecasting model for product quality is established by applying grey theory. Grey model is applied to compute an aggregated efficiency score based on the input and output data. Since quantitative factors are difficult to mathematically manipulate when forecasting the efficiency in neural network, a forecasting model is developed for product quality based on grey neural network model. In addition, analytical capability of the proposed method can reduce the number of training samples. In our case, this approach is demonstrated on a real and complete dataset of 36 samples for product quality. Finally, an example is given to explain the use and effectiveness of the proposed computational approach. As a result of this research, grey neural network can now be adequately applied to forecast the product quality.
Keywords: Product Quality, Forecasting System, Grey Theory, Neural Network
1
INTRODUCTIONProduct quality is strongly affected by the quality of the external environment. In recent years, the concept of product quality has been transformed from fitness for use to customer satisfaction[1]. Today, product quality is facing new challenges as well as in the years ahead in the twenty-first century[2, 3]. Achieving success in a more and more careful market, the product quality must have great progress[4]. However, the development and maintenance of forecasting system of product quality has proven to be an enormous and complex process[5]. An effective forecasting system of product quality is of paramount importance for many manufactures.
On the other hand, manufacture enterprises must work well and bring an awareness of the need for high-quality products for their customers[6]. It is important for future decision-making where decision-makers are interested in knowing the changes required in combining input resources so it can be classified into a desired product quality[7]. The forecasting of different levels of product quality could help the management in identifying the quality of design and manufacture process to work out appropriate interventions to improve the quality.
This study has identified the forecasting problems of failing to deal with diversification and develops an iterative approximation procedure to deal with it. This paper allows us to help quality professionals and quality organizations in making better forecast in the future.
ISSN: 1992-8645 www.jatit.org E-ISSN: 1817-3195
2
INTEGRATED MODEL FOR PRODUCT QUALITY FORECASTING SYSTEM
In recent years, many researchers have proposed various forecasting methods for dealing with the imprecise and ambiguous data of product quality. In the area of product quality forecasting, there have been received significant attention over the last decade. And there was a need to be able to solve the forecasting problem of product quality without affecting the product structure and performance.
In the last twenty years, many research studies of product quality forecasting have focused on the new methodologies for improving the forecast accuracy. To enhance the reliability and validity of product quality forecasting, an integrated model based on grey theory and neural network was built in this paper[12]. First, the grey theory can avoid complex calculation in all multipliers on quality indicators so that it can handle an occurrence of multiple forecasting. Secondly, the grey neural network model was applied to forecast all product quality by using a limited number of product quality indicators in different reference sets. So, grey neural network is a useful tool for forecasting the product quality. Further, neural network was applied to enumerate the role of selected quality factors and procedure degradation with the final aim of optimizing the calculate process.
It was decided that, in order to gain some quantitative knowledge of the forecasting, a system should be built by the integrated model based on grey theory and neural network. On a general level, the use of forecasting system to forecast product quality was most successful and the system was implemented with minimum calculate procedure. Through grey theory and neural network, there can be large improvements in higher product quality to meet international standards.
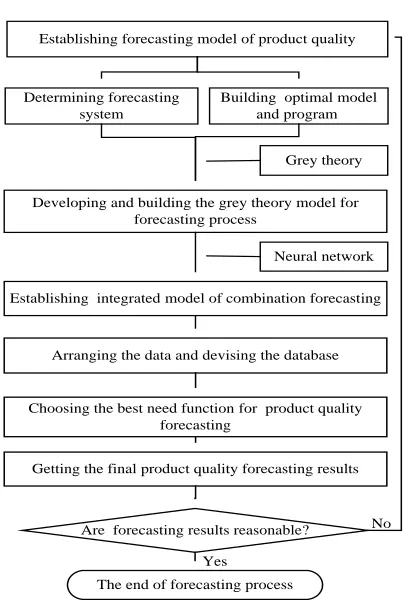
The main objective of this paper is to explore policymakers’ attitudes and perceptions about forecasting process. This will help manufacturing companies improve the skill of product quality prediction. The integrated model for product quality forecasting system based on grey neural network is shown in Figure 1. Then, we can divide the several steps of the algorithm into separate modules for composite analysis.
No
Yes
Developing and building the grey theory model for forecasting process
Arranging the data and devising the database
Choosing the best need function for product quality forecasting
Establishing forecasting model of product quality
Determining forecasting system
Building optimal model and program
Establishing integrated model of combination forecasting
Are forecasting results reasonable? Grey theory
Neural network
[image:2.612.316.518.91.391.2]The end of forecasting process Getting the final product quality forecasting results
Figure 1: The Integrated Model For Product Quality Forecasting
The following steps show how to apply the integrated model to forecast the product quality based on grey theory and neural network. It will be a process that unfolds over two stages.
In the first stage, the discrete grey optimization model needs to be constructed. The grey prediction is the key part of grey theory. Grey theory is a powerful tool for solving the problems of uncertainty with few data[13]. Grey theory has obtained the fast development based on modern systems science and uncertainty systems theory since the early 1980s[14, 15]. The cardinal principle of grey theory is that relationships between those elements can be defined by using the close geometrical patterns of sequence curves[16]. From coming into being, grey theory has been widely applied in various fields[17, 18].
First of all, the normalization of cost-type indices is done using the following equation:
* max ( ) ( )
( )
max ( ) min ( )
i i
i
i i
x l x l
x l
x l x l
− =
− (1)
ISSN: 1992-8645 www.jatit.org E-ISSN: 1817-3195
*( ) ( ) min ( )
max ( ) min ( )
i i
i
i i
x l x l
x l
x l x l
− =
− (2)
In the next step, the GM (1,1) grey model is applied to fitting and forecasting the product quality by using grey theory.
Since a lot of our analysis needs to be taken uncertainty factors into account, the prime objective is to build time series views into the data. For this reason, we must assume about the use of these time series, as the following formula definition shows.
(0) (0) (0) (0)
( )t ( ( )t (1), ( )t (2), , ( )t ( ) )
X = X X X m (3)
In the next step, the accumulated sequence can be established by the following formula:
(1) (1) (1) (1)
( )t ( ( )t (1), ( )t (2), , ( )t ( ) )
X = X X X m (4)
(1) (1) (1) (1)
( )t ( ( )t (1), ( )t (2), , ( )t ( ) )
Y = Y Y Y m (5)
(1) (1)
( ) ( 1)
(1) ( ) ( ) ( ) ( ) 2 t t t
Y l Y l
Y l = + − (6)
Where, t = 2, 3, …, m.
On the next line, we are creating an expression for GM (1,1) grey model in the following:
(0) (0)
( )t ( ) ( )t ( )
X l +eY l = f (7)
By using the building mechanism of grey forecast model, we can finish many accumulated sequence in the following formulae:
(1) (0)
( )( ) ( )( ) , ( 1, 2, , )
l
t t i t
X l =
∑
= X i i= m (8)Then, the difference equation of GM (1,1) model can be confirmed by the following expression definition.
(1)
( ) (1)
( ) t X t t d eX u
d + = (9)
So the linear equation set can be solved by means of least square method by using the following formula:
( )
1 Te
T A
A A Y
u
β = = −
(10)
Besides, the arrangement process is completed by matching the following matrix A and matrix Y:
(1) (1)
( ) ( )
(1) (1)
( ) ( )
( (2) (2)) / 2 1
( ( ) ( 1)) / 2 1
t t
t t
X X
A
X m X m
− + = − + − (11) (0) ( ) (0) ( ) (2) ( ) t t X Y X m =
(12)
Therefore, the time respond function of grey prediction model can be calculated by the following formula:
(0) (1) (1)
( )t ( ) ( )t ( ) ( )t ( 1)
X l = X l −X l− (13)
In the second stage, the prediction model of neural network is studied. Neural network is a branch of artificial intelligence. So the neural network is an efficient method for learning complex mappings from a set of examples[19-21]. Based on the biological nervous system, the structures of neural network can be well established[22, 23]. A review of the developments in neural network has been well discussed in many thesises[24-26].
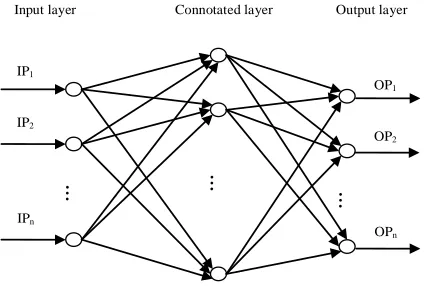
[image:3.612.313.525.449.593.2]Based on grey theory, this paper also has used the neural network model to forecast the product quality. The common neural network modeling is shown in Figure 2. Here, we can get the input data for neural network modeling from the grey prediction model.
OP1 OP2 OPn IP2 IPn IP1 … … …
Input layer Connotated layer Output layer
Figure 2: The Neural Network Modeling
Then, the weighting matrix of output layer can be computed by using this formula:
2 1 1 ( ) i m ij ij j e y x = = −
∑
(14)ISSN: 1992-8645 www.jatit.org E-ISSN: 1817-3195
And this will provide some references for us to choose the right weighting matrix of output layer.
Next, the number of nodes of each hidden layer of the network can be determined:
1 2
( )
i i i
C = IP+OP +ε (15)
Where, IPi is the number of nodes of input layer,
OPi is the number of nodes of output layer, and
1≤ ≤ε 10.
Finally, the error metric of sample collection for neural network by using the following formula:
1 m
i i
e e
=
=
∑
(16)From what we have mentioned above, the new method is a mixed prediction method that is composed of grey theory and neural network.
3
CASE STUDYThe main purpose of this paper is to provide forecasting information for product quality based on grey theory and neural network. In this study, the forecasting system was developed in close consultation with product management department and enterprise managers. This approved approach is very applicable when dealing with complex and strong nonlinear forecasting processes. In this paper, six quality indicators (QIs) of product quality were selected for close observation in the forecasting process.
Attention was focused on the data processing as it was extremely important. And the usefulness and effectiveness of the developed solution concept depends on basal data. It was found that, although records were kept of the forecasting process, there was no analysis of the original data without special method.
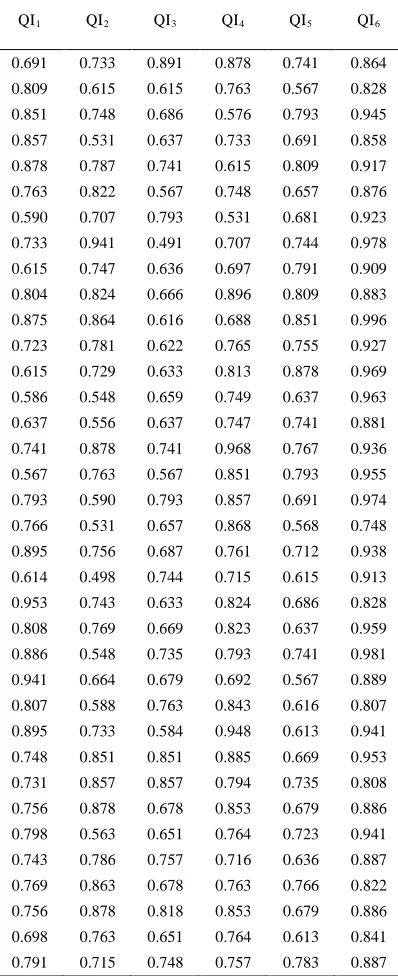
Based on grey theory neural network, the forecast system of product quality could be carried out. In general, a complete product quality forecast system should include the following six QIs: functionality (QI1), credibility (QI2), technical performance (QI3), serviceability (QI4), economy (QI5) and environmental effect (QI6). Then, the normalized data of six QIs are shown in Table I. In this stage, we can find an adjusted efficiency score for each QI.
Here, the 36 samples were split into several sets for training and testing by using grey theory and neural network. Firstly, the forecasting of the data of each QI is verified through grey theory modeling. In
[image:4.612.315.514.139.627.2]the next, the proposed method consists on a neural network model of train.
TABLE I : Normalized Data Of Six Quality Indicators
QI1 QI2 QI3 QI4 QI5 QI6
0.691 0.733 0.891 0.878 0.741 0.864
0.809 0.615 0.615 0.763 0.567 0.828
0.851 0.748 0.686 0.576 0.793 0.945
0.857 0.531 0.637 0.733 0.691 0.858
0.878 0.787 0.741 0.615 0.809 0.917
0.763 0.822 0.567 0.748 0.657 0.876
0.590 0.707 0.793 0.531 0.681 0.923
0.733 0.941 0.491 0.707 0.744 0.978
0.615 0.747 0.636 0.697 0.791 0.909
0.804 0.824 0.666 0.896 0.809 0.883
0.875 0.864 0.616 0.688 0.851 0.996
0.723 0.781 0.622 0.765 0.755 0.927
0.615 0.729 0.633 0.813 0.878 0.969
0.586 0.548 0.659 0.749 0.637 0.963
0.637 0.556 0.637 0.747 0.741 0.881
0.741 0.878 0.741 0.968 0.767 0.936
0.567 0.763 0.567 0.851 0.793 0.955
0.793 0.590 0.793 0.857 0.691 0.974
0.766 0.531 0.657 0.868 0.568 0.748
0.895 0.756 0.687 0.761 0.712 0.938
0.614 0.498 0.744 0.715 0.615 0.913
0.953 0.743 0.633 0.824 0.686 0.828
0.808 0.769 0.669 0.823 0.637 0.959
0.886 0.548 0.735 0.793 0.741 0.981
0.941 0.664 0.679 0.692 0.567 0.889
0.807 0.588 0.763 0.843 0.616 0.807
0.895 0.733 0.584 0.948 0.613 0.941
0.748 0.851 0.851 0.885 0.669 0.953
0.731 0.857 0.857 0.794 0.735 0.808
0.756 0.878 0.678 0.853 0.679 0.886
0.798 0.563 0.651 0.764 0.723 0.941
0.743 0.786 0.757 0.716 0.636 0.887
0.769 0.863 0.678 0.763 0.766 0.822
0.756 0.878 0.818 0.853 0.679 0.886
0.698 0.763 0.651 0.764 0.613 0.841
0.791 0.715 0.748 0.757 0.783 0.887
ISSN: 1992-8645 www.jatit.org E-ISSN: 1817-3195
Then, we can draw the characteristic curve of six QIs in the following figures.
0 10 20 30 40
[image:5.612.330.514.251.395.2]0.55 0.6 0.65 0.7 0.75 0.8 0.85 0.9 0.95 1
Figure 3: Characteristic curve of functionality (QI1)
0 10 20 30 40
0.45 0.5 0.55 0.6 0.65 0.7 0.75 0.8 0.85 0.9 0.95
Figure 4: Characteristic curve of credibility (QI2)
0 10 20 30 40
0.45 0.5 0.55 0.6 0.65 0.7 0.75 0.8 0.85 0.9
Figure 5: Characteristic curve of technical performance (QI3)
0 10 20 30 40
[image:5.612.112.275.282.397.2]0.5 0.55 0.6 0.65 0.7 0.75 0.8 0.85 0.9 0.95 1
Figure 6: Characteristic curve of serviceability (QI4)
0 10 20 30 40
0.55 0.6 0.65 0.7 0.75 0.8 0.85 0.9 0.95
Figure 7: Characteristic curve of economy (QI5)
0 10 20 30 40
0.7 0.75 0.8 0.85 0.9 0.95 1
Figure 8: Characteristic curve of environmental effect (QI6)
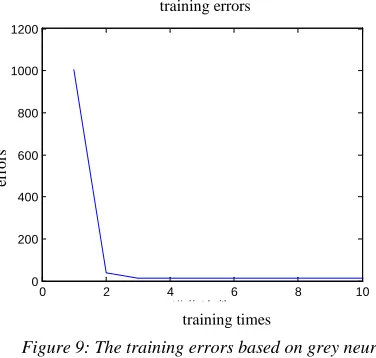
In the next step, we can get the training errors distribution by the training times based on grey neural network. Figure 9 shows the training errors for product quality forecasting system.
0 2 4 6 8 10
0 200 400 600 800 1000 1200
[image:5.612.109.277.432.720.2]进化次数
Figure 9: The training errors based on grey neural network
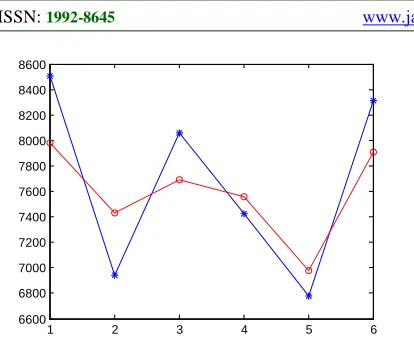
Finally, we can select the optimal mathematical model based on the errors, and then gives the model of train. The difference of the real and forecasted result from 31 samples to 36 samples is shown in Figure 10. The blue curve shows the result of the situation. And the red curve shows the result in the forecasting process.
erro
rs
training errors
[image:5.612.320.508.455.634.2] [image:5.612.114.274.584.711.2]ISSN: 1992-8645 www.jatit.org E-ISSN: 1817-3195
1 2 3 4 5 6
[image:6.612.92.299.73.247.2]6600 6800 7000 7200 7400 7600 7800 8000 8200 8400 8600
Figure 10: The Comparison Between The Forecasting Data And The Actual Data
Based on the above, this case has presented the comparison of computed and real results, and the forecasting error is within 7% through experimental verification. The results of the case study show that the prediction values given by theory and neural network are better than that of other methods. And the adjustment of forecasting process when better external information becomes available is an area requiring more attention.
4
CONCLUSIONSThis paper has presented an integrated model of product quality forecasting system based on grey theory and neural network. To the best of our knowledge, this paper contributes to the existing literature by developing an innovative research framework. Besides, the product quality can be forecasted by using the new application of grey neural network model with sparse input and output data. And this will help business people and policymakers to find an efficient way to achieve better product quality for their customers. The proposed approach is useful in dealing with such a limited number of product samples, and the results are more representative and persuasive.
This study concludes that such analysis can be quite useful in a variety of circumstances. To document their practical implications, this study has applied the proposed approach to forecast the quality of products. As a consequence, this study finds that grey neural network is a forecasting tool for the product quality. So, grey neural network is useful for the busy leaders and enterprise managers. Furthermore, we have presented some useful implications and applications both for academicians and practitioners in this paper. The directions of the approved method will be discussed and offered in future research.
ACKNOWLEDGMENTS
The work of this paper is supported by the Natural Science Fund of Guangdong Province (No. S2011010004006), the Science and Technology Planning Project of Zhaoqing City (No. 2010F006, No. 2011F001), and the Research Initiation Fund of Zhaoqing University (No. 2012KQ01).
REFRENCES:
[1] K. Das, A. H. Chowdhury, "Designing a reverse logistics network for optimal collection, recovery and quality-based product-mix planning", International Journal of Production Economics, vol. 135, No. 1, 2012, pp. 209-221. [2] A. Rahim, M. Shakil, "A tabu search algorithm
for determining the economic design parameters of an integrated production planning, quality control and preventive maintenance policy", International Journal of Industrial and Systems Engineering, vol. 7, No. 4, 2011, pp. 477-497.
[3] V. Fantin, P. Buttol, R. Pergreffi, P. Masoni, "Life cycle assessment of Italian high quality milk production. A comparison with an EPD study", Journal of Cleaner Production, vol. 28, 2012, pp. 150-159.
[4] D. P. McIntyre, "Where there's a way, is there a will? Installed base and product quality in a network industry", Journal of High Technology Management Research, vol. 22, No. 1, 2011, pp. 59-66.
[5] D. Dey, S. Kumar, "Reassessing data quality for information products", Management Science, vol. 56, No. 12, 2010, pp. 2316-2322.
[6] I. Kyriakidis, K. Karatzas, G. Papadourakis, J. A. Ware, "Using artificial intelligence methods to understand and forecast atmospheric quality parameters", Engineering Intelligent Systems, vol. 20, No. 1-2, 2012, pp. 137-149.
[7] S. Palani, S. Y. Liong, P. Tkalich, "An ANN application for water quality forecasting", Marine Pollution Bulletin, vol. 56, No. 9, 2008, pp. 1586-1597.
ISSN: 1992-8645 www.jatit.org E-ISSN: 1817-3195
[9] T. Y. Pai, K. L. Lin, J. L. Shie, T. C. Chang, B.Y. Chen, "Predicting the co-melting temperatures of municipal solid waste incinerator fly ash and sewage sludge ash using grey model and neural network", Waste Management and Research, vol. 29, No. 3, 2011, pp. 284-293.
[10] R. Sallehuddin, S. M. Hj. Shamsuddin, "Hybrid grey relational artificial neural network and auto regressive integrated moving average model for forecasting time-series data", Applied Artificial Intelligence, vol. 23, No. 5, 2009, pp. 443-486. [11] S. Alvisi, M. Franchini, "Grey neural networks
for river stage forecasting with uncertainty", Physics and Chemistry of the Earth, vol. 42-44, 2012, pp. 108-118.
[12] Y. F. Hsiao, Y. S. Tarng, K. Y. Kung, "Comparison of the grey theory with neural network in the rigidity prediction of linear motion guide", WSEAS Transactions on Applied and Theoretical Mechanics, vol. 4, No. 1, 2009, pp. 32-41.
[13] N. Slavek, A. Jovic, "Heptathlon evaluation model using Grey system theory Model vrednovanja sedmoboja upotrebom sive relacijske analize", Tehnicki Vjesnik, vol. 19, No. 2, 2012, pp. 327-331.
[14] N. Beri, A. Kumar, S. Maheshwari, C. Sharma, "Optimisation of electrical discharge machining process with CuW powder metallurgy electrode using grey relation theory", International Journal of Machining and Machinability of Materials, vol. 9, No. 1-2, 2011, pp. 103-115.
[15] E. Kayacan, B. Ulutas, O. Kaynak, "Grey system theory-based models in time series prediction", Expert Systems with Applications, vol. 37, No. 2, 2010, pp. 1784-1789.
[16] A. Amanna, M. J. Price, R. Thamvichai, "Grey systems theory applications to wireless communications", Analog Integrated Circuits and Signal Processing, vol. 69, No. 2-3, 2011, pp. 259-269.
[17] J. C. Moran, J. L. Miguez, J. Porteiro, D. Patino, E. Granada, J. Collazo, "Study of the feasibility of mixing Refuse Derived Fuels with wood pellets through the grey and Fuzzy theory", Renewable Energy, vol. 34, No. 12, 2009, pp. 2607-2612.
[18] B. M. Gopalsamy, B. Mondal, S. Ghosh, "Optimisation of machining parameters for hard
machining: Grey relational theory approach and ANOVA", International Journal of Advanced Manufacturing Technology, vol. 45, No. 11-12, 2009, pp. 1068-1086.
[19] C. E. Davis, G. S. May, "Neural network control of variable-frequency microwave processing of polymer dielectric curing", IEEE Transactions on Electronics Packaging Manufacturing, vol. 31, No. 2, 2008, pp. 104-113.
[20] J. Zolock, R. Greif, "A methodology for the modeling of forced dynamical systems from time series measurements using time-delay neural networks", Journal of Vibration and Acoustics, Transactions of the ASME, vol. 131, No. 1, 2009, pp. 0110031-01100310.
[21] J. F. Horn, E. M. Schmidt, B. R. Geiger, M. P. DeAngelo, "Neural network-based trajectory optimization for unmanned aerial vehicles", Journal of Guidance, Control, and Dynamics, vol. 35, No. 2, 2012, pp. 548-562.
[22] L. Maguire, "Does soft computing classify research in spiking neural networks?", International Journal of Computational Intelligence Systems, vol. 3, No. 2, 2010, pp. 176-189.
[23] T. Q. Huynh, J. A. Reggia, "Guiding hidden layer representations for improved rule extraction from neural networks", IEEE Transactions on Neural Networks, vol. 22, No. 2, 2011, pp. 264-275.
[24] F. Khosrowshahi, "Innovation in artificial neural network learning: Learn-On-Demand methodology", Automation in Construction, vol. 20, No. 8, 2011, pp. 1204-1210.
[25] M. Paliwal, U. A. Kumar, "The predictive accuracy of feed forward neural networks and multiple regression in the case of heteroscedastic data", Applied Soft Computing Journal, vol. 11, No. 4, 2011, pp. 3859-3869.