1
Final Report: Defra PE0206 Field Testing of Mitigation Options
Clare Deasy
1, John Quinton
1, Martyn Silgram
2, Bob Jackson
2,
Alison Bailey
3& Carly Stevens
11Lancaster Environment Centre, Lancaster University. 2ADAS Wolverhampton. 3Department of Agriculture, University of Reading.
1. Executive summary
The Mitigation Options for Phosphorus and Sediment (MOPS) project aimed to investigate the efficacy and cost-effectiveness of different in-field mitigation options which could be used to control diffuse pollution losses in surface runoff from arable fields under combinable crops. In order to achieve this, a literature review, field experimentation, and economic analysis were undertaken.
A review of the literature highlighted the large toolbox of mitigation measures available to land managers, but also demonstrated that there are few studies determining the effectiveness of these measures for controlling diffuse pollution across a range of soils in the UK. In particular, little reference could be found in the literature addressing the control of diffuse pollution from tractor wheelings.
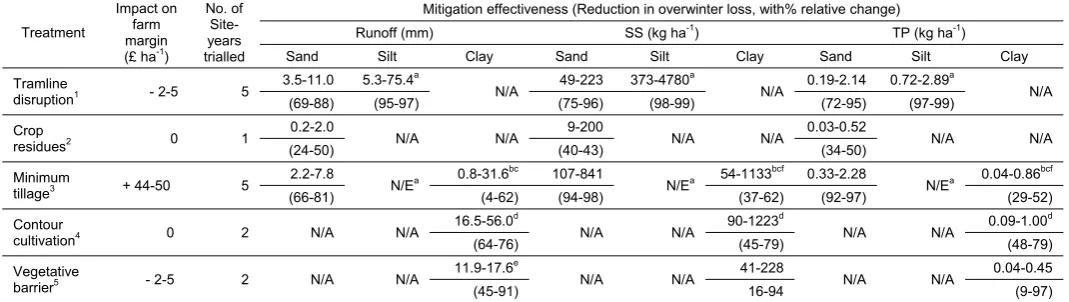
Field studies of mitigation options were carried out over three years at three sites in the UK with contrasting soil types: clay soils at Loddington (Leicestershire), silty-clay-loam soils at Rosemaund (Herefordshire) and sandy soils at Old Hattons (Staffordshire). All sites had similar long-term annual rainfalls (range 650-700 mm) and similar slope gradients (4-5°). Over the nine site-years, a total of 19 treatment options were trialled. These included conventional cultivation measures (as controls) and a range of mitigation measures (tramline disruption, residue incorporation, minimum tillage, contour cultivation, and vegetative barriers), which were considered both separately and in combinations. Losses of runoff, suspended sediment (SS) and phosphorus (P) were monitored from 52 hillslope lengths (68-270 m) giving a total of 156 plot-years of data collected. Table E1 summarises the effectiveness of each of the treatments at controlling losses of runoff, SS and P from arable fields under winter-sown combinable crops, and shows the results of the economic analysis of mitigation options, which was undertaken at the farm scale using standard farm rotations for the three years of the project. The results of this work demonstrate that:
• Compacted, unvegetated tractor wheelings (tramlines) were important sources and pathways for pollutant transport at all sites. At Rosemaund, on silty soils, runoff from tramlines was around 20 to 40 times greater, and losses of SS and total P (TP) were up to 300 times greater from tramlines than losses from vegetated areas without tramlines. At Old Hattons on coarser sandy soils, losses of runoff, SS and TP were between five and 30 times greater from tramline areas, and at Loddington, on heavy clay soils in year 3, losses from tramline areas were between two and six times greater than from areas without tramlines. The results reported in this project indicate that practical management options for tramlines could substantially reduce the risk of surface loss of runoff and associated SS and P.
• Disrupting tramlines using a simple tine reduced runoff by 69-97%, losses of SS by 75-99%, and losses of TP by 72-99%, compared to losses from conventionally-wheeled tramline areas. Tramline disruption was effective in four out of five site-years at Rosemaund and Old Hattons. Costs at the farm scale are low at £2-5 ha-1, assuming a typical field rotation, 24 m tramline spacing and a work
rate of 5-10 ha hr-1 depending on soil type. The importance of tramlines in influencing diffuse pollution
means that focusing on tramline losses of SS and P using a form of the tramline disruption treatment trialled in this project, or another tramline management option, could be a very effective way to reduce sediment and P losses from arable land on moderate slopes. Further research is needed to ensure that practical recommendations are made for different soil types, but once this is completed tramline disruption has the potential to be one of the most cost-effective methods of reducing diffuse pollution losses from combinable crops.
2
significant. Incorporation of crop residues may incur costs through lost revenues from straw sales, and additional costs of £25 ha-1, where straw chopping is not part of the harvest operation.
• Minimum tillage was generally an effective means of controlling sediment and nutrient loss, although this effect differed between sites and between years. Minimum tillage was effective on the clay soils at Loddington in year 2 (p<0.05), significantly reducing runoff, SS and TP losses; runoff losses were reduced by 36-53%, SS losses were reduced by 37-62% and TP losses by 37-52%. In year 3, minimum tillage was not effective for areas under contour cultivation, or for areas containing tramlines, but reduced losses of runoff, SS and TP from areas cultivated up-and-down the slope by 34-62%. On sandy soils at Old Hattons in year 3, minimum tillage proved highly effective, reducing SS and TP loads by over 92% compared to traditional plough cultivation. At Rosemaund in year 3, SS and TP losses increased under minimum tillage, but these results should be considered in the context of a relatively dry winter monitoring period. Minimum tillage generates cost savings at the farm scale of £44 to £50 ha-1, although savings from as little as £10 ha-1 are reported in the literature.
• Cultivation on the contour under traditional ploughing was an effective mitigation treatment for traditionally ploughed soils at Loddington in both the years it was trialled, reducing TP losses by 48-79%, which is higher than the figure of 25-25% reported in the DWPA manual (Cuttle et al., 2007). Reductions for contour cultivation for both minimum tillage and ploughed areas were significant in year 2. The cost of converting to contour cultivation was not explicitly costed, although costs of £5 ha-1 have been reported elsewhere. Contour cultivation has the potential to be an effective mitigation option on the slopes where it can be implemented, if farmer resistance can be overcome.
• Including a 2 m wide vegetative barrier on the contour reduced SS and TP losses for all treatments by 9-97%. The beetle bank significantly reduced runoff, SS and TP losses only in year 1 (p<0.01), but was effective in both years 1 and 2 for the traditionally-ploughed soils, reducing losses by 32-97%, which suggests the mitigation effect may be higher than the 40% reduction in soil P loss reported in the DWPA manual. Costs are modest at £2-5 ha-1, although a maintenance cost of £21 ha-1 is also
applicable to the area of the barrier. In-field vegetative barriers on the contour may promote contour cultivation and may also have further biodiversity benefits. However, this treatment was unpopular with the farmer, and may be difficult to implement on complex slopes.
[image:2.595.31.566.537.688.2]• Treatment interactions occurred at some of the sites. Minimum tillage appears to reduce the effectiveness of contour cultivation under some conditions.
Table E1. Effectiveness of mitigation options trialled on different soil types for between one and three years, and estimated per-crop costs. Figures are calculated by comparing mean values for treatments and control treatments by year and by site, and represent the results for all treatment combinations.
Treatment
Impact on farm margin (£ ha-1)
No. of Site-years trialled
Mitigation effectiveness (Reduction in overwinter loss, with% relative change) Runoff (mm) SS (kg ha-1) TP (kg ha-1)
Sand Silt Clay Sand Silt Clay Sand Silt Clay Tramline
disruption1 - 2-5 5
3.5-11.0 5.3-75.4a
N/A 49-223 373-4780
a
N/A 0.19-2.14 0.72-2.89
a
N/A (69-88) (95-97) (75-96) (98-99) (72-95) (97-99) Crop
residues2 0 1
0.2-2.0
N/A N/A 9-200 N/A N/A 0.03-0.52 N/A N/A
(24-50) (40-43) (34-50) Minimum
tillage3 + 44-50 5
2.2-7.8
N/Ea 0.8-31.6
bc 107-841
N/Ea 54-1133
bcf 0.33-2.28
N/Ea 0.04-0.86 bcf
(66-81) (4-62) (94-98) (37-62) (92-97) (29-52)
Contour
cultivation4 0 2 N/A N/A
16.5-56.0d
N/A N/A 90-1223
d
N/A N/A 0.09-1.00
d
(64-76) (45-79) (48-79) Vegetative
barrier5 - 2-5 2 N/A N/A
11.9-17.6e
N/A N/A 41-228 N/A N/A 0.04-0.45
(45-91) 16-94 (9-97) N/A = Not applicable. N/E = not effective in this project. 1Trialled for 2 years on sandy and 3 years on silty soils. 2Trialled for 1 year on sandy
soils. 3Trialled for 1 year on sandy, 1 year on silty and three years on clay soils. 4Trialled for 2 years on clay soils. 5 Trialled for 2 years on clay
soils. aNot effective when trialled in year 3. bNot effective when trialled in year 1. cNot effective when trialled under contour cultivation in year 3. dNot effective when trialled under minimum tillage in year 3. eNot effective when trialled under minimum tillage in year 2. fNot effective for
3
List of Abbreviations
General:
DWPA = Diffuse water pollution from agriculture
C = Carbon
TC = Total carbon
TDC = Total dissolved carbon
P = Phosphorus
TP = Total phosphorus
TDP = Total dissolved phosphorus N = Nitrogen
TN = Total nitrogen
TDN = Total dissolved nitrogen
SS = Suspended sediment
ANOVA = Analysis of variance
p = Significance level
SEM = Standard error of the mean
Measurements:
m = metre
mm = millimetre (0.001 m)
µm = micrometre (0.000001 m)
ha = hectare (10000 m2)
l = litre
ml = millimetre (0.001 l)
µl = microlitre (0.000001 l)
g = gram
kg = kilogram (1000 g)
mg = milligram (0.001 g)
µg = microgram (0.000000 g)
yr = year
Field sites:
L = Loddington
OH = Old Hattons
RM = Rosemaund
Crops:
B = Winter barley
O = Winter oats
W = Winter wheat
Treatments:
B = Straw baled and removed
BB = Beetle bank
C = Contour cultivation
DTL = Disrupted tramline
MD = Mixed-direction cultivation
MT = Minimum tillage
OTL = Offset tramline
P = Plough
R = Straw residue incorporation
TL = Tramline
4
1. Introduction
1.1. Context
Diffuse pollution inputs from agriculture play a central role in influencing water quality and biodiversity. As a result, controlling the transfer of diffuse pollutants from land to water is a priority for catchment managers and stakeholders (Kronvang et al., 2005). The Water Framework Directive (WFD) places requirements on European governments to set water quality objectives for achieving good chemical and ecological status (European Commission, 2001, Moss et al., 2003). Corresponding objectives relating to the restoration of key species and habitats and targets for favourable conditions on conservation sites are outlined in legislation represented by the UK Biodiversity Action Plan and the UK Government’s Quality of Life indicators and the EU Habitats Directive.
Phosphorus (P) and Nitrogen (N) losses from agricultural soils are of particular concern, because of their role in limiting algal growth in surface waters. Of the two, P is currently of particular concern as the key limiting nutrient in rivers, lakes and reservoirs. The critical concentration of total P entering water bodies in relation to eutrophication is recognized by a range of organizations to be 0.1 mg l-1 (Withers
and Sharpley, 1995). Studies commissioned by the Environment Agency (2000a, 2000b) indicate that P concentrations need to be one order of magnitude lower in fresh waters to meet the biodiversity levels designated in the EU Water Framework Directive. Phosphorus has low solubility, and is strongly bound by the soil, being associated primarily with the finer soil fractions (Quinton et al., 2001, Sharpley, 1980). However, runoff preferentially transports the finer fractions of the soil (Quinton et al., 2001), and P can therefore be transferred from hillslopes to surface waters in particulate form in association with eroded sediments, where it may later be released and become available for plant uptake (McDowell et al., 2001a). Losses of P in dissolved form may also occur, and are of particular concern from grazed grasslands and from arable land after P additions in the form of fertilisers and manures (Sharpley et al., 2000). The typical loss of P to water from farming land in the UK is currently estimated at 1 kg ha-1 yr-1
(Defra, 2002, Heathwaite et al., 2005), but agricultural systems in most European countries are currently operating at an annual P surplus, which in the UK has been estimated to be around 16 kg P ha-1 yr-1
(Edwards and Withers, 1998, Withers and Jarvis, 1998). In total, agricultural activities are thought to be responsible for 30% of P inputs to surface waters (White and Hammond, 2006). In contrast to P, the transfer of N into surface waters occurs primarily in dissolved form, but N may also be transferred in particulate form in association with sediments and organic matter.
In addition to the on-site problems of soil erosion reducing available land area, sediment eroded from hillslopes is a pollutant in its own right. Increased fine sediment loadings are responsible for a range of off-site environmental problems, including channel bed siltation (Collins et al., 2005) and associated detrimental impacts on fish populations, macroinvertebrate biodiversity and macrophyte communities (e.g. Clarke and Wharton, 2001). Sediments are also associated with the transport of other nutrients, pesticides, pathogens and metals (Quinton and Catt, 2007, Quinton et al., 2001, Tyrrel and Quinton, 2003). Land in fallow and winter cereal crops is especially susceptible to soil erosion, where ground is bare or crop cover is low during the autumn and winter months (Chambers and Garwood, 2000), and a number of studies investigating the provenance of suspended sediment loads in UK catchments have reported the significance of cultivated fields as sediment sources (Chambers et al., 1992, Collins and Walling, 2004, Robinson and Naghizadeh, 1992).
1.2. Rationale
5
(Pierzynski et al., 2000). Tramlines are undrilled compacted tractor wheelings, typically spaced 18 m, 20 m or 24 m apart, which serve as bout markers for spraying operations, ensuring accurate positioning and application of fertilisers and pesticides and minimising crop damage. Tramlines are of particular interest in the transport of sediment and nutrients, as research in previous Defra-funded projects (NT1033 and PE0111), and other recent research at the same Herefordshire site (Deasy, 2007) has shown that they represent a significant surface loss pathway for runoff and diffuse pollution. Practical management options to reduce runoff and erosion from tramlines are limited: for example, they can be established late by deferring the autumn spray operation (with increased risks of pests and diseases); vegetation cover can be established by drilling tramlines (with similar risks); or the compaction in tramlines can be broken up (disrupted) using some type of narrow tine or tine/disc combination once following the autumn spray operation.
Vegetative barriers of different types have been used successfully worldwide to control soil erosion (e.g. Dabney et al., 1999), and there is potential for introducing these in-field along the contour to reduce slope length. A form of vegetative barriers (beetle banks) are already funded under Higher-Level Stewardship (HLS) although no guidance is provided concerning their potential effectiveness as mechanisms to trap sediment and P. Vegetative barriers and buffer-strips have frequently been used as edge-of-field mitigation options, but barriers can also be used as in-field mitigation options, where, if placed on the contour, they can act as barriers to surface runoff and retain sediment from up-slope, and reduce slope length. A positive relationship between slope length and surface runoff loss from hillslopes has been demonstrated in a previous Defra project (PE0111). In-field contour grass strips have received some research attention, and have been shown to reduce sediment losses on 5% and 10% slopes in the laboratory (Ligdi and Morgan, 1995). Introducing vegetative barriers along the contour would also promote cultivation on the contour, which is cited as a practice by which losses of runoff, sediment and associated nutrients from arable land can be controlled (Morgan, 2005), as tillage lines and tramlines run along the contour rather than up-and-down the slope, increasing runoff resistance. Contour cultivation has been successfully used to reduce soil erosion in trials at Woburn (Quinton and Catt, 2004). However, there is some farmer resistance to the idea of contour cultivation in the UK, partly due to the practical difficulties it introduces to field management. Although unsuitable for steep or complex slopes, contour cultivation represents a viable management option for shallow or moderate uniform slopes, but is not yet widely practiced.
Conservation tillage (also known as non-inversion or minimum tillage) reduces soil disturbance through non-inversion of the soil and a reduced number of tillage operations. Conservation tillage can reduce erosion risk by increasing aggregate stability, mean aggregate diameter and soil pore connectivity (Bradford and Huang, 1994), hence increasing infiltration, and reducing losses of sediment and sediment-bound pollutants (Quinton and Catt, 2004). This type of tillage is increasingly being adopted on soils across the UK in order to reduce farm costs. Unpublished data from the same authors shows that it can also be effective in controlling losses of total P. Another mitigation approach is to provide physical protection to the soil surface using residues from the previous crop to help maintain an open structure allowing water to infiltrate, reducing runoff and the mobilisation of sediment and P due to rainsplash and runoff. Crop residue management has been widely used in the United States as an erosion control methodology (Dickey et al., 1986). However, its effectiveness for reducing P loss is less well understood, as decomposing straw may have the potential to release soluble P over the longer term (Schreiber, 1999), while studies considering N and carbon dynamics in the UK in response to crop residue incorporation show mixed results (e.g. Silgram and Chambers, 2002).
6
sediment and associated nutrient losses from agriculture, there are still many knowledge gaps to fill before some mitigation treatments can be widely recommended. In particular, these knowledge gaps include the effect of treatments on particulate and diffuse nutrient losses, the effect of different site characteristics, such as soil type, and the effect of treatments when trialled at large unbounded hillslope scale, rather than the small bounded plot areas usually used in experimental work, which poorly represent management scales and have edge effect problems. There remains considerable scope for modifying existing mitigation practices and for improving subsidiary benefits associated with biodiversity gains, but the identification of appropriate mitigation strategies for diffuse pollution loss is dependent upon improved knowledge and understanding of the effects of various management methods in controlling pollution losses.
In England and Wales, incentive-based policy is being used to drive environmental management targeting diffuse water pollution from agriculture. Policy packages include the Entry-Level and Higher-Level agri-environment schemes (ELS and HLS). Recognizing and understanding how socio-economic factors influence the diffuse pollution management agenda is crucial, and hence the key to successful mitigation is to integrate process understanding and cost-benefit analyses of policy packages into integrated decision-making tools (McDowell et al., 2001b). The DWPA User Manual (Cuttle et al., 2007) draws together some of the information available on mitigation options, and provides an inventory of methods to control diffuse water pollution from agriculture. However, some of the estimates of effectiveness in the manual relating to P are based on expert judgement due to a lack of experimental data, while some other potential mitigation options are not included.
1.3. Objectives
The Mitigation Options for Phosphorus and Sediment (MOPS) project aimed to investigate the efficacy and cost-effectiveness of different in-field mitigation options which could be used to control diffuse pollution losses in surface runoff from arable fields. MOPS had four main objectives:
1. To review published literature on the effectiveness of different mitigation features for preventing the mobilisation and/or encouraging the trapping of sediment and phosphorus in problematic agricultural land forms.
2. To test the effectiveness and longevity of individual, and combinations of, control measures representing different levels of farmer intervention, in terms of mitigating sediment and P loss on three contrasting high risk sites.
3. To determine the cost-effectiveness of different approaches, and combinations of approaches, at hillslope scale to refine and update P cost curve assessments (PE0203). This will include both costs to Government (scheme grants) and farmers (profits foregone, cost of implementation and maintenance, scheme grants).
4. To provide advice to DEFRA on the potential for including the most effective P mitigation methods within existing or new agri-environment schemes (including Entry Level and Higher Tier options), and to develop mitigation practice standards for the most cost-effective methods for use by advisors and farmers.
Objective 4 has been addressed through meetings providing advice to farmers and Defra, and via correspondence with Defra and English Nature on revisions to the ELS and HLS agri-environment schemes. Effective knowledge transfer of practical recommendations to the farming community has been undertaken via farm open days and the farming press, in addition to publication of scientific results in peer reviewed journals (see Appendix 3).
2. Site descriptions
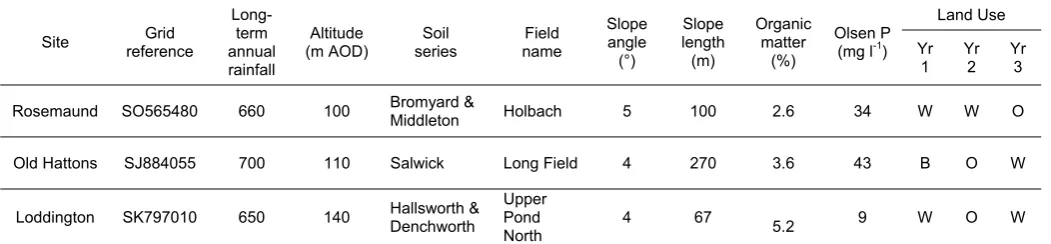
[image:7.595.236.400.214.426.2]Three field sites were selected within the east and west midlands of the UK which have broadly comparable slopes and annual rainfalls, but differing soil types. The characteristics of each site are summarised in Table 1.
Figure 1. Location of the three field sites. 1 = Rosemaund, 2 = Old Hattons, 3 = Loddington.
2.1. Rosemaund
Rosemaund farm in Herefordshire has been the focus of ADAS research projects for several decades. The soils are well-structured, silty-clay-loams which are prone to surface runoff and cracking and which are widely underdrained. The site has been used in previous Defra projects PE0111 and NT1025, and the characteristics of the farm and its fields have been well described in the literature (e.g. Chapman et al., 2005, Russell et al., 2001, Williams et al., 1996).
Table 1. Summary characteristics for three study sites.
Site reference Grid
Long-term annual rainfall
Altitude (m AOD)
Soil series
Field name
Slope angle (°)
Slope length (m)
Organic matter
(%)
Olsen P (mg l-1)
Land Use
Yr 1
Yr 2
Yr 3
Rosemaund SO565480 660 100 Bromyard & Middleton Holbach 5 100 2.6 34 W W O
Old Hattons SJ884055 700 110 Salwick Long Field 4 270 3.6 43 B O W
Loddington SK797010 650 140 Hallsworth & Denchworth Upper Pond
North 4 67 5.2 9 W O W
W = winter wheat, O = winter oats, B = winter barley, R = oilseed rape, BN = winter/spring beans *Rotations as follows. Rosemaund: W O W B R (5 yr), Old Hattons: W W/B R (3 yr), Loddington: W R W BN/O (4 yr). N.B. Because of the experimental treatment design these rotations were not necessarily followed in the experimental years.
2.2. Old Hattons
Old Hattons farm in Staffordshire is owned by Severn Trent Water. The farm has been used for research studies for more than a decade, including for research on the effects of long term additions of
[image:7.595.37.563.573.695.2]8
sewage sludge to land (e.g. Shepherd and Smith, 2002). As a result of the addition of sludges, fields at Old Hattons have a higher organic matter and soil P status than might otherwise be expected for loamy sand soils under continuous arable production. Soils are weakly structured, erodible, and prone to surface sealing due to the effect of raindrop impact on the soil.
2.3. Loddington
The Loddington site in Leicestershire is run by the Allerton Research and Educational Trust, which seeks to demonstrate means of farming profitably with minimum environmental impact. The site has heavy clay soils, and much of the land is cultivated under minimum tillage. The site is used for other research projects, including SOWAP, and the PARIS (PE0116) and Wetting up Farmland for Biodiversity (BD1323) projects, and contains a number of novel conservation features including small ponds and vegetative strips.
3. Methods
3.1.
Treatment experimental design [image:8.595.45.559.442.702.2]A broad range of practical mitigation options were explored. The mitigation treatments at each site were designed following completion of the literature review (Objective 1) and consultation with the farm managers at each site and with the project Steering Group. The treatments aimed to reduce sediment and P losses in one of three ways, either by reducing detachment of sediment and nutrients from the soil by splash erosion, by reducing the generation of surface runoff, or by reducing the volume, erosive energy and transport capacity of runoff within the hillslope. The treatments explored broadly covered tramline management, soil surface protection, slope length reduction, cultivation direction and cultivation type. The treatments used at each of the three sites over three years of monitoring are summarised in Table 2 and the experimental plans for each site and each year are shown in Appendix 1.
Table 2. Treatments and number of replicate hillslope lengths for the three study sites for each year of monitoring.
Treatment Description
Site & Year
Rosemaund Old Hattons Loddington 1 2 3 1 2 3 1 2 3
P Plough 81 4 32 4 3 3
P TL Plough; Tramlines 4 4 4 4 4 4
P DTL Plough; Disrupted tramlines 4 4 4 4 4
P OTL Plough; Offset tramlines 4 4
P B Plough; Straw baled and removed 4
P B TL Plough; Straw baled and removed; Tramlines 4
P R Plough; Residue incorporation 4
P R TL Plough; Residue incorporation; Tramlines 4
P C Plough; Contour 3 3
P C BB Plough; Contour ; Beetle bank 3
P MD Plough; Mixed-direction 22
P MD BB Plough; Mixed-direction; Beetle bank 3
MT Minimum tillage 4 3 3
MT TL Minimum tillage; Tramlines 4 4 4
MT DTL Minimum tillage; Disrupted tramlines 4 4
MT C Minimum tillage; Contour 3 3
MT C BB Minimum tillage; Contour; Beetle bank 3 MT MD Minimum tillage; Mixed-direction 22
MT MD BB Minimum tillage; Mixed-direction; Beetle bank 3
1Paired comparisons were originally planned for the tramline areas and areas without tramlines, the areas without tramlines and the disrupted
tramline areas, and the tramline areas and disrupted tramline areas, but bulking the areas without tramlines for statistical analysis provided a more robust characterisation of the site in the absence of tramlines while retaining the planned comparisons. 2Problems in the autumn resulted
in the loss of one of the experimental treatments.
[image:8.595.38.561.447.703.2]9
design because different treatments were trialled, two, three or four replicates were used. In total, 52 hillslope lengths were monitored for three years across three sites, giving a total of nine site-years for experimentation. Treatments were partially randomised, as at hillslope scale complete randomisation of the treatments and tillage operations was not always possible. This was considered acceptable as no statistically significant trends in soil chemical and physical status were identified across the slopes at any of the field sites.
3.1.1. Rosemaund
Treatments at Rosemaund focused on losses of sediment and P from tramlines, as evidence from PE0111 highlighted the importance of tramlines in influencing P losses at this site. In year 1, losses from tramlines were compared to losses from the vegetated areas between the tramlines, and to losses from disrupted tramlines. Disrupted tramlines were tramlines where the compacted surface was broken-up to 6 cm depth once after tramline establishment in the late autumn, using a cultivator fitted with a simple tine. In year 2, an offset tramline treatment was added, where losses were monitored from areas where the crop sprayer was driven over the emerging crop during the autumn, rather than driven over the unseeded tramline area. In year 3, the tramline and disrupted tramline treatments were combined with a cultivation treatment, where runoff, sediment and P losses were compared from both ploughed and minimum tillage areas.
3.1.2. Old Hattons
At Old Hattons, in year 1, a crop residue treatment was trialled. Post-harvest cereal straw residues were either chopped and incorporated using a Vaderstad Carrier (a combination cultivator with discs, tines and a crumbler roller), or were baled and removed. As there is no standard method for management of crop residues (some farmers incorporate and some bale, depending on the local market and value for baled straw, and the need for soil improvement by addition of organic matter), these methods were each compared as separate treatments. Losses from areas with and without tramlines were also monitored to determine the importance of tramlines on lighter soils. In years 2 and 3, the treatments implemented were the same as at Rosemaund.
In years 2 and 3 at Old Hattons, an additional field with a converging problematic hillslope form was monitored at its outlet into a small farm pond, in an attempt to assess whether implementing tramline disruption at a whole-field scale would reduce surface runoff and sediment and nutrient loads. However, problems with monitoring equipment meant that there are little data available for year 2. In year 3, late crop establishment due to the constraints imposed by farm operations meant that tramline disruption in the experimental field was undertaken later in the autumn, and this was followed by only two surface runoff events which were insufficient in magnitude to allow definitive conclusions to be drawn. Consequently these results are not reported with the other project results in Section 5.
3.1.3. Loddington
treatment further, a tramline treatment was established in order to determine whether tramline losses were important on all of the three soil types studied.
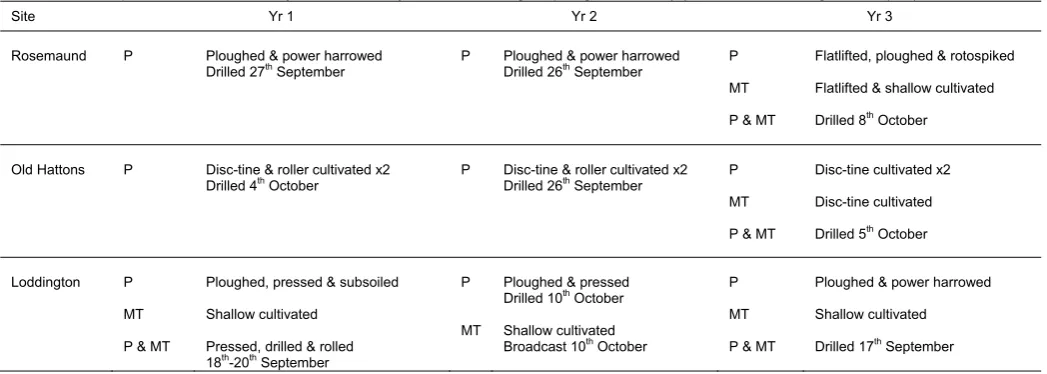
[image:10.595.37.561.162.349.2]The initial field operations undertaken at each site in each year are summarised in Table 3. Where the experimental area was divided into areas of traditional cultivation and minimum tillage, the operations are shown separately. After drilling, the entire experimental area at each site was treated in the same way for fertilizer and spraying operations.
Table 3. Field operations for three study sites for each year of monitoring for ploughed areas (P) and minimum tillage areas (MT).
Site Yr 1 Yr 2 Yr 3
Rosemaund P Ploughed & power harrowed
Drilled 27th September P Ploughed & power harrowed Drilled 26th September P
MT P & MT
Flatlifted, ploughed & rotospiked Flatlifted & shallow cultivated Drilled 8th October
Old Hattons P Disc-tine & roller cultivated x2
Drilled 4th October P Disc-tine & roller cultivated x2 Drilled 26th September P
MT P & MT
Disc-tine cultivated x2 Disc-tine cultivated Drilled 5th October
Loddington P MT P & MT
Ploughed, pressed & subsoiled Shallow cultivated
Pressed, drilled & rolled 18th-20th September
P MT
Ploughed & pressed Drilled 10th October
Shallow cultivated Broadcast 10th October
P MT P & MT
Ploughed & power harrowed Shallow cultivated Drilled 17th September 3.2. Hillslope scale experimentation
Monitoring was undertaken at the hillslope scale, using hillslope lengths. Extending the study scale from the traditionally-studied plot scale up to hillslope lengths was a key feature of this research project and means that the results are more representative of the net effect of processes to edge-of-field and of management scales. Because of the dimensions of the experimental hillslope lengths, which were 67-270 m (Table 1), hillslope lengths were unbounded except for 3 m runoff collection gutters at the base of the hillslope length (Plate 1a).
Plate 1a. Layout of hillslope monitoring equipment. Runoff from the upslope monitoring area was collected by plastic or metal gutters which channelled runoff into the piping.
Plate 1b. Piping diverted runoff downslope into the tipping- bucket sample splitters, which directed a representative subsample of runoff into covered storage tanks. The remaining runoff was directed to waste.
3.3. Sample collection
Surface runoff resulting from major rainfall events during the winter monitoring period (October-March) was collected from each hillslope segment. Runoff was channelled from metal or plastic collection gutters at the base of the hillslopes via plastic pipes into novel tipping-bucket sample splitters (Plate 1b). The splitters directed a user-defined proportion of the total event runoff into 400 l collection tanks, with
11
the remainder diverted to waste. Depending on how they are configured, these devices are capable of producing representative flow-proportional samples of between one-half and one-eighth of event runoff. Each splitter was calibrated to verify that it functioned across a wide range of flow rates, and care was taken to ensure that the splitters were horizontal when installed in the field. The use of flow splitters was essential to prevent the tanks overtopping, as the total runoff volumes from the hillslope lengths could be very large. The flow splitters also allowed monitoring of runoff dynamics during individual events, as the number of tips per unit time could be logged. The bespoke design for the sample splitters was developed, and the prototypes were tested and the final products calibrated during the course of the first year of the project. The design criteria used in the development of the sample splitters ensured that they proved to be robust, suitable for unsupervised outdoor use, and resistant to blockage from stones, surface trash, and sediment.
3.4. Data analysis
Rain gauges were used on-site to characterise the intensity and duration of rainfall events. Event runoff was monitored using the measured runoff volumes in the tanks, and the logged flow-splitter data, and runoff was sampled from the collection tanks after each event. One sample was collected for each treatment replicate, and used for analysis. Samples were analysed at Lancaster University for suspended sediment (SS), Total P (TP) and Total dissolved P (TDP), and also for Total N (TN) and Total dissolved N (TDN) for each event. In year 3, samples were also analysed for Total Carbon (TC) for three events at Old Hattons and Loddington, and for two events at Rosemaund.
Upon receipt of runoff samples by the laboratory, an aliquot of sample was filtered through a pre-washed 0.45 μm Whatman GD/X syringe filter (Fisher Scientific, Loughborough, UK) incorporating a cellulose acetate membrane with a glass microfibre pre-filter. A 200 ml aliquot of unfiltered sample was reserved for the measurement of SS by evaporation at 105oC (Bartram and Balance, 1996). Total P
analysis was based on USEPA method 365.1 (O’Dell, 1993), which utilises classical colorimetric chemistry (Murphy and Riley, 1962) and was deemed to be the most suitable method for the sample type and analytical instrument (AQ2+ Discrete Analyser, Seal Analytical, West Sussex, UK). Total N and TC measurements were carried out by catalytic thermal oxidation using a Thermalox analyser (Analytical Sciences Ltd., Cambridge, UK). A number of soil samples were also analysed for TP, TN and TC. The TP method involved a modified Kjeldahl digest (Rowland and Grimshaw, 1985), followed by semi-automated colorimetric determination based on classical techniques (Murphy and Riley, 1962, O’Dell, 1993). Total C and TN elemental analysis by combustion was carried out using a Vario EL analyser (Elementar Analysensysteme, Hanau, Germany). A selection of samples were also used for particle size analysis, which was undertaken on a MasterSizer 2000 (Malvern Instruments Ltd., Malvern UK) after organics removal using concentrated hydrogen peroxide and dispersion with sodium hexametaphosphate.
Runoff (l) and concentration data (mg l-1) were used to calculate event loads (kg), and these were
combined with the area of each hillslope segment (ha) to calculate event yields for each treatment replicate (kg ha-1). Data presented have been summed for all events in each year to give total overwinter
12
treatment, using General Linear Model analysis in SPSS (v.14, SPSS Inc. 1989-2005). Two-factor ANOVA allowed the effects of the primary (cultivation) and secondary (direction, barrier, tramline) treatments to be distinguished. Further analysis of all treatments using single-factor ANOVA allowed significance levels to be calculated for differences between combinations of treatments.
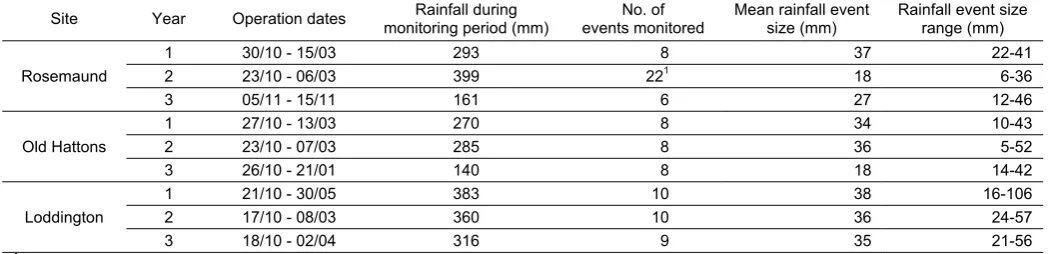
[image:12.595.36.562.195.322.2]A minimum of six events were monitored at each site in each winter (Table 4). The percentage of rainfall lost as surface runoff (runoff coefficient) was also calculated for each treatment for each site over each of the three years of the project (Appendix 2), in order to assist with the generalisation of treatment effects across sites and years.
Table 4. Winter rainfall and the characteristics of events monitored by site and by year.
Site Year Operation dates monitoring period (mm) Rainfall during events monitored No. of Mean rainfall event size (mm) Rainfall event size range (mm)
Rosemaund
1 30/10 - 15/03 293 8 37 22-41
2 23/10 - 06/03 399 221 18 6-36
3 05/11 - 15/11 161 6 27 12-46
Old Hattons
1 27/10 - 13/03 270 8 34 10-43
2 23/10 - 07/03 285 8 36 5-52
3 26/10 - 21/01 140 8 18 14-42
Loddington
1 21/10 - 30/05 383 10 38 16-106
2 17/10 - 08/03 360 10 36 24-57
3 18/10 - 02/04 316 9 35 21-56
1The large number of events sampled in 2006-2007 reflects both the higher rainfall for this site, and the rainfall pattern which generated a large
number of smaller runoff events, compared to the other two years.
4. Impacts of in-field management on surface runoff, sediment transport, and associated transport of phosphorus
Detailed results of all treatments applied at the three field sites over three years are shown in Appendix 2.
4.1. Effect of tramlines
In this project, losses of sediment and diffuse pollutants down tramlines were quantified at three sites in an attempt to assess the importance of this pathway over a variety of soil types and under a range of soil conditions. These losses were monitored at Rosemaund and Old Hattons in years 1 and 2 and at Loddington in year 3 (Figure 2).
At both Rosemaund and Old Hattons, there was a clear and consistent effect (p<0.01) of the presence of tramlines in losses of surface runoff at both sites in years 1 and 2, with 0.1-1.0% of rainfall lost as runoff in areas without tramlines compared to 2.2-15.8% of rainfall lost as runoff in areas where tramlines were present. The greater runoff coefficients in tramline areas accounted for significant increases in over-winter sediment losses (p<0.01). Mean losses of SS in surface runoff from tramlines were 379 kg ha-1 in year 1 and 4820 kg ha-1 in year 2 at Rosemaund, and 399 kg ha-1 in year 1 and 296 kg ha-1 in year 2 at Old Hattons, compared to losses from areas without tramlines of only 3-30 kg SS ha-1
at these two sites in the first two winters of monitoring. The difference in losses of SS from tramline areas compared to areas without tramlines was much greater than the difference in losses for runoff (Table 5). Losses of TP from tramlines were also significantly greater than from areas without tramlines (p<0.01). Overwinter losses of TP from tramline areas were 0.74-2.93 kg ha-1 compared to only 0.01-0.10 kg ha-1 from areas without tramlines at the two sites in the first two winters (Figure 2), and the
increase in losses for tramline areas compared to areas without tramlines was similar to the increase in losses for SS (Table 5). Concentrations of TP in runoff were also greater in runoff from tramlines than from areas without tramlines for both sites in both years (p<0.05), ranging between 3.8 mg l-1 and 18.1 mg l-1 for tramline areas and 0.7 mg l-1 and 15.8 mg l-1 for areas without tramlines.
(a) 0.01 0.74 0.06 1.52 0.03 1.00 0.0 0.5 1.0 1.5 2.0
P P TL
O ver w int er T P Lo ss (k g h a -1) Treatment Year 1 RM OH B OH R (b) 0.01 2.93 0.10 0.82 0.0 1.0 2.0 3.0 4.0
P P TL
O verw int er T P Lo ss (k g ha -1) Treatment Year 2 RM OH (c) 0.11 0.25 0.07 0.38 0.0 0.2 0.4 0.6 0.8
P P TL MT MT TL
[image:13.595.150.427.56.467.2]O ve rw int er T P Lo ss (k g h a -1) Treatment Year 3 L
Figure 2. Overwinter TP losses from areas with tramlines (TL) compared to losses from areas without tramlines for (a) year 1 at Rosemaund (RM) and Old Hattons (OH) for areas where straw was baled and removed (B) and areas where residues were incorporated (R), (b) year 2 at Old Hattons and Rosemaund, and (c) year 3 at Loddington (L) for ploughed areas (P) and minimum tillage areas (MT). Values shown are overwinter means for replicates of each treatment, error bars are SEMs for replicates of treatments. See Table 2 for treatment definitions.
At Loddington in year 3, tramlines also had a significant effect on runoff (p<0.01). Mean overwinter runoff under both traditional plough cultivation and minimum tillage from tramline areas was 43.5 mm compared to 15.1 mm from areas without tramlines. As for the other two sites, the increased runoff from tramline areas compared to areas without tramlines was also associated with a corresponding increase in SS and P yields (p<0.01), although the increase in losses was smaller than for the other two sites (Table 5). Losses of TP from tramline areas were 0.25 kg ha-1 for ploughed areas
and 0.38 kg ha-1 for minimum tillage areas compared to 0.11 kg ha-1 and 0.07 kg ha-1 for areas without
tramlines. However, there was no significant difference in SS or TP concentrations from tramline areas compared to areas without tramlines.
14
Table 5. Absolute change in overwinter loss, with multiplication factor in parentheses, for effect of tramlines on overwinter losses by year and by site. Figures are calculated by comparing mean values for treatments by year and by site. Absolute change in overwinter loss = Treatment 2-Treatment 1. Factor increase in overwinter loss = 2-Treatment 2/2-Treatment 1. P = Plough, MT = Minimum tillage, TL = Tramline, B = Straw baled and removed, R = Residue incorporation. *p<0.05. **p<0.01.
Absolute change in overwinter loss
(with multiplication factor) Treatment 1 Treatment 2
Rosemaund Old Hattons Loddington
Yr 1 Yr 2 Yr 1 Yr 2 Yr 3
Runoff (mm)
P R P R TL 6.2** (x32)
P B P B TL 8.0** (x21)
P P TL 5.3** (x19) 76.1** (x39) 12.8** (x5) 23.8 (x2)
MT MT TL 32.9** (x5)
SS (kg ha-1)
P R P R TL 287** (x25)
P B P B TL 478** (x24)
P P TL 376** (x126) 4799** (x230) 266** (x10) 161 (x2)
MT MT TL 275** (x6)
TP (kg ha-1)
P R P R TL 0.97** (x33)
P B P B TL 1.46** (x25)
P P TL 0.73** (x 74) 2.92** (x 293) 0.72** (x8) 0.14 (x2)
MT MT TL 0.31** (x 5)
4.2. Tramline disruption
In year 1 losses from disrupted tramlines were compared to losses from areas with conventional tramlines at Rosemaund. Tramline disruption proved to be very effective, with results demonstrating that simple disruption of compacted tramlines could significantly (p<0.01) reduce runoff, and losses of SS and TP (Figure 3a) to levels similar to those measured in areas without tramlines (see Figure 2).
In year 2, the tramline disruption treatment was extended to Old Hattons, to investigate whether the method was also effective on lighter soils (Figure 3b). Overwinter runoff was 78.1 mm and 16.0 mm from tramline areas at Rosemaund and Old Hattons respectively, compared to 2.0 and 3.2 mm from areas without tramlines. However, disrupting the tramlines reduced runoff from tramline areas to 2.7 mm and 5.0 mm, reductions in losses of 97% and 69%. Similar reductions were also measured in losses of SS and TP (Table 6). In terms of sediment loss, the disruption of tramlines proved to be most effective at the Rosemaund site, where SS losses were 4820 kg ha-1 from tramline areas, but losses were
reduced to 40 kg ha-1 after disruption, which was close to the ‘background’ levels measured from areas
without tramlines (21 kg ha-1). There were no consistent reductions in losses of runoff, sediment and TP
from the offset tramline treatment at Rosemaund, where losses were greater from the offset tramline areas than from the conventional tramline areas, or at Old Hattons.
Results from year 3, where tramline disruption was applied in combination with both minimum tillage and plough treatments, differed for the two sites. Results from the Old Hattons site continued to demonstrate the significant effect (p<0.01) of tramline disruption in reducing overwinter losses of runoff, sediment and TP (Figure 3c). Tramline disruption reduced mean sediment losses for both the minimum tillage and plough treatments from 472 kg ha-1 to 56 kg ha-1, while mean TP losses were reduced from
1.34 kg ha-1 to only 0.11 kg ha-1. Results from Rosemaund in year 3 showed significant (p<0.05)
increases in runoff from disrupted tramlines, and in overwinter sediment and P losses, compared to losses from conventional tramlines. However, this effect should be considered in relation to the low runoff coefficients (<3.4%) and sediment losses (<105 kg ha-1) measured for all treatments at this site in
year 3.
(a) 0.74 0.02 0.00 0.25 0.50 0.75 1.00
P TL P DTL
O ve rw int er T P L o ss (k g ha -1) Treatment Year 1 RM (b) 2.93 0.04 0.82 0.23 0.0 1.0 2.0 3.0 4.0
P TL P DTL
O verw int er T P Lo ss (kg h a -1) Treatment Year 2 RM OH (c) 0.01 0.03 2.48 0.34 0.0 1.0 2.0 3.0 4.0
P TL P DTL
[image:15.595.148.435.56.498.2]O verw int er T P Lo ss (kg h a -1) Treatment Year 3 RM OH
Figure 3. Effect of tramline disruption (DTL) on overwinter TP losses, compared to overwinter losses for ploughed areas (P) with tramlines (TL) for (a) year 1 at Rosemaund (RM), (b) year 2 at Rosemaund and Old Hattons (OH), and (c) year 3 at Rosemaund and Old Hattons. Values shown are overwinter means for replicates of each treatment, error bars are SEMs for replicates of treatments.
Table 6. Absolute change in overwinter loss, with % relative change in parentheses, for tramline disruption treatment by year and by site. Figures are calculated by comparing mean values for treatments by year and by site. Absolute change in overwinter loss = Treatment 2-Treatment 1. Relative change in overwinter loss = (2-Treatment 2-2-Treatment 1)/2-Treatment1*100. P = Plough, MT = Minimum tillage, TL = Tramline, DTL = Disrupted tramline. *p<0.05. **p<0.01.
Absolute change in overwinter loss (with % relative
change)
Treatment 1 Treatment 2
Rosemaund Old Hattons
Yr 1 Yr 2 Yr 3 Yr 2 Yr 3
Runoff (mm) P TL P DTL -5.3** -(95) -75.4** -(97) 0.5 (42) -11.0** -(69) -9.1** -(77)
MT TL MT DTL 3.4** (243) -3.5** -(88)
SS (kg ha-1) P TL P DTL -373** -(98) -4780** -(99) 16 (267) -223** -(75) -783** -(88)
MT TL MT DTL 94** (855) -49 -(96)
TP (kg ha-1) P TL P DTL -0.72** -(97) -2.89** -(99) 0.02 (200) -0.59** -(72) -2.14** -(86)
MT TL MT DTL 0.10** (500) -0.19 -(95)
4.3. Crop residues
Losses of runoff, SS and TP were considerably reduced at Old Hattons in year 1, both within tramline areas and in areas without tramlines, by chopping and incorporating residues, rather than by baling and removing straw. Shallow incorporation of chopped straw reduced SS losses to 12 kg ha-1 from
21 kg ha-1 for straw removal on the areas without tramlines, and to 299 kg ha-1 from 499 kg ha-1 for straw
[image:15.595.37.556.583.687.2]16
ions in losses were also found for TP (Figure 4). However, none of these differences were significant.
removal on the areas with tramlines, representing reductions in losses of 43 and 40% respectively (Table 7). Similar reduct
0.06 0.03 1.52 1.00 0.0 0.5 1.0 1.5 2.0 B R O ver w int er T P L o ss (k g h a -1) Treatment
Old Hattons Year 1 P
[image:16.595.167.428.117.253.2]P TL
Figure 4. Effect of crop residue treatments on overwinter TP losses for year 1 at Old Hattons (OH), showing treatments where straw was baled and removed (B) and where residues were incorporated (R), for ploughed areas (P) with and without tramlines (TL). Values shown are
ent1*100. P = Plough, MT = Minimum = Tramline, R = Re led and re .05. **p<0.01.
Absolu ss
% relative change) Treatment 1 Treatment 2
Old Hattons overwinter means for replicates of each treatment, error bars are SEMs for replicates of treatments.
Table 7. Absolute change in overwinter loss, with % relative change in parentheses, for residue treatments for Old Hattons in year 1. Figures are calculated by comparing mean values for treatments by year and by site. Absolute change in overwinter loss = Treatment 2-Treatment 1. Relative change in overwinter loss = (Treatment 2-Treatment 1)/Treatm tillage, TL
sidue incorporation, B = Straw ba te change in overwinter lo
moved. *p<0
(with Yr 1
Runoff (mm) P B P R -0.2 -(50)
P B TL P R TL -2.0 -(24)
SS (kg ha-1) P B P R -9 -(43)
P B TL P R TL -200* -(40)
P B P R -0.03 -(50)
TP (kg ha-1)
P B TL P R TL -0.52 -(34)
4.4. Minimum tillage
Losses of runoff, sediment and P were monitored under minimum tillage in comparison to losses under traditionally-ploughed areas at all three sites, at Loddington in years 1, 2 and 3, and at Rosemaund and Old Hattons in year 3. At Loddington in year 1, losses of runoff were significantly greater (p<0.05) from areas under minimum tillage than from traditionally-ploughed areas. For areas under standard up-and-down slope cultivation, runoff was 5.1 mm for minimum tillage compared to 2.4 mm for ploughed areas. Corresponding increases in TP yields were also found to be significant (p<0.05) under minimum tillage. In year 2, the reverse was observed, and losses were lower from the minimum tillage areas than for the ploughed areas, under both contour and standard up-and-down slope cultivation in year 2, and this was also the
0.05 mg l-1) were also measured in the
reas under minimum tillage compared to the ploughed areas.
case under standard up-and-down slope cultivation in year 3 (Figure 5).
Overwinter runoff was 55.7 mm in year 2 and 8.3 mm in year 3 for minimum tillage, compared to 87.3 and 21.9 mm for ploughed areas under standard up-and-down slope cultivation (p<0.05). Sediment and TP losses from these areas under minimum tillage were significantly (p<0.01) lower in year 2 than from the ploughed areas (Figure 5a). However, in year 3, runoff, SS and TP losses increased from the areas under minimum tillage which were cultivated on the contour (Table 8), and SS and TP losses also increased from the areas under minimum tillage which had tramlines. Overall minimum tillage significantly (p<0.05) increased losses in this year compared to traditional plough cultivation, but for standard up-and-down slope cultivation, minimum tillage decreased runoff and losses of SS and TP by 34-62% (Table 8). In year 3, as in year 1, significant (p<0.05) increases in concentrations of TP (0.83 mg l-1 compared to 0.73 mg l-1) and TDP (0.22 mg l-1 compared to
[image:16.595.36.560.345.435.2](a) 0.02 0.07 1.66 0.80 0.11 0.07 0.0 1.0 2.0 3.0 P MT O ver w int er T P Lo ss (k g h a -1) Treatment
Loddington All Years Year 1
Year 2 Year 3 (b) 0.01 0.02 2.48 0.20 0.25 0.38 0.0 1.0 2.0 3.0
P TL MT TL
O ver w int er T P Lo ss (k g h a -1) Treatment
All Sites Year 3
[image:17.595.186.435.61.318.2]RM OH L
Figure 5. Effect of plough (P) and minimum tillage (MT) cultivation treatments on overwinter TP losses for (a) year 1, year 2 and year 3 at Loddington, and (b) year 3 at Rosemaund (RM), Old Hattons (OH) and Loddington (L) for areas containing tramlines (TL). Values shown are overwinter means for replicates of each treatment, error bars are SEMs for replicates of treatments.
At Old Hattons in year 3, minimum tillage significantly (p<0.01) reduced losses of runoff, SS and P from tramlines, by 66-98% (Table 8). Losses of TP from minimum tillage areas with tramlines were 0.20 kg ha-1 compared to 2.48 kg ha-1 from ploughed areas with tramlines (Figure 5b). At Rosemaund in
year 3, minimum tillage produced results similar to those at Loddington in year 1, with overwinter runoff, sediment, and P losses significantly (p<0.05) increased under minimum tillage compared to traditionally-ploughed areas. Mean sediment losses were 14 kg ha-1 across all ploughed treatments compared to
58 kg ha-1 across minimum tillage treatments. At Rosemaund this effect may be due to low rainfall
(161 mm in the overwinter monitoring period) and low runoff generation (runoff coefficients 0.9-3.4%), as noted in Section 4.2.
Table 8. Absolute change in overwinter loss, with % relative change in parentheses, for minimum tillage treatment by year and by site. Figures are calculated by comparing mean values for treatments by year and by site. Absolute change in overwinter loss = Treatment 2-Treatment 1. Relative change in overwinter loss = (Treatment 2-Treatment 1)/Treatment1*100. P = Plough, MT = Minimum tillage, TL = Tramline, DTL = Disrupted tramline, MD = Mixed-direction, C = Contour, BB = Beetle bank. . *p<0.05. **p<0.01.
Absolute change in overwinter loss
(with% relative change) Treatment 1 Treatment 2
Rosemaund Old Hattons Loddington
Yr 3 Yr 3 Yr 1 Yr 2 Yr 3
Runoff (mm)
P MT 2.6 (109) -31.6* -(36) -13.6 -(62)
P MD MT MD -0.8 -(4)
P MD BB MT MD BB 4.9 (297)
P C MT C -16.5** -(53) 43.2** (806)
P TL MT TL 0.2 (17) -7.8** -(66) -4.5 -(10)
P DTL MT DTL 3.7** (182) -2.2** -(81)
SS (kg ha-1)
P MT 17 (205) -1133* -(62) -54* -(47)
P MD MT MD 109 (247)
P MD BB MT MD BB 27** (944)
P C MT C -229** -(37) 291** (1205)
P TL MT TL 5 (83) -847** -(94) 61 (22)
P DTL MT DTL 83** (377) -107 -(98)
TP (kg ha-1)
P MT 0.05* (211) -0.86* -(52) -0.04 -(34)
P MD MT MD -0.14 -(29)
P MD BB MT MD BB 0.07** (566)
P C MT C -0.25** -(37) 0.32* (1389)
P TL MT TL 0.01 (100) -2.28** -(92) 0.12 (50) P DTL MT DTL 0.09** (300) -0.33* -(97)
[image:17.595.28.572.533.774.2]4.5. Cultivation direction
In year 1, losses of runoff, sediment and P from the mixed-direction tillage treatment were significantly higher (p<0.01) than from standard up-and-down slope cultivation. This treatment was not continued in the following years. Cultivation on the contour was trialled at Loddington in years 2 and 3 (Figure 6). In year 2, losses of runoff, sediment, and TP significantly (p<0.01) decreased under contour cultivation compared to standard up-and-down slope cultivation (Figure 6a). Mean TP losses for contour cultivation treatments for both minimum tillage and ploughed areas were 0.54 kg ha-1 compared to 1.23 kg ha-1 from
up-and-down slope cultivation. In year 3, the contour cultivation treatment decreased losses of runoff, sediment and P for soils in traditionally-ploughed areas, but increased losses from areas under minimum tillage, compared to standard up-and-down slope cultivation (Figure 6b). Because of the interaction of the minimum tillage and contour cultivation treatments, contour cultivation in year 2 did not significantly reduce losses overall compared to standard up-and-down slope cultivation. Over all site-years, where contour cultivation reduced losses of runoff, SS and TP, losses were reduced by 45-79% (Table 9).
(a)
1.66 0.66 0.80 0.41 0.0 0.5 1.0 1.5 2.0 UD C O ver wi nt er T P Lo ss (k g h a -1) Treatment
Loddington Year 2
P MT (b) 0.11 0.02 0.07 0.34 0.0 0.1 0.2 0.3 0.4 UD C O verw int er T P Lo ss (kg h a -1) Treatment
Loddington Year 3
P MT
[image:18.595.150.430.273.565.2]Figure 6. Effect of contour cultivation (C) on overwinter TP losses, compared to overwinter losses from up-and-down slope (UD) cultivated areas for Loddington, for ploughed areas (P) and minimum tillage area (MT) (a) year 2 and (b) year 3. Values shown are overwinter means for replicates of each treatment, error bars are SEMs for replicates of treatments.
Table 9. Absolute change in overwinter loss, with % relative change in parentheses, for contour treatment for Loddington by year. Figures are calculated by comparing mean values for treatments by year and by site. Absolute change in overwinter loss = Treatment 2-Treatment 1. Relative change in overwinter loss = (Treatment 2-Treatment 1)/Treatment1*100. P = Plough, MT = Minimum tillage, C = Contour. *p<0.05.
**p<0.01.
Absolute change in overwinter loss
(with% relative change) Treatment 1 Treatment 2
Loddington
Yr 2 Yr 3
Runoff (mm) P P C -56.0** -(64) -16.5** -(76)
MT MT C -40.9 -(73) 40.2** (483)
SS (kg ha-1) P P C -1223** -(67) -90** -(79)
MT MT C -319 -(45) 255** (424)
TP (kg ha-1) P P C -1.00** -(60) -0.09** -(79)
MT MT C -0.39 -(48) 0.27** (382)
[image:18.595.36.557.652.745.2]4.6. Vegetative barriers
Losses from hillslope lengths containing the beetle bank, which were also cultivated on the contour, were monitored in years 1 and 2 (Figure 7). In year 1, the beetle bank significantly (p<0.01) reduced losses of runoff, SS and TP from areas under traditional plough cultivation and minimum tillage by 64-97% (Table 10). In year 1, SS losses were on average 16 kg ha-1 from beetle bank areas compared to 99 kg ha-1
from areas without the beetle bank. Mean TP losses were 0.40 kg ha-1 from contour cultivated areas without the beetle bank, compared to 0.05 kg ha-1 from areas containing the beetle bank.
(a) 0.47 0.01 0.33 0.09 0.0 0.3 0.6 0.9
No BB BB
O verw in te r T P L o ss (k g h a -1) Treatment
Loddington Year 1
P MT (b) 0.66 0.45 0.41 0.38 0.0 0.4 0.8 1.2
No BB BB
O ver w int er T P Lo ss (k g h a -1) Treatment
Loddington Year 2
[image:19.595.150.424.173.449.2]P MT
Figure 7. Effect of vegetative barriers (BB) on overwinter TP losses, compared to overwinter losses from contour cultivated areas without beetle banks, for ploughed areas (P) and minimum tillage areas (MT) at Loddington in (a) year 1 and (b) year 2. Values shown are overwinter means for replicates of each treatment, error bars are SEMs for replicates of treatments.
In year 2, the beetle bank reduced losses of runoff, SS and TP for areas under traditional plough cultivation by 32-45%, but for areas under minimum tillage, the beetle bank only decreased losses of SS and TP (by 9-16%). Overall, the beetle bank significantly reduced runoff, SS and TP losses only in year 1 (p<0.01), but was effective in both year 1 and year 2 for the traditionally-ploughed soils.
Table 10. Absolute change in overwinter loss, with % relative change in parentheses, for vegetative barrier treatment at Loddington by year. Figures are calculated by comparing mean values for treatments by year and by site. Absolute change in overwinter loss = Treatment 2-Treatment 1. Relative change in overwinter loss = (2-Treatment 2-2-Treatment 1)/2-Treatment1*100. P = Plough, MT = Minimum tillage, MD = Mixed-direction, C = Contour, BB = Beetle bank. . *p<0.05. **p<0.01.
Absolute change in overwinter loss (with% relative
change)
Treatment 1 Treatment 2
Loddington
Yr 1 Yr 2
Runoff (mm)
P MD P MD BB -17.6** -(91)
MT MD MT MD BB -11.9 -(64)
P C P C BB -14.0 -(45)
MT C MT C BB 8.6 (58)
SS (kg ha-1)
P MD P MD BB -41** -(94)
MT MD MT MD BB -124 -(81)
P C P C BB -228 -(37)
MT C MT C BB -63 -(16)
TP (kg ha-1)
P MD P MD BB -0.45** -(97)
MT MD MT MD BB -0.24 -(74)
P C P C BB -0.21 -(32)
MT C MT C BB -0.04 -(9)
[image:19.595.39.558.607.785.2]20
5. Impacts of in-field management on the transport of N and C in surface runoff
The effect of each of the treatments trialled in year 3 on total N (TN) losses was also assessed for each treatment for each event (see Appendix 2). At Rosemaund, N losses were principally particulate in year 1 and year 2 (73-91% and 46-75%), but dissolved N losses were more important in year 3 (PN losses only averaged 32-46%) when erosion rates were lowest. At Old Hattons, TN losses were principally particulate in all three years (90-93%, 82-92%, 41-92%). At Loddington, TN losses were principally particulate in year 2 (PN was 55-70% TN), but dissolved N losses were more important in year 1 (PN was 26-35% TN) and year 3 (PN was 26-44% TN). Despite the variability in the composition of N between sites and years, TN losses responded to the different treatments in a similar way to SS and TP.
The effects of the different treatments on total carbon (TC) losses were assessed for up to three events in year 3 for each site (Appendix 2.5). At both Rosemaund and Loddington, TC was principally transported in dissolved form, with the percentage of TC as TDC ranging between 56-81% for Rosemaund, and 58-99% for Loddington, for all samples. On the lighter soils at Old Hattons, the proportion of TC transported in dissolved and particulate form varied between events and between treatments (TC as TDC range: 8-81%). At Rosemaund, runoff from disrupted tramline areas consistently had significantly (p<0.05) greater mean TC and TDC losses compared to runoff from conventional tramline areas. There was an indication that losses of TC and TDC may be higher under minimum tillage compared to losses from ploughed areas, but this pattern was not consistent over the two events, and the cultivation effect was not significant in both events. At Old Hattons in year 3, tramline disruption significantly (p<0.05) reduced losses of TC and TDC in each event. There was also consistently less TC and TDC in runoff from areas under minimum tillage compared to ploughed areas in all three events, and this difference was significant for TC (p<0.01) in each event. However, at Loddington, there was no consistent effect of cultivation type (plough vs. minimum tillage) on TC or TDC losses over the three events. Losses of TC and TDC were lower from the contour treatments than from up-and-down slope cultivations for traditionally-ploughed areas, but this contour effect was not observed in the areas under minimum tillage. In each event, TC and TDC losses were higher from areas containing tramlines, but the tramline effect was not significant in all three events.
6. Use of sediment tracers to understand hillslope sediment transfer
In years 2 and 3, two tracing experiments were undertaken at Loddington, involving the application of rare earth element oxide powders to the soil surface, to determine the extent to which mitigation features act as sinks (or potential sources) for sediment and P. The results of the tracing experiment undertaken in year 2 showed that sediments are transported into tramlines from as far as 4 m each side, and that sediments can be transported at least 14 m down tramlines over the course of several events. The results of this research are published in Stevens and Quinton (2008), which is appended to this report (Appendix 5). The tracing experiment undertaken in year 3 extended this research to determine whether tramline areas and different areas of the hillslope contribute different amounts of sediment to the total eroded load, and whether the erosion rates and areas differ between treatments, through applying different tracers to different areas of the hillslope. The final samples for this part of the rare earth work were collected in April, and the results will be reported in forthcoming publications in academic journals.
7. Particle size characteristics of eroded sediment
appears to be variation between treatments, although the patterns are not consistent. Further analysis may involve comparison of these data with soil particle size data, and calculation of enrichment ratios for the different soil types and treatments using event SS and P concentrations.
A limited number of samples have also been analysed to provide information on within-event dynamics. The results indicate that coarsening of sediment transported in runoff occurs through time, with the finest particles transported at the beginning of an event. This has implications for the transport of P and N lost in association with fine sediment, and data from within-event runoff samples also show that P and SS concentrations and loads are highest at the beginning of an event. This work provides insights into the processes controlling hillslope sediment and P transfer, and is being undertaken in association with a current NERC project (NE/E005357/1) through Lancaster, Loughborough and Cornell Universities and the USDA (see http://multisem.lboro.ac.uk/index.html).
0% 20% 40% 60% 80% 100%
P TL P DTL MT TL MT DTL
Rosemaund
0% 20% 40% 60% 80% 100%
P TL P DTL MT TL MT DTL
Old Hattons
0% 20% 40% 60% 80% 100%
MT MT TL MT C P C P TL P
[image:21.595.63.522.229.335.2]Loddington Sand Silt Clay
Figure 8. Results of particle size analysis undertaken on sediment collected from each treatment in events in January 2008. Data are the mean of two samples for each treatment.
8. Economic evaluation of mitigation measures
8.1. Model development
To determine the cost effectiveness of the different approaches for the mitigation of P loss, simple spreadsheet models were constructed to examine impacts on individual cereal crop margins and on the overall arable rotation. First, operating margins for each crop were calculated to reflect the direct costs of crop production (Appendix 2.6). These included: crop yield and price; seed, fertiliser and agro-chemical variable costs; and labour and machinery costs, which can be directly allocated to each crop enterprise, and which are associated with establishment, fertiliser and agro-chemical applications, and harvesting. Second, these margins were used to produce a net return per average cropped hectare for a typical arable operation, taking into account the difference in areas of crop grown. Finally, any impacts on yield, fertiliser or agrochemical requirements were incorporated, alongside the costs associated with undertaking each mitigation option, through a series of linked worksheets to demonstrate the impact on the relevant crop operating margins and the overall average net return per hectare.
8.2. Farm models
Three farm-level versions of the model were developed to represent each of the three case study farms. The models used data from the experimental work, the case study farm as a whole, and published data on prices and costs associated with each of the crop enterprises. To calculate gross output, average crop yields from each harvest year at each case study farm were multiplied by the relevant October market prices (Farmers Weekly, 2006a,b, 2007a,b; Farmers Weekly Interactive, 2007)1. Variable and
operational costs to calculate the gross and operating margins were based upon the standard data taken from Nix (2005), linked to field records as appropriate. Machinery costs reflect the number and type of operations and the length of time required to undertake them. They include fuel, labour requirement, repairs and depreciation but exclude more general overhead costs. The calculations also take into account the differences in work rate possible on light and medium/heavy soils that occur at each of the
21
1 Yields and prices for the 2008 harvest were not available at the time of writing this report. Yields and prices were therefore