Munich Personal RePEc Archive
A Financing-Based Misvaluation Factor
and the Cross Section of Expected
Returns
Hirshleifer, David and Jiang, Danling
31 October 2007
Online at
https://mpra.ub.uni-muenchen.de/20636/
A Financing-Based Misvaluation Factor and the Cross Section
of Expected Returns
∗David Hirshleifer†
Danling Jiang‡
February 10, 2010
Abstract
Behavioral theories suggest that investor misperceptions and market mispricing will be cor-related across firms. We use equity and debt financing to identify common misvaluation across firms. A zero-investment portfolio (UMO, Undervalued Minus Overvalued) built from repur-chase and new issue firms captures comovement in returns beyond that in some standard multi-factor models, and substantially improves the Sharpe ratio of the tangency portfolio. Loadings on UMO incrementally predict the cross-section of returns on both portfolios and individual stocks, even among firms not recently involved in external financing activities. Further evidence suggests that UMO loadings proxy for the common component of a stock’s misvaluation.
[Keywords] Misvaluation, financing, new issues, repurchase, factor models, market efficiency, behavioral finance
∗The paper was previously entitled “Equity Financing, Commonality in Misvaluation, and the Cross Section of Stock Returns.” We appreciate helpful comments and suggestions from James Ang, Alex Butler, Karl Diether, Bing Han, Jean Helwege, Kewei Hou, Jason Karceski, Andrew Karolyi, Pete Kyle, Sonya Lim, Dave Peterson, Christof Stahel, Ren´e Stulz, Bhaskaran Swaminathan, Siew Hong Teoh; participants at the Seventh Maryland Finance Symposium, the American Finance Association meetings at New Orleans, LA, and the Western Finance Association meetings at San Diego, CA; our discussants, respectively: Jay Ritter, Kent Daniel, and Andriy Bodnaruk. We thank Jay Ritter for providing the new issue data, Evgeny Lyandres for the investment factor returns, Michael Ferguson for the leverage factor returns, Kenneth French for the 4-factor returns and industry classifications, and SuJung Choi, Yong Rin Park, and Dave Weaver for helpful research assistance.
†Professor of Finance and Merage Chair in Business Growth, Paul Merage School of Business, University of California at Irvine, (949) 824-9955, E-mail: [email protected], http://web.merage.uci.edu/∼Hirshleifer/.
A Financing-Based Misvaluation Factor and the Cross Section of Expected Returns
Behavioral theories suggest that investor misperceptions and market mispricing will be
corre-lated across firms. We use equity and debt financing to identify common misvaluation across firms.
A zero-investment portfolio (UMO, Undervalued Minus Overvalued) built from repurchase and new
issue firms captures comovement in returns beyond that in some standard multifactor models, and
substantially improves the Sharpe ratio of the tangency portfolio. Loadings on UMO incrementally
predict the cross-section of returns on both portfolios and individual stocks, even among firms not
recently involved in external financing activities. Further evidence suggests that UMO loadings
Introduction
Several recent behavioral models predict commonality in the misvaluation of firms. In some models,
such commonality occurs because investors use past values of aggregate stock market indices as
reference points (see, e.g., Barberis, Huang, and Santos (2001), Barberis and Huang (2001)). In
the style investing approach of Barberis and Shleifer (2003), commonality in misvaluation arises
when investors irrationally become enamored or disillusioned with publicly observable stock
char-acteristics, inducing positive comovement among stocks with similar characteristics and negative
comovement in stocks with dissimilar characteristics. In the overconfidence approach of Daniel,
Hirshleifer, and Subrahmanyam (2001), investors misinterpret what they perceive to be private
information about the genuine economic factors influencing firms’ profits. Thus, sets of stocks with
similar loadings move together as information about factors arrives, is misinterpreted, and is later
corrected.
From a behavioral perspective, characteristics such as book-to-market can reflect either
firm-specific mispricing or misvaluation of systematic economic factors. Thus, evidence that stock
characteristics such as size, book-to-market, or momentum predict the cross section of future returns
does not resolve whether there is systematic or merely firm-specific mispricing.1
Some theoretical arguments suggest that most mispricing will be idiosyncratic, but others
sug-gest that common mispricing is more important. If investors devote less resources to the study of
an idiosyncratic payoff component than to a common one such as the market as a whole, then we
expect to see more mispricing in obscure, idiosyncratic corners of the market.2 On the other hand,
in the model of Daniel, Hirshleifer, and Subrahmanyam (2001), in frictionless markets idiosyncratic
mispricing can be arbitraged away with low risk through the use of hedge portfolios; it is the
mis-pricing of common factors that remains. Style investors and overconfident investors may trade in
ways that cause either idiosyncratic or common mispricing.3
1Fama and French (1993) find that book-to-market and size effects are associated with common factors, and
suggest a rational risk explanation. Carhart (1997) links the momentum effect to common factors. An additional literature refines, tests, and in some cases disputes the risk premium interpretation of the 3- or 4-factor model (e.g., Daniel and Titman (1997), Griffin and Lemmon (2002), and Hou, Peng, and Xiong (2007)).
2There is evidence that some anomalies are stronger within the idiosyncratic component of returns (Grundy and
Martin (2001), Hou, Peng, and Xiong (2007)).
3Investors do seem to think that they can acquire private information about aggregate factors, as evidenced by
So on prior grounds, a case can be made for either idiosyncratic or systematic mispricing. It is
therefore useful to test whether or not mispriced stocks comove, and whether measures of sensitivity
to factor mispricing can be used to predict the cross section of stock returns.
External financing and repurchase decisions provide a way to address these questions.
Theoret-ical and empirTheoret-ical research suggest that corporate managers undertake financing decisions to take
advantage of both firm-specific and common misvaluation. Theoretical models suggest that issuing
or repurchasing stocks or bonds to take advantage of inefficient stock mispricing (often translated
into debt mispricing) can benefit a firm’s existing shareholders, and can cause such activity to
predict future returns (Stein (1996), Daniel, Hirshleifer, and Subrahmanyam (1998)). Empirically,
evidence from equity or debt financing and long-run returns suggests that firms tend to issue equity
or risky debt when they are overvalued, and to buy back equity or retire risky debt when they are
undervalued (see Section 1.3).
In this paper we use external equity and debt financing activities to identify commonality in
stock misvaluation, or what we call factor mispricing, and test whether sensitivities to common
movements in misvaluation predict the cross-section of asset returns. We define a misvaluation
factor (or mispricing factor) as any statistical common factor in stock returns that is substantially
correlated with the common mispricing of individual stocks. Commonality in misvaluation can
occur when investors misinterpret signals about a fundamental economic factor, or when there are
shifts in investor sentiment about firm characteristics or ‘styles’.
If firms undertake new issues or repurchases to exploit mispricing, such events should reflect
information possessed by managers about stock mispricing (above and beyond other observable
characteristics such as equity book-to-market). Therefore, we will argue that issue and repurchase
firms should have extreme sensitivities to mispricing factors. Regardless of whether the comovement
in misvaluation arises from misperceptions about fundamentals, or from style-based sentiment, new
issue and repurchase stocks are predicted to comove (even after controlling for familiar factors such
as HML). We can therefore construct a misvaluation factor by going long on repurchase stocks
and short on the new issue stocks. This misvaluation factor is predicted to have a nonnegligible
positive variance, even after controlling for the market or other well-known factors. We call this
misvaluation factor UMO (Undervalued Minus Overvalued).
We further hypothesize that the loadings of general firms (not just those firms that have recently
engaged in issuance or repurchase activities) on UMO are proxies for systematic underpricing,
and therefore will positively predict future returns. This hypothesis implies that firms’ financing
decisions contain information for predicting returns that has not hitherto been exploited.
To see why, consider for example an oil price factor that affects firms’ cash flows, and suppose
that investors irrationally expect oil prices to be low. Repurchasers will tend to be firms that are
undervalued, which occurs if their profits are positively sensitive to oil prices (e.g., a solar power
product vendor), whereas equity issuers will tend to be firms that are overvalued because their
profits are negatively sensitive to oil prices (e.g., an airline). Furthermore, firms whose profits are
hurt by low oil prices will load positively on UMO since UMO is long on firms that do poorly when
oil prices are low. Similarly, firms that benefit from low oil prices will load negatively on UMO. In
other words, the factor loading measures the degree to which an asset inherits mispricing from the
mispriced factor.
Alternatively, common mispricing can be caused by shifts in investor sentiment associated with
different investment styles (rather than misperceptions of signals about fundamental factors). For
example, suppose that investors become enamored with high-tech firms. Then repurchases will be
common among undervalued low-tech firms, and new issues among high-tech firms. Low-tech firms,
in general, will tend to load positively on UMO because their returns are more highly correlated
with the low-tech firms that are engaging in repurchases than with the high-tech firms that are
engaging in new issue.
Both lines of reasoning imply that a firm that loads positively on the mispricing factor, UMO,
will, on average, be undervalued. As a result, loadings on the mispricing factor will positively
predict high subsequent returns as information about future fundamentals resolves.
Of course there are rational reasons for external financing other than exploiting temporary stock
misvaluation. For example, if investment is rationally undertaken in response to low project risk,
then equity or debt issuances for the purpose of investment will be associated with low subsequent
returns. In our tests we therefore control for sets of benchmark factors that have sometimes been
interpreted as reflecting rational risk premia, including the Fama French factors, the momentum
Sun, and Zhang 2008); we also control for industry effects.4 To the extent that these benchmark
factors and/or the characteristics they are based upon reflect behavioral effects (see, e.g., Keim
(1983), Loughran (1997), Baker and Wurgler (2002), Baker, Stein, and Wurgler (2003), Daniel,
Hirshleifer, and Subrahmanyam (2005), Polk and Sapienza (2009)), controlling for the benchmark
factors ensures that the UMO effects we identify are not just a repackaging of other known effects.
We find substantial variance in the return of UMO that is not fully explained by the returns
on our benchmark factor portfolios. Furthermore, other asset portfolios have non-zero loadings on
UMO even after controlling for the benchmark factors. These findings show that UMO captures
commonality in stock returns beyond that implied by the benchmark factors.
We also find that the UMO factor earns abnormally high returns. UMO produces a Sharpe
ratio (0.30) that is similar to that of the investment factor and higher than that of each of the other
benchmark factors. Using factors that are adjusted for the five Fama-French sectors, UMO delivers
the highest Sharpe ratio among all (0.39). Moreover, UMO increases the Sharpe ratio of theex post
tangency portfolio by about 75% relative to the Fama-French factors. MacKinlay (1995) argues that
the returns provided by the Fama French factors are too large to make sense from a rational asset
pricing perspective; the higher Sharpe ratio produced by UMO presents an even greater challenge.
Furthermore, regressing UMO on the sets of benchmark factors yields significantly positive alphas
of 6%−9% per annum, a strong abnormal performance relative to the benchmark.
We further show that at both the portfolio and the firm levels, assets with higher UMO loadings
on average earn higher subsequent returns. At the portfolio level, we estimate UMO loadings from
previous 5-year monthly returns. At the firm level, we obtain UMO loadings from two approaches
that account for the transitory nature of firm-level mispricing. In one, we estimate UMO loadings
from daily returns of individual stocks over a relatively short period, e.g., 3 to 12 months. In the
other, we assign stocks the loadings of portfolios that are matched by relevant firm characteristics
that are potentially related to mispricing, including size, book-to-market, and the external financing
variable of Bradshaw, Richardson, and Sloan (2006).
In portfolio tests, UMO loadings predict the cross-section of portfolio returns after controlling
4We also consider in Section A of the Addendum other controls as robustness checks, including the macroeconomic
for the loadings on the benchmark factors, with an estimated UMO premium of about 6%–9% per
annum. In firm level tests, a hedge portfolio that is long the highest and short the lowest loading
decile yields an annual abnormal return of 7–10% per year, and regression tests imply an abnormal
return from UMO loadings of over 17% per year. UMO loadings have incremental power to predict
returns after controlling for various firm characteristics.5 The marginal effect of UMO loadings on
the cross section of returns is considerably higher than that of the above return predictors.
This evidence is consistent with the proposition that the external financing decisions of
man-agers contain information about the common component of stock mispricing, above and beyond
firm characteristics such as size and book-to-market equity. The finding that UMO loadings have
incremental power relative to other measures of stock mispricing (such as the net composite
is-suance variable of Daniel and Titman (2006) and the asset growth variable of Cooper, Gulen, and
Schill (2008)) is consistent with behavioral theories that imply that both covariances and
charac-teristics will, in general, have incremental power to predict stock returns (Daniel, Hirshleifer, and
Subrahmanyam (2005)).
We also provide evidence that security loadings on the UMO factor have a period of stability
much shorter than that of several well-known proposed fundamental factors. Following Fama and
French (1992), we estimate the pre-ranking UMO loadings for individual stocks using 3-5 years of
monthly returns and the post ranking loadings from portfolios constructed based on pre-ranking
loadings. We find that, UMO loadings are much more likely to flip signs than loadings on the 3
factors, and that sorting stocks based on pre-ranking UMO loadings create little dispersion in the
post-ranking period (in sharp contrast to the behavior of loadings on the Fama-French factors).
In a behavioral setting, loadings on the mispricing factor, UMO, are proxies for systematic
underpricing. Overreactions to factor signals cause fundamental factors to become overpriced at
certain times and underpriced at others, while shifts in investor sentiment lead investment styles
to become ‘hot’ or ‘cold’ over time. As a result, individual stocks that load on the mispriced
fundamental factors or style factors will inherit the factor under- and overpricing accordingly. Since
UMO is constructed to be long on underpriced factors and short on overpriced ones, UMO loadings
5We control for size, book-to-market equity, past returns, industry dummies, the external financing variable of
of individual stocks will shift signs to reflect the shifts in factor or style mispricing. Therefore, we
expect UMO loadings to mean-revert quickly or even flip signs over a period of 3-5 years (see the
discussion in Section 3.1).
1
Motivation and Hypotheses
1.1 Rational Factor Pricing Models
In rational factor pricing models such as the intertemporal CAPM, only factor covariance is ‘priced,’
so after controlling for factor loadings no other publicly available information can be used to predict
returns. There are several possible reasons why equity financing may be correlated with risk in
a rational asset pricing model. First, as discussed in the introduction, equity issuance decreases
leverage, which should reduce factor loadings and premia (e.g., Eckbo, Masulis, and Norli (2000)).
An implication of this argument is that shifts in leverage changes should explain the returns of new
issue firms. However, the leverage effect would predict that debt financing should precede high
future stock returns. Since we are examining external financing as a whole, it is unclear whether
there should be a net leverage effect.
Second, a shift in a firm’s loadings which decreases its risk premium/discount rate should cause
it to increase planned investment (Berk, Green, and Naik 1999; Zhang 2005). This implies a greater
need to issue equity or debt to fund investment, so firms that have issued to fund investment should
have lower expected stock returns. This argument implies that the ability of equity/debt issuance
to predict returns should be explained by investment.6 Similarly, the ability of a financing factor
to explain the cross section of returns should be largely subsumed by an investment factor.
1.2 Behavioral Models
We focus here upon the style investing model of Barberis and Shleifer (2003) and the overconfidence
model of Daniel, Hirshleifer, and Subrahmanyam (2001).7 In the model of Barberis and Shleifer
6Both the leverage effect and the investment effect, however, can be caused by managers exploiting irrational
market valuation. So the fact that external financing is related to investments does not necessarily preclude a behavioral explanation; see Baker and Wurgler (2002), Baker, Stein, and Wurgler (2003), and Gilchrist, Himmelberg, and Huberman (2005).
7Several other models also imply non-fundamental commonality in asset price movements. For example, the
(2003), stocks comove with two factors, a market factor, which captures market-wide cash flows,
and a style factor, which represents commonality in sentiment for styles of stocks (such as size,
value versus growth, or high-tech versus low-tech). Investors shift between styles based on past
relative performance. Accordingly, the demand for different kinds of stocks varies according to
their sensitivity to different style factors and to past style performance. Stocks whose styles have
performed well become overpriced, leading eventually to low returns. Therefore, this model predicts
that common shifts in investor style investing cause commonality in mispricing.
In the model of Daniel, Hirshleifer, and Subrahmanyam (2001), overconfident investors
over-estimate signal precision and, accordingly, overreact to private signals about payoffs of economic
factors, which creates mispricing of factor payoffs and of all securities whose cash flows are derived
from these factors. In equilibrium, securities that load heavily on mispriced factors will be more
misvalued. Thus, systematic mispricing results from investors’ biased interpretation of factor cash
flow information and reflects overreaction to cash flow news about fundamental factors.
Both behavioral models imply excess return comovement among securities caused by common
misvaluation and correction of such mispricing. Here we define excess comovement as
comove-ment in stock returns that deviates (either positively or negatively) from the fundacomove-mentals-based
comovement that would exist in an efficient market based upon common fundamental influences.
Systematic mispricing can be correlated with fundamental cash flow factors, but does not have to
be.
A growing literature tests whether market inefficiency is a source of stock return comovement.8
An advantage of using issuance/repurchase to identify commonality in misvaluation is that the
decision to issue or repurchase equity or debt, under existing behavioral theories, reflects the beliefs
of management about whether the stock is mispriced. It therefore provides an overall measure of
mispricing based on information not otherwise detectable to the econometrician.
1.3 External Financing
Existing evidence suggests that the post-event long-run performance of new issues and repurchases
reflect correction of mispricing. For example, firms that engage in IPOs and SEOs on average
8See Lee, Shleifer, and Thaler (1991), Barberis, Shleifer, and Wurgler (2005), Goetzmann and Massa (2005), Baker
underperform standard benchmarks for three to five years subsequent to the issue (Loughran and
Ritter (1995, 2000), Spiess and Affleck-Graves (1995); using a modified benchmark, Brav, Geczy,
and Gompers (2000) concur for post-SEO but not post-IPO underperformance). Since overvalued
firms will tend to have both overpriced equity and risky debt, overvalued firms should tend to
issue risky debt to exploit mispricing, and their equity should subsequently underperform.9 Some
recent studies further show that firm-level measures of net equity financing are negatively related to
subsequent stock returns (e.g., Daniel and Titman (2006), Pontiff and Woodgate (2008), Bradshaw,
Richardson, and Sloan (2006)).
Furthermore, aggregate equity issuance is correlated with market valuations and can forecast
aggregate returns (e.g., Ritter (1984), Loughran, Ritter, and Rydqvist (1994), Baker and Wurgler
(2000), and Lowry (2003)). This is potentially consistent with equity issuance responding to
sector-or market-wide mispricing.10
With respect to repurchase, Lakonishok and Vermaelen (1990) and Ikenberry, Lakonishok, and
Vermaelen (1995) show that the stocks of firms that buy back shares on average overperform in the
subsequent three years. Similarly, the stocks of firms that reduce the outstanding debt in the face
of market undervaluation tend to overperform (e.g., (Bradshaw, Richardson, and Sloan 2006)).
Graham and Harvey (2001) find that a majority of CFOs say that stock mispricing is an
important motive to issue equity. Consistent with market expectational errors, Jegadeesh (2000)
documents that the stock market reacts unfavorably to earnings announcements subsequent to new
issues. More generally, a rational risk-based explanation for the new issues puzzle seems to require
that recent issuers have unusually low risk. It has not so far been established that new issue firms
are a good hedge for aggregate consumption.
Our paper differs from past work in this area in focusing on how general stocks comove with
external-financing firms, and how covariance with a financing-based factor predicts future returns.
9This is consistent with the evidence of Stigler (1964), Spiess and Affleck-Graves (1999), Bradshaw, Richardson,
and Sloan (2006), and Cooper, Gulen, and Schill (2008). Overvaluation should cause greater issuance in total, and a substitution from debt to equity issuance. Baker and Wurgler (2000) test a hypothesis about substitution based on market timing of therelativemispricing of equity versus debt. However, debt and equity issuance are imperfect substitutes because of agency and tax considerations. So despite the substitution effect, we do not expect the increase in total financing to be absorbed entirely by net equity issuance.
10Schultz (2003) suggests that the long term performance of new issues and repurchases may be a result of a pseudo
1.4 Hypotheses
We focus our hypotheses on the predictions of behavioral models, with the predictions of rational
factor pricing as the key alternative. Specifically, we hypothesize that a misvaluation factor (UMO)
that is long on repurchase stocks (Undervalued) and short on new issue stocks (Overvalued) should
capture comovement associated with mispricing, and that an asset’s loading on UMO will positively
predict future returns.
Based on the abovementioned behavioral models, we formulate the following testable hypotheses
about UMO. Section C of the Addendum formally derives these predictions in a model based on
the approach of Daniel, Hirshleifer, and Subrahmanyam (2001). These hypotheses, however, are
intuitive and would apply in other behavioral modeling specifications as well.
We now lay out several empirical predictions and discuss the justification for each in turn.
Prediction 1: There is incremental comovement in stock returns associated with UMO above and
beyond that implied by benchmark factors.
If there is commonality in mispricing, we expect mispricing to be shared by stocks (including
those not involved with recent financing and payout activities) that load on the same mispriced
fundamental factors, or that possess mispriced style characteristics. In either case, such stocks
will comove with the misvaluation factor, UMO, even after controlling for proxies for possible
fundamental factors.
Prediction 2: UMO will earn abnormally high returns relative to the benchmark factors.
Since UMO is designed to capture the spread between under and overpriced stocks, it is predicted
to produce abnormal returns relative to common risk factors. In other words, we expect UMO to
have a high Sharpe ratio, and to earn a significant alpha in a regression on the benchmark factors.
Prediction 3: The loadings on UMO will forecast the cross section of stock returns.
Under our prediction that UMO captures comovement in returns incrementally to factors such
as SMB, HML, and the momentum factor (MOM), we hypothesize that securities’ loadings on
UMO measure the degree of underpricing deriving from common factors (membership in misvalued
sectors, or style effects). In other words, a positive loading identifies the influence on the stock
such underpricing is subsequently corrected, securities with larger UMO loadings will earn greater
returns. Stocks that load positively on UMO will behave like repurchase firms and outperform while
those loaded negatively on UMO will behave like new issue firms and will underperform. Thus,
the loadings on a factor that is based on new issues and repurchases can be exploited to forecast
returns on general stocks including those that have not recently been involved in equity financing
transactions.
So long as new issuance or repurchase is associated with firm-specific, not just common,
mis-pricing, the amount of issuance or repurchase should predict returns even after controlling for the
degree to which the firm partakes of common mispricing. We therefore predict that measure of
external equity and/or debt financing will predict returns even after controlling for the UMO
load-ing (see Daniel, Hirshleifer, and Subrahmanyam (2005) for a model with an analogous prediction
about book-to-market and HML loadings).
2
Data
Our sample includes common stocks traded on NYSE, AMEX, and NASDAQ over the period
January 1970 to December 2008. We also exclude utilities (SIC codes between 4900 and 4949)
and financials (SIC codes between 6000 and 6999) since mispricing is more constrained among
regulated industries. Stock returns and other trading information are from the Center for Research
in Security Prices (CRSP). Accounting information is from COMPUSTAT from 1971 to 2008. Daily
and monthly return series for the market factor (MKT), the size factor (SMB), and the
book-to-market factor (HML), the momentum factor (MOM), and the risk-free rates are from Kenneth
French’s website. The investment factor (INV) is defined as the return of low investment firms
minus that of high investment firms. The leverage factor (LEV) is the return of high leveraged
firms minus that of low leverage firms.11 The Appendix provides details of the construction of the
two factors.
11We use the monthly return series of the investment factor provided by Evgeny Lyandres up to December 2005
2.1 Main Sample
——–INSERT TABLE I HERE——–
Among the sample firms, we identify 7,985 initial public offerings (IPO) and 7,110 seasoned
equity offerings (SEO) from the new issue data provided by Jay Ritter through the end of 2004
for IPOs and of 2001 for SEOs, supplemented by data from the SDC Global New Issues dataset
through December 2008. For IPOs, we require the IPO to appear in CRSP file within six months
from the offer date. For SEOs, we exclude unit offerings and pure secondary Offerings. From the
SDC Global New Issues dataset we identify 6,734 debt offerings (DISSUE), including both straight
(non-convertible) debt and convertible debt, among the sample firms. We require SEO and DISSUE
to have valid returns at the end of the offer month in CRSP. The annual number of firms is reported
in Table I.
Also shown in Table I, altogether, we identify 20,173 equity repurchases (ERP) events and
43,849 debt repurchase (DRP) events from COMPUSTAT annual statements. ERP is defined as
occurring when net equity repurchases in a given fiscal year exceed 1% of the average total assets,
and DRP is defined as occurring when net long-term debt reduction in a given fiscal year exceeds
1% of the average total assets. Specially, the net equity repurchase is total repurchase of common
stocks minus total issuance of common stocks. Total repurchase of common stocks is the purchase
of common and preferred stocks (COMPUSTAT variable PRSTKC) less any decrease in preferred
stocks. Total issuance of common stocks is the sale of common and preferred stocks (SSTK) less any
increase in preferred stocks. We measure preferred stocks as, in order of preference, the redemption
value (PSTKRV), the liquidating value (PSTKL), or the carrying value (PSTK). Long-term debt
reduction is defined as long term debt reduction (DLTR) minus long-term debt issuance (DLTIS)
from the cash flow statement.
The main findings of the paper are similar if we identify IPO events as the first appearance
in CRSP, if we use cash flow statement information to identify equity and/or debt issuance, if we
change the cutoff of the equity/debt issuance or repurchase as a fraction of the total assets to as
low as 0% or as high as 5%, if we obtain equity repurchase events (both open market and tender
2.2 Key Variables
At the end of June of each year, we include firms with IPOs, SEOs, and debt issuances (DISSUE) in
the past 24 months but not with equity repurchases (ERPs) or debt repurchases (DRPs) in the two
most recent fiscal years with the fiscal year ending as of last December in portfolio ‘O’ (Overpriced).
We include firms with DRPs or ERPs in the two most recent fiscal years with the fiscal year ending
as of last December but not with IPOs, SEOs, or DISSUE in the past 24 months in portfolio ‘U’
(Undervalued). We require a gap of at least six months between the fiscal year end and the time of
portfolio formation to ensure that repurchases by then are public information. Since prior literature
shows that the long run abnormal performance of new issues and repurchases are concentrated in
the first three years after events (e.g., Loughran and Ritter (1995), Ikenberry, Lakonishok, and
Vermaelen (1995)), we select firms based on events that have occurred in the preceding 2 years
so that the event portfolio returns cover the period from one to three years following the event.
Finally, stocks with both equity issuance and repurchases or neither are included in portfolio ‘N’
(neutral).12
The three equal-weighted portfolios are held from July of year t to June of year t+ 1, and
rebalanced. Following Fama and French (1993), we form a zero-investment portfolio ‘UMO’
(Un-dervaluation Minus Overvaluation), which is long on U and short on O, to capture the possible
commonality in misvaluation.13
It could be argued that the performance of UMO comes from industry/sector-wide fundamental
shocks (e.g., Hou (2007)) that are not captured by the benchmark factors. Therefore, we also
consider a sector-neutral ‘UMO⊥SEC’ that minimizes sectoral effects by compute the equal-weighted
returns among new issues separately within each of the five sectors, based on the Fama-French 5
industry classifications. Then we define the equal-weighted five sector returns as returns on O⊥SEC.
Similar procedures are used for U⊥SEC. Finally, UMO⊥SEC returns are the difference between
12Depending on the year, on average a fraction of about 14% of event firms (standard deviation 7.7%) are excluded
from portfolio O or U for being both issuers and repurchasers. Thus, an overwhelming fraction of event firms can be identified as either under or overpriced unambiguously using the external financing events.
13It is known that new issues tend to be small growth firms and repurchasers tend to be large value firms. When
U⊥SEC and O⊥SEC.
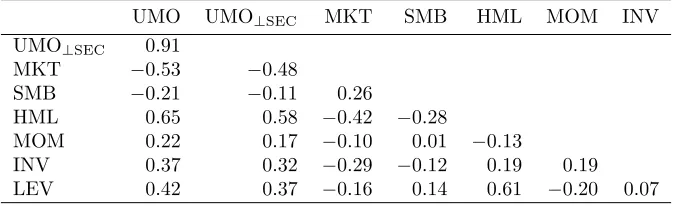
——–INSERT TABLE II HERE——–
Table II reports the summary statistics of the event portfolios, UMO, and the other well-known
factor portfolios. Since quarterly accounting information is available from 1971, the portfolio U
starts from July of 1972, which limits our factor UMO to the period starting from July of 1972.
As shown in Table I, the average number of firms in July of each year is 505 for O and 1695 in U,
showing that UMO contains a sizable number of stocks.14
Consistent with the previous literature, during our sample period, repurchase stocks (U) on
average outperform neutral (N) stocks while neutral stocks (N) on average outperform new issue
stocks (O). UMO offers an average return 0.93% per month, or over 11% per year while UMO⊥SEC
0.92% per month. The two are highly correlated, with a coefficient of 0.91 as shown in Panel B.
Panel B also shows that UMO has strong correlations with MKT, HML, MOM, INV, and LEV.
In our subsequent tests, we estimate loadings on UMO by controlling for these benchmark factors.
Thus, our findings that UMO loadings are positive predictors of the cross section of returns are not
driven by these factor correlations.
UMO and UMO⊥SEC provide Sharpe ratios 0.30 and 0.39, respectively, which are
consider-ably greater than those of MKT (0.08), SMB (0.05), HML (0.16), MOM (0.21), and LEV (0.11),
and comparable to INV (0.30). To study the incremental contribution of UMO in improving the
achievable Sharpe ratios, in Panel C, we report the weights, returns, and Sharpe ratios of the ex
post tangency portfolios calculated following MacKinlay (1995). The tangency portfolio generates
the highest Sharpe ratio by optimally combining a subset of factors. The panel shows that adding
UMO to the 3 factors increases the maximum Sharpe ratio from 0.24 to 0.42, an increase close to
75%. Adding UMO to the 3 factors plus the momentum factor increases the Sharpe ratio from
0.35 to 0.44. In both cases, the tangency portfolio places a substantial weight (65% and 47%) on
UMO as opposed to the other candidate factors. Adding UMO to the 3 factors greatly reduces the
14Although firms stay in O or U for a two-year period, the number of firms in O or U is less than twice the number
weight of SMB—from 0.17 to 0.09, and essentially eliminates the weight on HML in the tangency
portfolio—a reduction from 0.58 to −0.02. This probably occurs because UMO is rather highly
correlated with HML (0.65), but delivers much higher expected returns with similar volatility. This
suggests that UMO is a better proxy than HML for misvaluation or for priced factors.
The improvement in the Sharpe ratio from adding UMO is observed if we include INV or LEV
together with the 3 factors, although the size of the improvement differs across specifications. The
highest Sharpe ratio (0.49) is achieved by combining the 3 factors with INV and UMO. Across all
cases, we observe a visible reduction in the weights of SMB and HML. Overall, the results show
that UMO delivers an unusually large Sharpe ratio and is an important contributor to an ex post
tangency portfolio.
3
Comovement in Returns and the UMO factor
In this section, we test whether, as hypothesized, UMO captures commonality in returns, and
whether UMO achieves abnormal returns relative to other benchmark factors.
3.1 Loadings of Assets on UMO
Prediction 1 implies return comovement. We first test for comovement by estimating the loadings
of assets on UMO. If overpriced or underpriced general individual stocks load on some of the
same mispriced fundamental factors that new issues and repurchase stocks load upon, or mispriced
general stocks share some of the same style characteristics that cause mispricing in new issue and
repurchase stocks, they will share incremental comovement with UMO relative to the benchmark
factors during the period that mispricing is created and later corrected. However, over a long time
series, if overpricing and underpricing occur about equally often, we expect individual stocks to
have loadings on UMO that are close to zero.15
In contrast, we expect portfolios formed based on mispricing measures to have stable loadings
on UMO—positive among underpriced stocks and negative among overpriced stocks. When such
15In the example discussed in the introduction, when investors irrationally expect low oil prices, airlines are
portfolios are periodically rebalanced, stocks enter or exit the portfolios according to their degree of
mispricing, which tends to stabilize the degree of mispricing in the portfolio (relative to other stocks)
and therefore the loadings of the portfolios on UMO. Therefore, to test for return comovement with
UMO, we perform tests on portfolios which we rebalance based upon firm characteristics that are
potentially related to mispricing, such as size, book-to-market, and financing-based variables. These
portfolios are rebalanced once every year to make sure each continues to include similar levels of
characteristics, implying similar degrees of under- or overpricing, and therefore similar loadings on
UMO over time.
Using the well-known Fama-French 25 size-BM portfolios as an example, we regress
value-weighted monthly returns of each portfolio on UMO together with the Fama-French 3 factors and
test whether UMO loadings (βu) are jointly different from zero.
——–INSERT Figure 1 HERE——–
Panel A of Figure 1 plots the UMO loadings across the size and book-to-market sorts. Results
based on UMO⊥SEC or with alternative benchmark factors are similar. We focus on the smallest
and the largest size groups because they exhibit distinct comovement with UMO across the
book-to-market quintiles. Among the smallest size group, UMO loadings increase with the book-to-book-to-market
while among the largest size group, the opposite pattern holds. In other words, small growth and
large value firms tend to load negatively on UMO while small value and large growth firms tend to
load positively on UMO. The pattern of UMO loadings is very similar to that of the Fama-French
3-factor alphas reported in Panel B. The mispricing of the 25 portfolios relative to the 3-factor
model is highly correlated with UMO loadings, with a correlation coefficient of 0.75. This suggests
that UMO helps explain the pricing errors of the 3-factor model. In addition, UMO loadings do
not line up monotonically with either size or BM. This evidence indicates that UMO loadings
capture different aspects of expected returns from HML and SMB loadings. TheF-statistic is 8.39
(p= 0.00), which strongly rejects the null that all UMO loadings are jointly equal to zero.
In unreported tests, we find that UMO indeed helps reduce and even eliminate pricing errors
(alphas) in time series regression. In particular, when the 3-factor model is used to price the 25
portfolios. When UMO is additionally included, these pricing errors are substantially reduced
and become insignificant for all but extreme small-growth portfolio. After adding UMO to the 3
factors, theF-statistic that tests whether the alphas are jointly equal to zero no longer rejects that
null. Moreover, we also find that, relative to the 3-factor model, UMO helps reduce the pricing
errors of portfolios based on other corporate events that are known to produce abnormal long-run
performances, such as mergers & acquisition (Loughran and Vijh 1997), dividend initiation and
resumption (Michaely, Thaler, and Womack 1995), and dividend omission (Boehme and Sorescu
2002). Overall, this evidence indicates that UMO is important for pricing stocks with a variety of
characteristics, and that the anomalous returns on the corner portfolios, and on other
corporate-event based portfolios result from commonality in mispricing that is captured by the UMO factor.
3.2 UMO and Other Factors
In this subsection we provide a further test of whether UMO is a source of comovement
(Predic-tion 1) based solely on factors returns, and then test whether UMO achieves abnormal returns
(Prediction 2).
In general, in a randomly formed, well-diversified, zero-investment portfolio, as the number of
securities increases, both the loadings on underlying factors and idiosyncratic risk approach zero.
In consequence, portfolio return variance also approaches zero. In contrast, Prediction 1 implies
that forming a long-short portfolio based upon firms’ financing decisions causes loading on some
underlying factor(s), resulting in substantial positive variance. As a result, residual variance is
predicted to be non-negligible even after regressing on the benchmark factors, and specifically, is
predicted to be greater than that would be observed with equal-weighted long-short portfolios with
randomly selected stocks.
In our tests, portfolios with randomly selected stocks are formed at the end of each June by
randomly-selecting the equal number of stocks as that in portfolio U in the long side and as that in
portfolio O in the short side. Then we calculate the equal-weighted long-short portfolio returns. We
regress the randomly-selected portfolio on a set of benchmark factors and compute the variance of
the residual terms. This exercise is repeated 1,000 times to generate a distribution of the standard
deviation of the residual terms to compare with the standard deviation of residuals associated with
Table III.
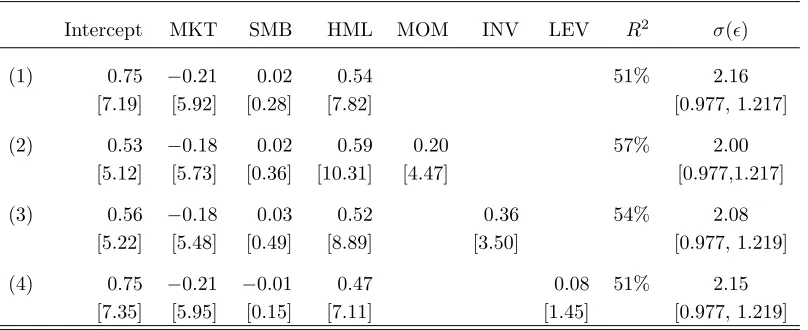
——–INSERT TABLE III HERE——–
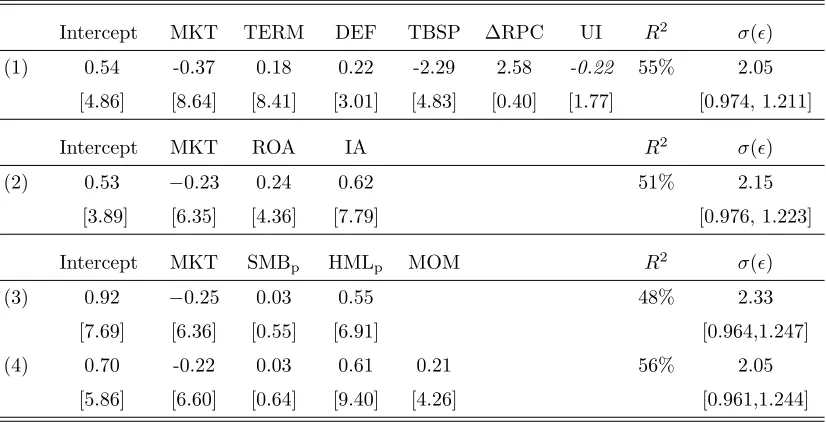
Consistent with Prediction 1, we find R2s on the order of roughly 51–57%, and the standard
deviation of the residual terms are around 2.00–2.06% per month, which are significantly greater
than that based on randomly selected portfolios. The low R2s and high residual volatility
sug-gest that new issue and repurchase stocks share incremental commonality above and beyond the
comovement implied by the benchmark factors. This is consistent with UMO capturing common
misvaluation factors. However, this does not rule out the possibility that the commonality comes
from fundamental sources not captured by the 4 factors.
This regression also provides a test of Prediction 2, abnormal performance of UMO. Consistent
with Prediction 2, as shown in Table III, the positive alphas, ranging from 0.53%–0.75% per
month, show that UMO offers abnormally high returns (6.36%–9.00% per year) relative to the
benchmark factors. This evidence confirms the findings of previous research of significant long-run
overperformance associated with repurchases and underperformance associated with new issues.
As discussed in Section 1.1, the returns on firms with financing events may be related to a
common factor in growth/investment opportunities. This is to some extent controlled for by HML,
but to further test for this possibility, in Section A of the Addendum, we consider other sets of
benchmark factors, including the macroeconomic factors suggested by Eckbo, Masulis, and Norli
(2000), the new three-factor by Chen and Zhang (2010), the Fama-French factors purged of new
issue firms (e.g., Loughran and Ritter (2000)), and a factor based on the asset growth variable of
Cooper, Gulen, and Schill (2008). Even after controlling for models containing these additional
factors, theR2of UMO is still below 56%. The residual volatility is around 2.05–2.33%, significantly
higher than the simulated residual volatility based on random long-short portfolios over the same
sample period.
4
Do UMO Loadings Predict the Cross Section of Asset Returns?
We now test Prediction 3, that UMO loadings predict the cross section of future asset returns.
undervaluation, and therefore will predict higher excess returns. We start by testing the ability of
loadings on characteristic portfolios to predict returns, and then consider loadings on individual
stocks.
4.1 UMO Loadings and the Cross Section of Portfolio Returns
UMO loadings for individual stocks tend to be unstable over time. Intuitively, different styles or
economic factors can be over- and underpriced at different times, and accordingly a positive loading
on certain style or economic factors can imply over- and undervaluation at different times. (Section
C of the Addendum contains a proof for this assertion (see Proposition 2).) UMO is always long on
the underpricing factors and short on the overpricing factors. Thus, we expect individual stocks,
while having fairly persistent loadings on the style or economic factors, to have unstable loadings
on UMO.
In contrast with individual stocks, portfolios that are formed based on possible mispricing
proxies such as book-to-market are expected to have much more stable UMO loadings over time.
Thus, we run a Fama-MacBeth regression with the 25 size-BM portfolios and test whether UMO
carries a significant positive premium, in which the UMO loadings of the 25 portfolios are estimated
within an annually-updated rolling 5-year window on the benchmark factors together with UMO.
The mean premia and the Newey and West (1987)t-statistics are reported in Table IV.
——–INSERT TABLE IV HERE——–
Table IV shows that the premium of UMO is always positive, economically and statistically
significant, regardless of the specifications of the model. For instance, the average premium of
UMO, in regression (1) is 0.51% per month (t= 2.54) controlling for the market factor, in (3) is
0.75% per month (t= 4.09) with controls for the 3 factors, and in regression (6) is 0.73% per month
(t = 4.06) with controls for the 4 factors.16 In other words, the estimated UMO premium ranges
from 6.12%-9.36%. Similar results are obtained after additionally controlling for INV and LEV, or
replacing UMO with UMO⊥SEC.
16The coefficient on UMO jumps when SMB and HML are included in the regression. A possible reason why adding
Lewellen, Nagel, and Shanken (2010) show that a proposed factor that is correlated (even
weakly) with SMB and HML can spuriously price the 25 size-BM portfolios in the cross section.
To address this possibility, in Section A of the Addendum, we use the orthogonalized UMOs (that
are orthogonalized to the 3- or 4-factors) to estimate UMO loadings and then add these loadings in
the Fama-MacBeth regressions to examine their incremental return predictive power. The results
remain unchanged.17
4.2 UMO Loadings and the Cross Section of Individual Stock Returns
Behavioral theories suggest that UMO loadings should forecast not only the returns on portfolios
(formed by sorting on potential mispricing proxies) but also on individual stocks. Stocks with
higher sensitivity to UMO should partake of greater systematic undervaluation and have stronger
return reversal when mispricing is corrected.
As discussed previously in Section 3.1, estimating UMO loadings on individual stocks is
chal-lenging due to the (theoretically predicted) instability of these loadings. We therefore adopt two
different approaches to estimate UMO loadings.
4.2.1 Conditional UMO Loadings Estimated from Daily Returns over Short Windows
In the first approach, we estimate UMO loadings from daily returns over a short period, an approach
also used in previous studies (e.g., Lewellen and Nagel (2006)). In our context, loadings are unstable
because misvaluation is temporary, and over a sufficiently long horizon should on average vanish.
Specifically, we estimate firm-level UMO loadings using at least 100 daily returns over the most
recent 12-month period with controls for the 3 factors. We call the estimated UMO loading the
pre-formation loading, denoted as βupre. (Reducing the estimation period to three months yields
similar results.)
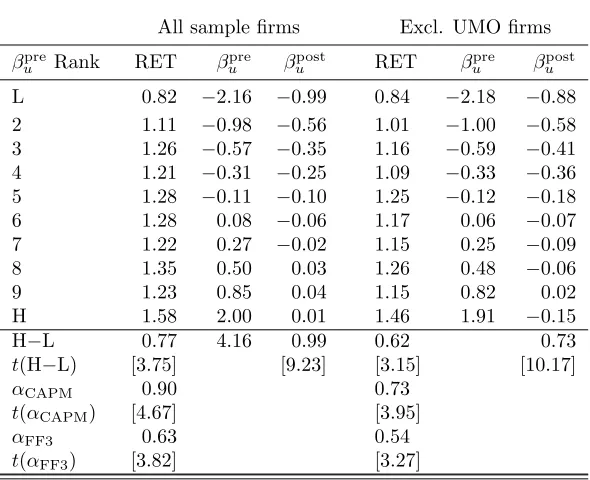
——–INSERT TABLE V HERE——–
After obtaining βupre, we sort stocks based on βupre into deciles and calculate both the
equal-weighted decile returns in the following month. As shown in Table V, the decile returns tend to
17Similar results also obtain for various sets of portfolios sorted based on size, book-to-market equity, external
increase withβupre. The return differentials between the highest and the lowestβpreu deciles is 0.77%
per month (t= 3.75), or 9.24% per annum. The alphas from the CAPM and the 3 factor model
remain sizable and statistically significant, suggesting an annual abnormal return of 7.6-10.8%.
After excluding firms in UMO, also shown in Table V, we observe that the results remain strong
with a slight reduction in the size of the long-short returns. The post-ranking UMO loadings,
βupost, generally monotonically increase with the pre-ranking loading ranks, suggesting that over a
12-13 month period, UMO loadings are persistent during the window. Overall, the results show
an economically and statistically significant premium on UMO at the firm level, even among those
firms that are not recently involved in external issuances or repurchases.
4.2.2 Conditional UMO Loadings Estimated from Characteristics Portfolios
The advantage of the first approach is that it obtains firm-level UMO loadings directly from
in-dividual stock returns. This method, however, is known to generate relatively imprecise loadings
since firm-level loadings tend to be more subject to regression-to-the-mean, which in our context
means a greater tendency to reverse out. Thus, it is difficult to assess whether UMO loadings add
incremental predictive power relative to existing firm-level return predictors.
To obtain more precise UMO loadings, in the second approach, we employ a modified version
of the estimation procedure by Fama and French (1992), known as the portfolio shrinkage method.
However, instead of estimating unconditional UMO loadings using past 3-5 year firm-level returns as
in Fama and French (1992), we estimate conditional security UMO loadings from annually-balanced
portfolios sorted by mispricing proxies. Again, this is because mispricing tends to be temporary
and reverses out during a period of 3-5 years.
In this procedure, at the end of each month from June of yeartthrough May of yeart+1, we first
sort all stocks into 100 portfolios according to two firm characteristics that proxy for misvaluation,
such as firm size (ME) during the most recent June and the external financing variable (EXFIN)
calculated at the fiscal year ending as of December of yeart−1. Results using various combinations
of ME, BM, EXFIN, and IR are similar and thus unreported. By sorting stocks based on firm
mispricing proxies, we create dispersion in the sensitivities to UMO. We then estimate the UMO
1972 through montht−1, in a time-series regression with controls for the 4 factors.18 Finally, each
individual stock assumes the portfolio loading according to which portfolio it belongs in month
t−1.19
We denote the conditional UMO loadings as βUMO and use these loadings to forecast stock
returns in month t with controls for a set of standard predictors, which include logarithmic firm
size, LOG(ME), logarithmic book-to-market, LOG(BM), past one month return,r(t−1), past returns
from month t−12 to t−2, r(t−12,t−2), past returns from month t−36 to t−13, r(t−36,t−13),
industry dummies based on the Fama-French 49 industry classifications, and the 3-factor loadings.20
The past return measures are expressed on a monthly basis. UMO loadings are normalized and
standardized to have zero mean and unit variance. The estimated coefficients are averaged across
time and reported in Table VI. A positive average coefficient of UMO loading will indicate that
high UMO loading stocks tend to earn higher returns on top of the controls.
——–INSERT TABLE VI HERE——–
Consistent with Prediction 3, as shown in Specifications (1) and (2) in Panel A of Table VI, the
average coefficients ofβUMOare all positive and statistically significant, before and after adding the
standard controls. Before controlling for the standard return predictors, the coefficient ofβUMO is
0.48 (t= 6.87). After adding the controls, the coefficient of βUMO is 0.35 (t= 7.80). This implies
that, moving from the lowest (with meanβUMO of−1.78) to the highest (with meanβUMO of 1.78)
decile, the marginal effect (abnormal return) is 15.14% (= (1.78−(−1.78))×0.35%×12).
In Panel B, we exclude stocks in the dependent variable used to form UMO of the current year.
The results are similar. The coefficient ofβUMO is 0.44 (t= 6.21) before adding the controls and
0.33 (t = 6.74) after adding the controls. The coefficient with controls implies a marginal effect
of 14.29% per annum, moving from the lowest to the highest βUMO decile. So this evidence shows
that stocks that load heavily on UMO on average earn higher returns, even after controlling for the
standard predictors of the cross section of stock returns. This predictive ability of UMO loadings
18Using a rolling window over the past 60 months to estimate UMO loadings produces qualitatively similar results. 19The results are similar if size and book-to-market, or book-to-market and IR, are used to sort the characteristic
portfolios. We expect to obtain appropriate estimates of UMO loadings so long as the characteristic variables are sufficiently good proxies for stock mispricing to create substantial large dispersion in UMO loadings.
20The predictors are designed to capture the size effect, the book-to-market effect, the short-term return contrarian
applies not only to firms involved in equity financing events, but to those that have not recently
been engaged in either new issues or repurchases.
Next, we run a horse race between UMO loadings and a set of other return predictors
docu-mented in recent literature, including external financing (EXFIN) as in Bradshaw, Richardson, and
Sloan (2006), net composite issuance (IR) as in Daniel and Titman (2006), the investment-asset
ratio (IVA) as in Lyandres, Sun, and Zhang (2008), net operating assets (NOA) as in Hirshleifer,
Hou, Teoh, and Zhang (2004), operating accruals (ACCRUALS) as in Teoh, Welch, and Wong
(1998b, 1998a), and the abnormal capital investment (CI) of Titman, Wei, and Xie (2004). This
test serves two purposes. First, some or all of these characteristics have been interpreted as proxies
for firm-level mispricing. Daniel, Hirshleifer, and Subrahmanyam (2005) describe a behavioral
set-ting with no risk premia, in which both characteristics and covariances have incremental predictive
power to predict returns.21 Thus, it is interesting to test whether UMO loadings as proxies for
systematic underpricing can pick up incremental return predictability beyond that captured by
firm characteristics. Second, regardless of whether these characteristics variables are interpreted as
proxies for risk or mispricing, it is useful to see whether UMO loadings have an ability to predict
the cross section of returns incremental to known predictors.
In Table VI, from regressions (3)-(9), we run the Fama-MacBeth regressions on UMO loadings,
the set of standard controls, and each of the seven new return predictors. As with the UMO loadings,
these new predictors are normalized and standardized to have zero mean and unit variance. The
results confirm the ability of UMO loadings to positively forecast returns after controlling for these
additional predictors. The coefficients on the normalized UMO loadings range from 0.25 to 0.35,
indicating a marginal effect on returns of 10.73% to 15.05%. The coefficients on the seven other
predictors (from−0.07 to−0.35) all imply a smaller marginal effect. For example, the net issuance
variable IR has the largest marginal effect among these predictors. Moving from the highest to
the lowest IR decile, the coefficient −0.19 implies an increase in decile returns by 7.82%, which is
21In their model, when both factor and firm-specific cash flow components are mispriced, characteristics are proxies
considerably smaller than that of UMO loadings.22 In unreported analyses, we also find that when
we run a horse race between UMO loadings and the seven other predictors (together with the set
of standard controls), UMO loadings remain positive and significant.
In Panel B, we run Fama-MacBeth regressions using for our cross-section only firms that are
excluded from UMO for a given month. Again, we find that UMO loadings have significant power
to forecast the cross section of stock returns incremental to known return predictors. The finding
that both UMO loadings and firm characteristics contain distinct incremental power to forecast
returns is consistent with the hypothesis that UMO loadings contain information about firms’
sys-tematic mispricing and that the characteristics contain information about firm specific mispricing;
as compared with the rational factor pricing prediction that only covariances matter.
An alternative explanation for the finding that UMO loadings strongly predict returns but that
the characteristics also incrementally predict returns is that markets are efficient, that the loadings
on an underlying new issue/repurchase factor is priced, but that UMO is a poor proxy for that
factor. However, if so, then the unobserved risk factor must have a large risk premium to explain
both the high Sharpe ratio of UMO, and the incremental ability of the characteristic to predict
returns. As discussed earlier, the Sharpe ratio of UMO is about 2 1/2 times as large as that of the
market portfolio, and is considerably higher than that of HML.
The high Sharpe ratio of the market (the equity premium puzzle) is already viewed as a challenge
to rational asset pricing; MacKinlay (1995) describes the Sharpe ratio achievable with the Fama
French factors as a further challenge. UMO sharpens the challenge in two ways. First, its Sharpe
ratio exceeds those of the Fama French and momentum factors. Second, the incremental power of
the characteristics to predict returns implies that an even higher Sharpe ratio than that of UMO
can potentially be achieved by combining UMO with financing variable-based portfolios.
A different possibility is that UMO is the correct risk factor, but that loadings are estimated with
noise, causing them to predict returns imperfectly. Such noise can derive from limited sample size
or from time variation in loadings. If so, characteristics may incrementally predict returns because
they are proxies for true UMO loadings. However, the same objection applies to this explanation:
that the Sharpe ratios that are in principle achievable using UMO and the characteristics are
22In Panel A, the variables IVA and CI are statistically significant as return predictors when UMO loadings are
surprisingly high.
Section B and Table A-3 of the Addendum provides evidence suggesting that stocks with extreme
UMO loadings tend to be hard to value or to arbitrage. This may help explain why the mispricing
associated with extreme UMO loadings can persist.
5
Are UMO Loadings Stable?
Finally, we examine whether UMO loadings are fairly stable over periods of 3 to 5 years. The
presumption for a pure mispricing factor is that the loadings are unstable over the typical
fre-quency at which mispricing appears and corrects, i.e., as a stock shifts between being over- versus
underpriced. In contrast, for a rational priced factor there is no presumption that loadings will
be unstable. A common presumption for tests of rational asset pricing has been that loadings are
stable for periods of 3-5 years.
To estimate the systematic risk of stocks, it is a common practice to estimate loadings on a
fundamental risk factor (such as the market) by sorting stocks based on pre-ranking loadings that
are estimated from the previous 3 to 5 years (Fama and MacBeth (1973), Ferson and Harvey (1991),
and Fama and French (1992)). The presumption underlying this practice is that firm fundamentals
evolve gradually, so that a firm’s sensitivity to cash flow factors usually does not change dramatically
during a relatively short period of time.
Under the hypothesis that securities have fairly stable loadings on fundamental economic risks,
pre-ranking loadings should be highly positively correlated with post-ranking loadings. Thus,
sort-ing firms by pre-ranksort-ing loadsort-ings should create a large dispersion in post-ranksort-ing loadsort-ings. In
contrast, if UMO loadings reflect mispricing, they are likely to be unstable over periods as long as
five years. Therefore pre-ranking loadings should be very poor proxies for misvaluation, and should
have little power to predict post-ranking loadings. Additionally, sorting firms based on pre-ranking
loadings should create little dispersion in post-ranking loadings.
Following Fama and French (1992), we estimate UMO pre-ranking loadings (bUMOpre ) by regressing
individual stock monthly returns from the previous 36 to 60 months on UMO together with the
FF 3 factors, and sort stocks into 100 portfolios based on theirbUMOpre . Using the full sample
multi-factor regression for each portfolio. We report the averagebUMOpre and the estimated bUMOpost for
the 100 portfolios in Table VII.
Our preliminary analyses show that the average loadings on MKT and SMB are positive while
those on HML and UMO close to zero. To facilitate the comparison across different factors, we
subtract the means from the pre- and post-ranking loadings. For pre-ranking loadings, the monthly
mean loadings are used. Since the loadings are demeaned, we expect a reasonable number of
portfolios with moderate loadings to flip signs simply due to the changes in the means (or simply
random errors in estimation). Thus, we focus on the 20 extreme-loadings portfolios which include
the top and the bottom 10. The loadings of firms in these portfolios are the least likely to flip signs.
If firms have reasonably persistent sensitivity to UMO as a stable risk factor, we expect UMO
loadings to retain their signs and pre-ranking ranks during the post-formation period. In contrast,
if UMO is a mispricing factor, the extreme loadings can change rapidly, and even flip signs. Our
results support the latter prediction.
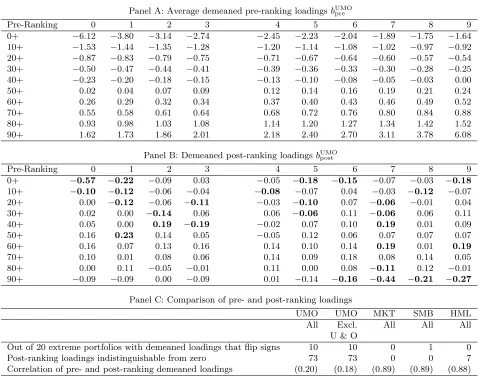
——–INSERT TABLE VII AND FIGURE 2 HERE——–
In Panel A of Table VII, we report the average demeaned pre-ranking loadings of the 100 UMO
loading portfolios and in Panel B, we report the demeaned post-ranking portfolio loadings. We
focus on the 20 extreme loading portfolios (either positive or negative) since these loadings are the
least likely to flip signs if UMO loadings are proxies for stable risk. Contrary to the hypothesis that
factor loadings are persistent for substantial periods, 10 out of the 20 extreme portfolios switch
the signs of their bUMOpre ’s in the subsequent one year, shown in Panel B and summarized in Panel
C. This finding is not driven solely by new issues or repurchase stocks; after excluding the firms
in UMO, we still observe 10 out of the 20 extreme portfolios switching signs from pre-ranking to
post-ranking periods.
These numbers are substantially greater than those associated with MKT, SMB and HML when
we use the same method to estimate market beta and loadings on SMB and HML. As reported in
Panel C, there are no MKT and HML loading portfolios and only one SMB loading portfolio among
the extreme 50 have opposite comovement with their corresponding factor before and after the
Overall, a strong majority, 73 out of 100 UMO loading portfolios have essentially zero
post-ranking loadings, suggesting that sorting stocks based onbUMOpre ’s creates little dispersion inbUMOpost ’s.
(The results are similar if we exclude firms in UMO from our analyses of loadings.) In contrast, by
applying the same method to MKT, SMB, and HML, we find that none of the market beta and
SMB loading portfolios, and only seven HML loading portfolios carry post-ranking loadings that
are insignificantly different from zero.23 These patterns are also evidenced in Figure 2, which plots
the pre- and post-ranking loadings associated with UMO and the 3 factors.
The time series average of the cross-sectional correlations between pre- and post-ranking
load-ings again indicate that UMO loadload-ings are much less persistent than those on MKT, SMB, and
HML. This correlation is between 0.88 to 0.89 for the 3 factors but merely 0.20 for UMO for
gen-eral firms and 0.18 after excluding firms in UMO.24 The substantially lower correlation in pre- and
post-ranking UMO loadings is consistent with our findings that UMO loadings tend to flip signs
and are unstable over periods of several years.
Taken together, our evidence suggests that UMO loadings shift too rapidly to be captured
by long-window estimates. This seems to be at odds with the view that firms’ fundamental and
exposure to systematic risk are persistent and evolve gradually. Thus, we conclude that the
sensi-tivities of stock returns to UMO have much lower persistence than the loadings on other proposed
fundamental risk factors in previous literature.
6
Conclusion
Behavioral approaches to asset pricing imply that there is common misvaluation across firms, and
that there is systematic comovement associated with firms that are similarly misvalued. This study
documents that, over the period 1972–2008, returns on issuing and repurchasing firms can be used
to identify commonality in returns, and provides evidence suggesting that this return commonality
derives from commonality in misvaluation.
Existing research has proposed that firms undertake equity issues in response to overpricing and
23It is possible that more pre-ranking UMO loadings are close to zero than are the pre-ranking MKT, SMB, or
HML loadings. If so, this would only reinforce the point that loadings on UMO are not stable over periods as long as five years.
24The greater the extent to which loadings capture persistent fundamental risks rather than mispriced factors, the
repurchases in response to underpricing. These financing events seem to reflect stock mispricing
perceived by managers that is not fully captured by firm characteristics such as book-to-market
equity. Building upon this literature, our evidence indicates that there is comovement in returns
associated with financing events, and that firms that engage in similar events subsequently move
together more. However, this comovement is not unique to firms that that are involved with these
transactions—it is shared by general firms that load upon our misvaluation factor.
Probably the most surprising results here are the exceptionally high Sharpe ratio of UMO and
the strong ability of UMO loadings to predict the cross section of stock returns. When UMO
competes with the 3 Fama-French factors, the momentum factor, and the leverage factor, the ex
post tangency portfolio places a much higher weight on UMO than on the other factors. When
we regress UMO on the set of benchmark factors, UMO produces consistently positive alphas
and large residual variance. This evidence confirms that, despite some critiques of the new issue
and repurchase puzzles in the literature (e.g., Brav, Geczy, and Gompers (2000), Butler, Grullon,
and Weston (2005)), new issue and repurchase events do indeed contain important information
for predicting returns. Moreover, the UMO loading is a strong predictor of the cross sectional
stock returns, with a marginal effect that is considerably greater than those of the other firm
characteristics that we consider. The fact that UMO loadings show a strong and distinct ability
to forecast the cross section of portfolio and stock returns suggests that firm external financing
activities convey information about the systematic component of stock misvaluation.
Although it is hard to rule out frictionless rational factor pricing explanations for return
pre-dictability conclusively, taken together, we view this evidence as most supportive of commonality
in misvaluation that can be identified by means of financing events. However, we do not attempt
to test possible explanations (not necessarily mutually exclusive) based upon market frictions. For
example, market frictions such as illiquidity may make it hard to realize the high Sharpe ratios