Machine Learning based Traffic Classification using Low
Level Features and Statistical Analysis
Rajesh Kumar
M.Tech Scholar
PTU Regional Center (SBBSIET) Jalandhar, India
TajinderKaur
Assistant Professor SBBSIET Padhiana Jalandhar, India
ABSTRACT
In this paper, Data mining technique is used to present the concept of attack data analysis and traffic classification. Here the system is completely a automated system that contains packet capturing, processing of multiple attack logs, labeling of network traffic based on low level features and applying the classification algorithm to build a traffic classifier which will classify the normal and malicious traffic. In this paper mixing of machine learning approach and behavior based analysis is done to valid the analysis results in a better way. Previously lot‟s of work has been done in this field to classify the network logs but all of the existing techniques such as payload based, port based classifications have their own advantages and disadvantages but classification using Machine Learning techniques is still an open field to explore and has provided an excellent results up till now. The main aim of the proposed work is to perform the passive traffic monitoring based on honeypot technology and then analyze the network attack logs to determine the intruders. We collect attack data throw honeypot system and normal user browser than we combined that attack data and develop an automated traffic classification system based on the low level features of the network traffic. This type of classification will help the IT administrators to determine the unknown attacks spreading in the IT industry.
Keywords
Network Security, Attacks, Data Mining, Honeypots, IDS
1.
INTRODUCTION
As we all know in the current modern network the size of the captured network data is growing exponentially, so there is a greater need to apply the classification algorithm to the collected data set which helps in determining the set of malicious and normal traffic. This type of classification is important for the purpose of network monitoring systems and security incidents. Later well assigned port numbers were used for the purpose of identification of network traffic. For example port 80 is used for HTTP communication and port 25 for SMTP communication. But in current fast growing internet, applications are using dynamic changed port numbers which is making the port based traffic classification a tedious job. After port based classification of network traffic, payload based inspection come into play. This classification can achieve the good accuracy once the payload can be accessed and inspected properly. In spite of good accuracy the payload based classification is having its own limitations in terms of its slowness and resource consumptions. [1] In research community, some authors proposed automatic mechanisms for derivation of payload features and proved some promising results [2], but these approaches still have their own limitations.The methodologies discussed in it depend and require large amount of memory and processing time. But if we inspectonly initial few bytes of
the payload than it requires less amount of memory and processing time.[3]
With the change in technology the size of the network data is increasing day by day, now the researchers have used machine learning techniques based on the features to classify data. [4] Machine learning based algorithmscreate the classification model by using the large data set and calculated features. Moreover, the statistical properties based features of the network traffic is also becoming important for machine learning based classifications such as packet length statistics for a network traffic flow, for example the minimum, mean, maximum, standard deviation of the packet sizes. [5] With the consideration of the Machine learning based techniques and based on these calculated features statistics, a good traffic classifier can be developed. While ML classifiers have shown good efficiency and promising accuracy, accuracy is often lower than that of payload-based classifiers (for traffic for which payload signatures exist).
1.1
The Significance of the Problem
With expand of the internet technology, data and information of any individual or organization is available, any unauthorized user can control the data and information of that individual or organization. At this place security plays vital role to protect these data and information. “A Statistical Analytical and machine learning based analysis of the security logs” this is exactly will be implemented during the course of our research area to get the internal things about the machine learning applications applied in the field of network security. We can define the security analysis as Security Analysis= Security + Data Analysis
– To find, discover and utilize techniques to analyze security data.
– Security Data Collections tools are continue to improve and quality of data increases exponentially.
– Need to apply tools and techniques to analyze the security data.
1.2
Objectives
The aim of the proposed work is to perform the passive traffic monitoring based on honeypot technology and then analyze the network attack logs to determine the intruders to build the traffic classifier for determination of malicious and normal traffic from collected data set.
During the course of this research implementation, we would perform the following things:
Automated network data capturing and logging mechanism.
Development of Data pre-processing engine to extract relevant & attack data features.
Data Analysis and classification based on “R” tool and weka.
Performance measurement and result discussions.
1.3
Scope of Proposed Work
Combination of security and analysis techniques for security analysis.
Machine learning and statistical analysis of network traffic.
It has capability to analyze activities on the host at a high level of detail
2.
BACKGROUND AND MOTIVATION
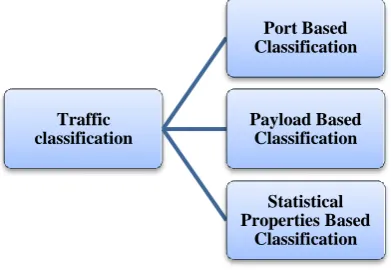
[image:2.595.70.266.324.459.2]Here we present the current state or art work in the domain of network security and applying machine learning as well as statistical computing in the field of network security. In terms of internet traffic classification, the methodologies can be divided into three main categories as shown in the below figure 1.
Figure 1: Traffic Classifications
2.1
Port based Classification
Transport Control Protocol (TCP) make communication over the internet and send or receive the data from one end to another end. TCP plays a vital role in communication. This protocol is connection oriented protocol which works on the third layer of TCP/IP stack. The most common protocol working in this layer is TCP and UDP. The concept of ports is used by these protocols to differentiate between the end points. [10]
To make a communication between two end points, most of the applications use the well known ports defined by [6] In case of UDP protocol, the concept is same as like TCP protocol without the connection establishment [11].
IANA defined the range of ports as 0 to 65535 which are divided into below three main categories:
Well Known ports (0-1023)
Registered Ports (1024-49151)
Private ports (49152-65535)
According to IANA, the well known ports are mostly used by the well known applications and which can be changed and modified by the system administrators and In case of registered ports, there is no requirement of administrator privileges.[12]
2.2
Payload based Classifications
Payload-based classification is used as Deep Packet Inspection. Payload based classification uses the signature based approach which is very reliable approach because each packet‟s content is inspected in order to generate the signatures or pattern strings [4]. As we all know that Deep Packet Inspection increases the classification accuracy but it has its own limitations because there are issues like complexity, high resources and even some protocols are encrypted which are not so easy to decipher them in [14].
2.3
Statistical Properties based
Classification
After port based and payload based classification, the new technique statistical properties based classification come into existence. This classification is able to identify the even dynamic ports used by the applications [14]. The statistical properties like flow duration, packet length, and flow ideal time are used to classify the traffic on the basis of applications. These parameters are different in each case. Also Sen. et al. [13] presented this as future work for classification for the prediction which is also able to classify the encrypted traffic.
2.4
Machine Learning Background
Machine learning is used in search engine, image screening, marketing, forecasting, medical science, text and hand writing are few among many. The input of a machine learning process is a dataset of instances or examples and output of such process is the knowledge learnt by the machine.
Z.shi in [16] described “One of the defining features of intelligence is the ability to learn.” It means study of learning new knowledge and skills while reorganizing the existing one. This type of learning contains subset of algorithms developed in the discipline of Artificial intelligence. These algorithms use different features to learn a set of rules in order to identify different classes.The machine learning is divided into two main categories as shown in the below figure 2.
Figure 2: Machine Learning
3.
IMPLEMENTATION AND DESIGN
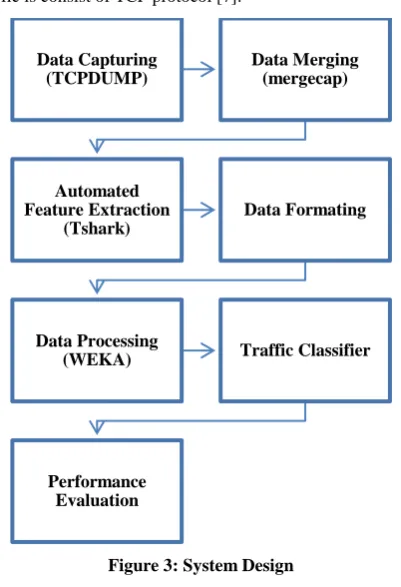
Here we discuss the design steps for machine learning based traffic classification; also we present the step by step flowchart of the implemented system. As shown in the figure 3, the various modules of the implemented system have been depicted.
3.1
Auto Data Capturing
First module is automated data capturing for network data collection and saved into a log file. We have designed a bash shell script which automatically capture the network traffic and save it into a file Captured files in hourly basis. For this purpose, there are various factors those should be considered for live data capturing such as time, aim and resources consumed. By considering these things in mind, we used the Traffic
classification
Port Based Classification
Payload Based Classification
Statistical Properties Based
Classification
Machine Learning
Supervised Learning
[image:2.595.318.554.484.602.2]live traffic capturing for some fixed durations for experimental purpose only. We also tried to build a shell script for automated removal of old data from stored logs. Tool used for this purpose is open source tcpdump; main focus of the study is on TCP traces as most of the internet traffic is consist of TCP protocol [7].
Figure 3: System Design
sudo "$TCPDUMP" -i eth2 -w
"$LOGDIR/${TCPDUMPCAPTUREFILEPREFIX}${CURR ENTDATE}${TCPDUMPCAPTUREFILESUFFIX}.log" & Small Skelton of the code for live packet capturing is shown in above lines. „Tcpdump‟ command is being executed in background. We have maintained the MAINLOGFILEMAXSIZE variable which is configurable and the function of which is automatically remove the old stored logs of the pcap files. Only recent logs are helpful for us to apply the machine learning algorithm. The main purpose of doing it is to reduce the resource consumptions as we have performed all the experiments on a normal desktop computer.
3.2
Data Merging
In data merging modules, we merge the various captured pcap files which are captured in hourly basis. The raw data files are merged into a combined single file which is further processed to make data into it in a form of some intelligent data. For the purpose of merging multiple pcap files, we have used the utility mergecap as shown in the below code:
=================================== name=$(echo $(find $1 -name ".log"))
echo $name
mergecap -a $name -w Output.pcap
====================================
Output.pcap file is the composite file by merging multiple pcap files. We performed it because we wanted to process the pcap files to extract the features, and processing of multiple
chunks of pcap files was very tedious job. Thereby we designed a bash shell script for merging of multiple raw data files into a single one.
3.3
Data Formatting
In case of machine learning or statistical analysis of data sets, we require specifying the problems very clearly and what we want to achieve, which tools require to process the data set. The aim and objective of this research study is classification of internet traffic and perform some sort of statistical analysis on the data set. For this purpose of classification of traffic, the tool selected is Wekathe most popular known open source tool available easily and readily. The ability to implement the large number of supervised and unsupervised learning algorithms make the weka tool very popular. And for the purpose of statistical analysis, we use the tool „R‟ programming language which is mostly used by the researchers.
As we know that to apply the specific algorithm on the data set, the data should be converted into required format such as „ARFF‟ or CSV format. Through weka, we can process the arff file format easily whereas R tool can also take other formats. We have converted the data into CSV format manually which can easily converted into arff format or it can used as it is in R tool.
In this module, we perform the following tasks:
Data conversion – to convert the data into required format
Data Labeling – to label the data set into classes such as malicious or normal class.3.4
Feature Extraction
This module is one of crucial modules of the research as it includes the deep analysis of collected packets. There can be multiples features of the network traffic but there is a need to select the relevant features which are applicable and correct in terms of our research. If we are talking about the network dump, there can be millions of connections in a single captured network data file which further need to be processed to extract the low level features. We have maintained the MAINLOGFILEMAXSIZE variable which is configurable and the function of which is automatically remove the old stored logs of the pcap files.
Also processing of the network dump files is required as a data file may contain the multiple attributed and statistical parameters which can be taken as features but all of them may not be relevant for classification purposes. Selection of those features which have unique properties plays a significant role for classification of data. Here for the purpose of feature selection, we have used the utility tshark which UNIX command line utility for processing of pcap files.
3.5
Data Processing
Here in this module, we preprocess the data set using weka tool. With the help of provided functionality of weka, we can select/deselect the attributes of the data set. During the phase of feature extraction, it might be required that all the selected features may not relevant; thereby we reduce or optimize the feature set of the data set.
3.6
Traffic Classifier
Here in this module, we apply the actual algorithm for traffic classification with the help of weka tool and statistical analysis with the help of R tool.
Data Capturing (TCPDUMP)
Data Merging (mergecap)
Automated Feature Extraction
(Tshark)
Data Formating
Data Processing
(WEKA) Traffic Classifier
After preprocessing of the data one single file has been produced in the format which is acceptable by the tool used for building classification model. This file contains the data which will be used to train and test the classifier.
3.7
Performance Evaluation
To test the trained classifier, we need to understand the performance measurements and metrics to measure the performances. There are various performance metrics parameters in the tool WEKA.
Performance measurements:
Accuracy:- Accuracy = number of correctly classified instances ÷ Total number of instances
Error rate if the classifier predicts the class of an instance correctly, it is counted as a success if not it is an error.
Confusion Matrix: A single prediction can have four outcomes namely True Positives (TP), True Negative (TN), False Positive (FP) and False Negative (FN).TP and TN are correct classifications where class „A‟ is predicted as „A‟ and class „B‟ is predicted as „B‟ where as FP is when class „A‟ is predicted as „B‟ and FN is when class „B‟ is predicted as „A‟.
True Positives (TP) and False Positive (FP) Rate TP rate is TP divided by the total number of positives where as FP rate is FP divided by the total number of negatives. Ideally a good performing model would have a higher TP rate and a low FP rate.
3.8
Statistical Properties based
Classification
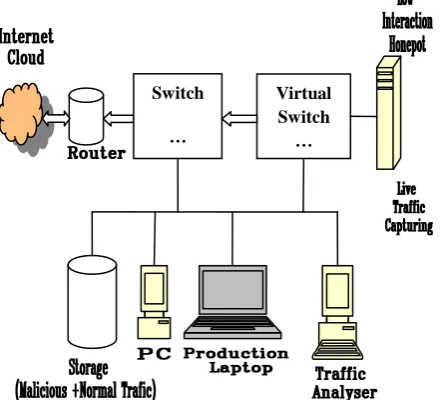
[image:4.595.59.282.522.722.2]Here we discuss the implemented network design for the research. As shown in the below architecture, most of the terminology used are self-explanatory. The low interaction honeypot, Dionaea is being implemented for the attack traffic capturing. In a similar way, the normal traffic from the production machines is being monitored and stored. Then both of the captured files known as malicious and normal files are processed for feature selection and applying the machine learning based traffic classification algorithms.
Figure 4: Network Architecture
3.9
Network Implementation
Figure 4: depict the implemented network architecture of the system. The resources and tools used during the implementation of designed network diagram are as:
3.9.1
Honeypot
Low Interaction Honeypot- Dionaea
Intel Core I7 CPU, 2.8Ghz Processor
Hard Drive- 300GB
Memory-2GB RAM
Ubuntu Linux System
3.9.2
Storage
Sqlite database or Linux file system
3.9.3
Traffic Analyzer
Normal Production machine Weka as machine learning tool
3.10
Algorithm
Below are the general steps of the implemented algorithm: 1. Start dionaea honeypot for attack data traffic collection 2. Automated packet capturing and its functioning.
Live packet capturing.
Display the captured packets through tcpdumputility.
Read the captured packets through tcpdump command.
3. Merging of multiple network pcap data into single pcap file.
See the size of individual pcap file by du command.
Merging the multiple pcap files into single one.
Size of the Output.pcap file equal to combined sizes of individual files.
4. Conversion of PCAP raw data into processed data format as CSV.
Data processing and conversion of raw pcap data into processed CSV file using the Tshark and automated shell script code.
5. Labeling of data through Tshark.
Labeling and features mentioned in the code 6. Applying classifier/Data classification to the prepared
data.
Loading data into Weka
Selection of attributes
Visualization of all attributed
Applying classification algorithm on the data set
Results discussions Switch…
Virtual Switch
3.10.1
Flow chart
Figure 5: Flow Chart
4.
EXPERIMENTAL RESULT
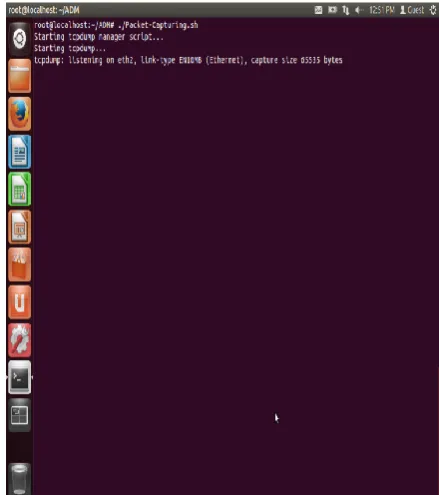
[image:5.595.54.204.68.433.2]Working flow of the implemented system- here we include the screenshot of implementation starting from packet capturing and ending with classification and performance measurements.
Figure 6: Starting packet capturing
Figure7: Packet captured files
After packet capturing, the various pcap files are merged into a single composite pcap file which is further processed for feature selection.
Working of WEKA-
1. Loading the data set into weka
Figure 8: Loading data into weka Automated
Network Data Capturing
Merging of Multiple PCAP
files
Automatic Feature Extraction
Data Labelling & ARFF Conversion
Loading Data into WEKA
Data Processing in WEKA
Classification Algorithm
Class Prediction (Malicious or
Normal)
[image:5.595.56.276.491.739.2]2. Data pre-processing
Figure 9: Data preprocessing in weka
3. Data visualizations
Figure 10: Data set visualizations
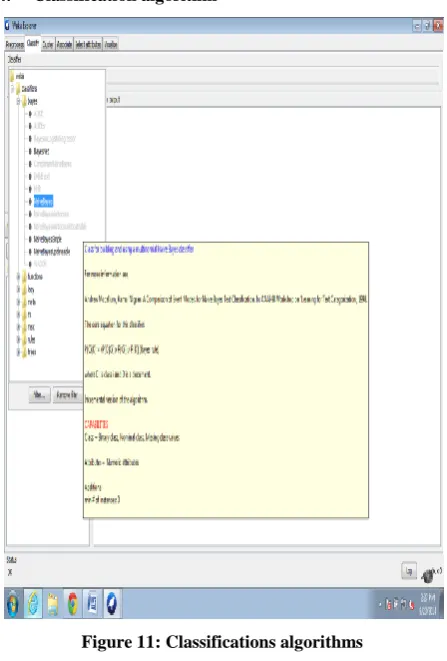
[image:6.595.317.541.80.411.2]4. Classification algorithm
Figure 11: Classifications algorithms
[image:6.595.71.402.81.750.2]5. Naïve -Bayes classifiers- results
Table 1:Classifiers results
Correctly Classified Instance
4766 66.1118% Incorrectly
classified instance
[image:6.595.55.281.83.393.2]2443 33.8882%
[image:6.595.56.278.396.747.2]As shown in the above figure, we have applied the naïve-bayes classification algorithm for classification of traffic data. Total number of instances is 7209; time taken to build the model is 0.04 seconds. Table 1 below depicts the performance evaluation of classifier. The accuracy of model can be defined as the correctly classified instances divided by the total number of instances, which is in our case 66.1118 percent. This accuracy we are getting when we apply the limited features of the traffic classification which leaves the scope of improvements by applying more and optimized features as our main objective was to build the classification mode. Performance evaluation
Table 2: Performance Evaluation
TP FP ROC
area
Precision Recall Class
0.597 0.101 0.859 0.957 0.597 Malicious 0.899 0.403 0.859 0.374 0.899 Normal ====Confusion Matrix=====
a b ---Classified as
3397 2290 | a = Malicious 153 1369 | b = Normal
The value “a” of the matrix this is first row first column gives us the number of correctly classified instances belongs to normal class, similarly “b” gives the number of correctly classified instances belongs to abnormal class. Performance of this matrix can be increased by increasing the values of first diagonal and decreasing the values in second.
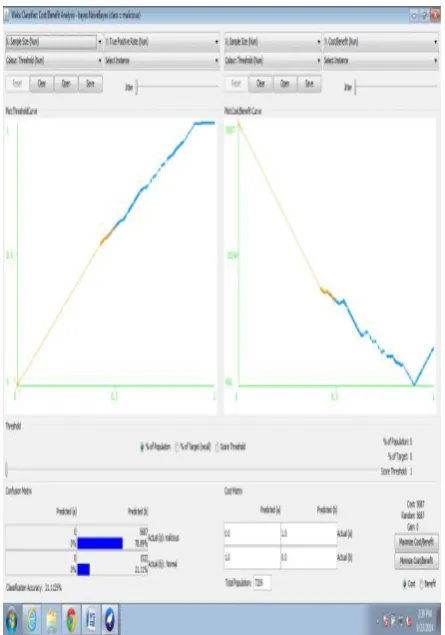
6. Cost/benefit analysis
Figure 13: RoC curve Cost/Benefit analysis
5.
CONCLUSION AND FUTURE WORK
In the modern internet world, the traffic classification is not easy, current techniques for intrusion detection have their limitations which are being explored by the network researchers. In current internet security, there is war situation between the good and bad, in order to meet the basic security paradigm on internet traffic; these issues should be dealt with serious intensions. In the recent years, the field of machine learning has shown significant results which can be used to defend the cyber crime. Here in this research implementation, we propose “Machine Learning Based Traffic Classification using Low Level Features and Statistical Analysis” which indicates the implementation of suitable machine learning algorithm in the field of network security. We presented some literature and background study to finalize the problem statement. During the implementation, we designed a system which is include the various modules such as packet capturing through low interaction honeypots, data processing, feature extraction, data labeling and classifier. Each modules of the system has their own significance and need. The developed system further evaluated by taking the real world data set by setting up the low interaction honeypot. We also presented the network architecture of the implementation. The data set taken for building the classifier we have taken the attack traffic from honeypots whereas normal traffic from normal production machines.
In future to extend the research to incorporate the traffic related to all the protocols by capturing internet traffic on large networks for longer durations. Data set as one of important entity in the field of data mining for classification, by creating the state of the art dataset, more complex algorithm can be applied. Basic research of which indicate the importance of data mining in network security was shown here which can be further extended for more complex algorithms and statistical mining. We also propose to make the system as real time classifier that will perform the real time classifications of the internet traffic.
6.
ACKNOWLEDGMENTS
I would like to sincerely thank Er.TajinderKaur (Assistant Professor) for her contribution and help in writing this paper.
7.
REFERENCES
[1] P. Haffner, S. Sen., O. Spatscheck, and D. Wang, “ACAS: Automated Construction of Application Signatures,” in ACM SIGCOMM MineNet Workshop, (Philadelphia, PA, USA: ACM), Aug. 2005.
[2] J. Ma, K. Levchenko, C. Kreibich, S. Savage, G. M. Voelker, “Unexpected Means of Protocol Inference,” in 6th ACM SIGCOMM Conference on Internet Measurement (IMC), pp. 313–326, 2006.
[3] A. Finamore, M. Mellia, M. Meo, and D. Rossi, “KISS: Stochastic Packet Inspection Classifier for UDP Traffic,” IEEE/ACM Transactions on Networking, vol. 18, pp. 1505–1515, Oct. 2010.
[4] T. T. T. Nguyen and G. Armitage, “A Survey of Techniques for Internet Traffic Classification using Machine Learning,” IEEE Communications Surveys & Tutorials, vol. 10, no. 4, pp. 56–76, 2008.
[image:7.595.56.279.427.745.2]Transactions on Networking, vol. 20, no. 6, pp. 1880– 1894, 2012.
[6] http://www.iana.org/assignments/service-names-port-numbers/service-names-portnumbers. Xml accessed on 4/04/13.
[7] Nguyen, T.T.T.; Armitage, G., "A survey of techniques for internet traffic classification using machine learning," Communications Surveys & Tutorials, IEEE , vol.10, no.4, pp.56,76, Fourth Quarter 2008doi: 10.1109/SURV.2008.080406
[8] http://www.ncftp.com/ncftpd/doc/misc/ephemeral_ports. html accessed on 04/04/13.
[9] M. Roughan, S. Sen., O. Spats check and N. Duffield“lass-of-service mapping for QoS: A statistical signature-based approach to IP traffic classification”Proc. ACM/SIGCOMM Internet Measurement Conference (IMC) 2004, 2004.
[10] CoralReef.http://www.caida.org/tools/measurement/coral reef accessed on 04/04/13.
[11] A. Moore and K.Papagiannaki. “Toward the accurate identification of network applications”Proc. Passive and Active Measurement Workshop (PAM2005), 2005. [12] A. Madhukar and C. Williamson“A longitudinal study of
P2P traffic classification”14th
IEEE International Symposium on Modeling, Analysis, and Simulation of Computer andTelecommunication Systems, 2006. [13] S. Sen., O. Spatscheck and D. Wang“Accurate, scalable
in network identification of P2P traffic using application signatures”WWW2004, 2004.
[14] Callado, A.; Kamienski, C.; Szabo, G.; Gero, B.; Kelner, J.; Fernandes, S.; Sadok, D., "A Survey on Internet Traffic Identification," Communications Surveys & Tutorials, IEEE , vol.11, no.3, pp.37,52, 3rd Quarter 2009.
[15] OrialMula-Valls “A practical retraining mechanism for network traffic classification in operational environments” June 2011.