http://dx.doi.org/10.4236/jsea.2014.72010
Enhancing Software Process Management through Control
Charts
Vipul Vashisht
Quality Department, Polaris Financial Technology Limited, Gurgaon, India. Email:[email protected]
Received December 14th, 2013; revised January 10th, 2014; accepted January 18th, 2014
Copyright © 2014 Vipul Vashisht. This is an open access article distributed under the Creative Commons Attribution License, which permits unrestricted use, distribution, and reproduction in any medium, provided the original work is properly cited. In accordance of the Creative Commons Attribution License all Copyrights © 2014 are reserved for SCIRP and the owner of the intellectual property Vipul Vashisht. All Copyright © 2014 are guarded by law and by SCIRP as a guardian.
ABSTRACT
In software development life cycle, Software Process Management (SPM) acts as a significant part throughout the execution of project. In this study, the application of control chart for analyzing the stability of software process and defects in the software product is discussed. This paper will discuss the analyzing impact or collision of rework effort, defect density, inspection performance and productivity by using control charts. This paper also explains the benefits and challenges of using control charts in software organization.
KEYWORDS
Software Process Management; Control Charts; Cost of Rework
1. Introduction to Software Process
Management
With the increasing interest in predictability and effec- tiveness of software development practices, SPM (Soft- ware Process Management) has become a crucial aspect in the Software Engineering field. The effectiveness of software development process depends upon how well software process model is aligned. In order to carry out effective data based on decision making, it is highly es-sential that the software process model is managed and analyzed accurately. Developing concern in evolving efficient approaches to SPM has led to focusing on soft-ware process modeling such as formal analysis and fine grained modeling. Recently, different formal processes of software process modeling approaches are to be in-troduced and entirely depend upon Petri net [1].
According to Khan [2] the software process manage- ment is used to make rational and reasonable decisions and some methods applied for systematic analysis of process execution and relative factors of environment are essential. Though, many formal approaches are primarily concentrated on the techniques of process modeling rather the techniques of software process management. These techniques of formal analysis are targeted mainly
to configure proper model mathematically. The techniques of formal analysis offer major ways to develop software process management and their maturity with suitable soft- ware process model. But, simply setting up with better software process model does not essentially make sure the efficiency in the actual process actions.
In this paper, the author have tried to highlight the role of control charts in SPM, analysis of process parameters like rework, productivity, defect density using control charts. The paper also discusses the challenges faced by software organizations in using the control charts fol- lowed by the conclusion and future work.
2. Role of Control Charts in Software
Process Management
ware process improvement models suggest control charts are applied in the project level process control and or- ganizational level process for the improvement purposes. It has also increased focus on sub process monitoring and probabilistic prediction models in CMMI certified or- ganizations. As per CMMI processes, sub process moni- toring and defect prediction model (DPM) implementa- tion is mandatory under the areas of Quantitative Man- agement process.
The sub process is a subset of process, but it represents as a significant and an independent set of activities that can be controlled. In a software development life cycle, if construction is the process the following are the sub processes
1) Program Spec preparation 2) Program Spec Review 3) Unit Test Plan preparations 4) Unit Test Plan review 5) Coding
6) Code review 7) Unit testing
8) Independent Unit Testing/Peer Testing
Throughout the project duration, execute various processes are executed. However, many sub processes that make or break the project success. These sub processes are directly connected to the organization business objec- tives/customer requirements.
The important common tools are mainly used in Con- trol Charts. It operates on the statistical rules of Central Tendency and Dispersion. Central Tendency implies lo- cation of mid-point in a group of values. e.g. Average or Mean denoted by X.
• Dispersion implies spread around mean or distance between values. e.g. Range, Standard Deviation.
• Any process has variation. The control chart consists of two kinds of variation.
• Variation occurred by normal process operation is known as Common Cause.
• Variation occurred by sudden and abnormal changes are known as Special Cause.
Common cause variation is almost random but occurred between predictable bounds that denotes a stable process. Special cause variation indicates unstable process that is no longer predictable.
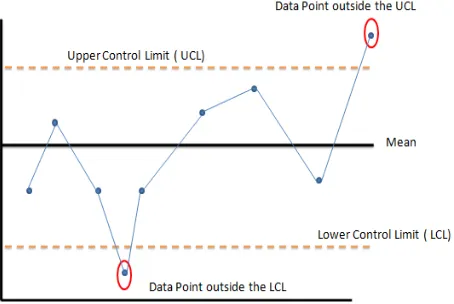
All classical control charts includes a centerline and control limits on both sides of the centerline. The center-line is usually the average of the set of values. The two control limits such as (Upper Control Limit (UCL) and Lower Control Limit (LCL)) are contained the value of +/− 3 sigma; where sigma denotes the standard deviation (denoting distance from the centre point). 3-sigma limits result in very few false alarms and that point indicates outside the limits are highly possible in special causes.
[image:2.595.311.538.566.718.2]Card [7] has mentioned that control charts are re-garded as statistical data analysis refined tools that in- volve lower and upper restrictions to find variations. These charts are most commonly used in statistical proc- ess control analysis. A control chart is used to control and assess the variability of product or processes charac- teristics. Generally, preparing a control chart involves setting up the upper and lower control limits of data dif- ferences from the average value of a data set. If an ex- amined data value lies outside the control limits then it would trigger the analysis. The usage of SPC and control charts may help to diminish and develop the differences in the implementation of a defined software process. Figure 1shows the sample control chart:
The characteristic reasonable lower and upper bounds may be set up distinctly. Sometimes they may reflect the expectations of customers. On the other hand, the bounds may be based on the experiences of past software man- agement process. From the average value the standard deviation may be used as these limits. For example, if one SD (Standard Deviation) is used as the lower and upper control limits then in an examination that falls out- side of these limits can be produced for possible alarm and attention. In software project management, the idea of a control chart along with the use of SD as the lower and upper limit may be used to examine and track a par- ticular characteristic of a methodology or a product. The usability characteristic may be examined through usabil- ity testing in case of a product [8].
Florac and Carleton [9] have described that to make use of control charts for the software processes, then the statistical process control must be identified first. The features that can be studied for the result of this process involves delivering defect density, productivity, perfor- mance review and rework effort among others. To con- trol charts, the major focus is an advantageous statistical process control guidelines and tools are offered for the improvement of process, process management and mea-
surement within the software field.
The most frequently used chart for separate data is the XmR chart. XmR charts are specially used if little is known about the underlying distribution or if the justifi- cation for assuming a binomial or poisson process is relatively questionable. XmR chart can be used to mo- nitor turn around time across production problems or coding effort across units examples include the u-chart for Poisson data and the p-chart for binomial data.
3. Analyzing Rework Effect Using Control
Chart
Lantzy [10] has mentioned that rework is referred as the complete hours invested that was affected by unplanned mistakes or changes. Some of the modifications may be extra demands of customers, which are considered as developments. Classifying these rework as developments or not depends on the target of estimating the effort of rework. The rework effort is a good indicator for the quality of software process as it reveals an importance of effort the researcher invests suitable to former mistakes and doing things “First time Right”. Rework enhances the costs of software project and does not add any value to the project. Any project that is completed successfully for the first time requires no rework. Rework effort therefore stands as one of the major factors behind cost incurred by an organization owing to poor quality of de-veloped software. Cost of Poor Quality (COPQ) is a soft-ware quality metric used in determining the cost incurred on poorly delivered software. Rework effort is one of the factors of internal failures that result in the increase of COPQ [11] Houston [12] classifies the costs of software quality into two cost groups’ of achieving quality and costs since lack of quality. Rework acts as leading role in the second group. Rework shows the influence of defects directly next to their amount or cost as its focus on the value of effort. As a result, defect counts and the effect of reworks considered as a supplementary evaluations for analyzing the products of software and process quality. An operational definition of the percentage of rework can be defined as:
(
) (
)
Percentage of rework= Effort of rework Total effort
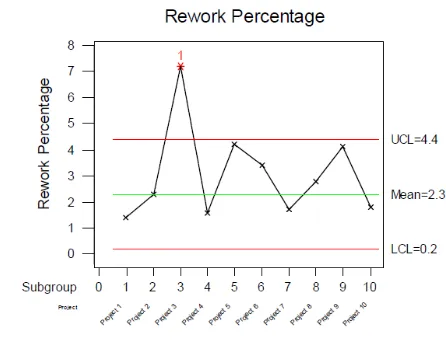
Conradi etal. [13] has mentioned that the percentage of rework gives the understanding about an associating cost or amount of rework with regard to complete effort. Cost of rework in a software environment could be cost incurred in fixing defects under warranty or fixing user acceptance testing defects. A sample individual chart is shown in Figure 2.
In Figure 2 the points that lie above the UCL reveal examples in which several defects identified per unit
[image:3.595.315.538.99.269.2]Source: Houston, 1999.
Figure 2. Sample individuals control chart for a percentage of rework.
effort overrun the process of performance limits. It might be owing to low quality of product or highly effective- ness on the inspection process. At the same time, the points that lie below the LCL represent small process of inspection in which numerous defects on products remain undetected or greater quality in product where the prod- uct has really negligible amount of defects. In both these cases, the defect density measures are used to gaining a proper understanding during interpretation of the results [14].
4. Analyzing Productivity Using Control
Chart
activities and also to predict deficiencies in software processes. The productivity element or factor conside- ration is the most important for high management sin- ce greater productivity gets lesser prices, develops chan- ces for gains and develops rivalry forces in the market. Figure 3 shows the individual control chart for produc- tivity.
In Figure 3, the data points that surpass upper con- trol limit that represent an efficient study or a quick pro- cess of analysis. Similarly, less productivity measure may represent an ineffective analysis of need or a very brief, complex, or meticulous study. If the documents of software are ordered timely in graphs, a developing or re- ducing tendency can be identified on the other side. The researcher is capable to view the influence of any devel- opment studies. After predicting the outliers future ana- lysis should be essential to invent the deviation effects and obtain appropriate significant measures [16].
5. Analyzing Defect Density Using Control
Chart
According to Radice [17] Defect Density is referred as many defects as per size of the product. The defect den- sity formula can be defined as:
(
) (
)
Defect density= # of defects size of the product
The metric data interpretation and analysis depends on consideration that on an average researchers have par- ticular expectancy of defect count for each unit of soft- ware artifact that is being inspected. The measure of iden- tifying most of the anticipated defects during the soft- ware inspection process stands as an indicator for exhib- iting the effectiveness of the process of inspection. For these reason, it describe about these impacts is that statis- tical process control needs rational data sampling. If a
[image:4.595.59.290.531.699.2]Source: Jakolte and Saxena, 2002.
Figure 3. Sample individuals of control chart for productiv-ity.
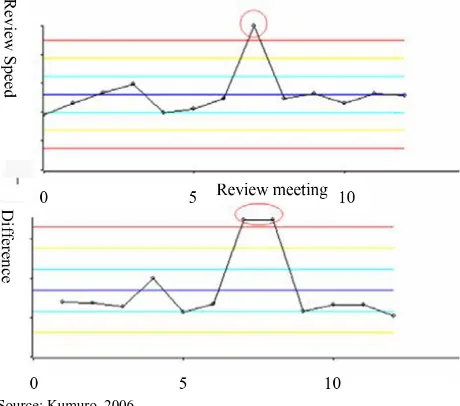
sample of data has varied distributions, the difference will be increased and the control chart sensitivity will be reduced greatly. A study conducted by Kumuro [18], re- veals an example of the impact of review speed on the quality of the review process. The below graph shows the XmR chart plotted with values of review speed of a spe- cific document review. One review is detected and its values are encircled inFigure 4.
Figure 5 illustrates Z chart representing values of De- fect density plotted for the above depicted review data:
This value is actually not a mistake but relatively small when compare to the values adjacent to it. Thus it can be inferred that this review was organized too rapidly and there may exist huge defects in documents to be re- viewed. Viewing into the review record it turned out that critics attempted to inspect many documents about 3 times bigger than mean. Therefore, the suitable activities were to re-inspect document after categorize into more than 3 parts. Repeating again, this type of analysis can enhance stabilization of the process of peer review [19]. The above example makes it clear how control charts are useful in identifying defect density.
6. Benefits to Software Organizations in
Applying Control Charts for Managing
Software Processes
According to Carleton [20] Statistical process control is a strong component to optimize the quantity of data requi- red for utilization in making determinations of manage-ment. Statistical techniques offer a comprehension of ba- seline of business, insights of process improvements, vi- sible and active involvement and value communication and process results. Likewise, Florac etal. [21] has pointed
Source: Kumuro, 2006.
Source: Kumuro, 2006.
Figure 5. Defect density Z chart.
out that SPC offers real time identification to set up base-lines of controllable method, set study and develop capa-bilities of dynamical process and concentrate on business fields requiring software development process. As per argument from Kim [22], SPC moves far away from de-cision making As a result, the software organizations cannot instantly realizes the advantages of these statisti-cal process control techniques. Weller [23] has men-tioned that statistical process control needs well formu-lated procedures. It requires a high level of commitment from management and an organizational climate where people are not offended when problems arise. Above all, SPC requires a discipline of strictly following the formu-lated procedures. Many software organizations that have implemented control charts for implementing software process control in the software life cycle development process have been greatly benefited from them. The cli-ent base of statistical process control ranges from startups of small technology, whose core business is software development to big IT firms that leverage development of software to develop operational performance and business systems. Control charts pave a way for continu-ous process improvement, reduce cost, minimize or re-duce defects, improve productivity and finally improve the total quality of the end deliverable.
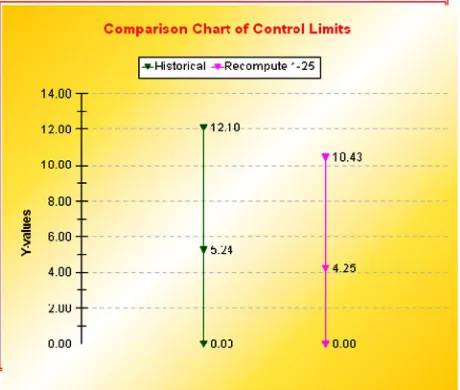
Usage of control charts can lead to reduction in the control limits causing process improvements. It has been observed that rigorous monitoring of control charts plot-ted for process parameters like defect density and taking timely corrective and preventive actions would lead to process improvements. For example—if there is a data point outside the control limits for higher defect count in a module showed as a spike in control chart, timely ac-tion taken to remove the root cause will eliminate the similar pattern in further data points. Such data points are known as special causes of variation. Figure 6 depicts a sample comparison where current control limits have come down from the historical limits showing process improvements. There are other cases which are inherent in process known as common causes of variation. Com-
Figure 6. Samplecomparison chart of control limits.
mon causes are depicted as patterns of data points within LCL and UCL and are addressed through Normality rules.
It can be thus clearly understood thus that statistical process control has found a prime position in the IT sec-tor too, offering multiple benefits in improving the over-all quality of the software process.
7. Challenges Encountered by Software
Organizations in Applying Control Charts
for Managing Software Processes
Jones [24] has pointed out that monitoring the stability of software process in small organizations is a challenging problem for the software engineers. The software com-panies trust the quality of product merely as much as the production quantity. Cngussu etal. [25] has pointed that to make sure a higher quality level is maintained, soft-ware firms must be determined to formulate a quality policy that is dedicated to complete satisfaction of cus-tomers. The policy may include regular reliability and quality developments with every employee playing an essential role.
[image:5.595.310.540.85.280.2]are not supported with software tool; 4) statistical process control is not built into the process of manufacturing; 5) experienced operators are endangered by new processes that may replace them; 6) manufacturing and quality are not on similar page with SPC; and 7) the success of SPC is not reported with transparency.
8. Conclusions
Authors have implemented the control charts for moni-toring multiple process parameters like defect density during unit testing, code review, system testing. The re-sults of implementation in more than 40 projects were studied. C charts were used to monitor defect density during unit testing, code review, and system testing while XMR charts were used to monitor actual effort during the same phases. Just in time data analysis was performed by team where the defect density and effort were analyzed using the control limits set from the historical limits ar-rived from organization baseline of similar projects. The results were quite encouraging and there were lots of benefits achieved through the analysis. Control charts helped in performing the timely analysis for data points for special causes of variation and data points that follow a specific pattern. The team can take timely corrective and preventive actions to ensure that the similar defects/ issues are prevented from occurring in later phases of SDLC.
Application of statistical process control (SPC) in software industries, a decade ago had been a challenging task for researchers and software engineers. Every soft-ware metric had specific complexities and characteristics regarding its collection, definition and explanation. De-spite these challenges, our interpretation suggests that researchers in the past and at present have proven that the application of SPC techniques via control charts has sev-eral positive effects that include reduction in cost, mini-mization of defects and error rates, improvement of the software quality end deliverable, thereby improving the overall profitability of the software organization. Align-ment with goals of a business forms the key to a suc-cessful software process improvement. Statistical process control can help in indicating the direction to which a software process must be improved for better results.
However, it may be recommended that not all major software process should be using control charts for proc-ess measurements. Other useful statistical techniques, such as confidence intervals and prediction modeling could be better measurement tool in certain situations. Projects that are short duration, having small teams, and low business criticality may not be the best candidates for SPC monitoring using control charts. In such situa-tions, this could result in process overhead for the project
team and the overall morale of team could come down. SPC monitoring using control charts should be the best used in monitoring the most critical quality processes. These processes could vary from project to project de-pending upon scope and business goals. The decision to use control part for SPC should be taken into considera-tion the duraconsidera-tion of project, the size of the team, avail-ability of data and criticality of the process parameter that is to be measured. The training of the team on using the control charts and their analysis is the key to success of this initiative.
With the advent of several automated statistical process control software tools, applying SPC through control charts has become a much easier process to all software organizations of today. Therefore, it can be concluded that control charts are really helpful in software organi-zations by adding the value of quality at the end deliver-ables, and also deliver to their clients.
9. Future Work
The analysis can be performed in start up or a small or-ganization to understand whether the SPC can still pro-duce beneficial outcomes. Also, domains such as ERP Implementation can be studied for possible usage and benefits of control charts.
REFERENCES
[1] W. Laurie, “Lecture Notes on Software Process Impro- vement,” Software Engineering Institute, 1993, Paper 191.
[2] A. K. Khan, “Amalgamation of Personal Software Proc-ess in Software Development Practice,” Star Journal, 2012.
[3] M. C. Paulk, B. Curtis, M. B. Chrissis and C. V. Weber, “Capability Maturity Model for Software,” Version 1.1 (CMU/SEI-93-TR-024, ADA 263403), Software Engi-neering Institute, Carnegie Mellon University, Pittsburgh, 1993.
[4] CMMI Product Team, “CMMISM for Systems Engi-neering, Software EngiEngi-neering, and Integrated Product and Process Development (CMMISE/SW/IPPD, V1.1), Continuous Representation,” Carnegie Mellon University, 2001.
[5] Information Technology, Software Process Assessment, Part 4: Guide to Performing Assessments (ISO/IEC 15504-4:1998(E)).
[6] “ISO/IEC TR 15504-5 Information Technology, Software Process Assessment,” 1998.
[7] D. Card, “Statistical Process Control for Software?” IEEE
Software, Vol. 11, No. 3, 1994, pp. 95-97.
http://dx.doi.org/10.1109/52.281722
[8] C. Ho and K. E. Case, “Economic Design of Control Charts: A Literature Review for 1981-1991,” Journal of
[9] J. W. A. Florac and A. D. Carleton, “Measuring the Soft- ware Process: Statistical Process Control for Software Process Improvement,” Addison-Wesley, 1999.
[10] M. A. Lantzy, “Application of Statistical Process Control to Software Processes,” WADAS ’92, Proceedings of the Ninth Washington Ada Symposium on Empowering
Soft-ware Users and Developers, 1992, pp. 113-123.
http://dx.doi.org/10.1145/257683.257717
[11] EU, “Quantifying Quality Costs and the Cost of Poor Quality in Translation: Quality Efforts and the Conse- quences of Poor Quality in European Commission’s Di- rectorate,” 2012.
[12] D. Houston, “Cost of Software Quality: Justifying Soft- ware Process Improvement to Managers,” Software Qual-
ity Professional, Vol. 1, No. 4, 1999, pp. 8-16.
[13] R. Conradi, C. Fernström and A. Fuggetta, “A Conceptual Framework for Evolving Software Processes,” ACM
SIGSOFT Software Engineering Notes, Vol. 18, No. 4,
1993, pp. 26-35.
http://dx.doi.org/10.1145/163626.163631
[14] M. Komuro, K. Otokozawa and Y. Kimura, “Improve- ment of Peer Review Process based on Quantitative Ef-fect Analysis of Actual Performance of Projects,” SEC
Journal, Vol. 1, No. 4, 2005, pp. 6-15.
[15] P. Jakolte and A. Saxena, “Optimum Control Limits for Employing Statistical Process Control in Software Proc- ess,” IEEE Transactions on Software Engineering, Vol. 28, No. 12, 2002, pp. 1126-1134.
[16] J. Romine, “Using Statistical Techniques to Manage Soft- ware Projects with Data,” SEPG 2002 Conference, 18-21 February 2002.
[17] R. Radice, “Statistical Process Control for Software Pro-jects,” 10th Software Engineering Process Group
Con-ference, Chicago, 1998.
[18] M. Kumuro, “Experiences of Applying SPC Techniques to Software Development Processes,” Shanghai, 20-28 May 2006, pp. 574-584.
[19] P. Jalote, “Software Project Management in Practice,” Addison-Wesley, 2002.
[20] A. Carleton, “Statistical Process Control for Software (Software Technology Review),” Carnegie Mellon Uni-versity, 2001.
[21] A. W. Florac, A. D. Carleton and J. R. Barnard, “Statisti-cal Process Control: Analyzing a Space Shuttle Onboard Software Process,” IEEE Software, Vol. 17, No. 4, 2000, pp. 7-106.
[22] E. Weller, “Practical Applications of Statistical Process Control,” IEEE Software, Vol. 17, No. 3, 2000, pp. 48-55. http://dx.doi.org/10.1109/52.896249
[23] S. B. Kim, “Integration of Data Mining Algorithms and Statistical Process Control,” Seoul National University, Seoul, 2009.
[24] C. Jones, “Software Assessments, Benchmarks, and Best Practices,” Addison Wesley Longman Inc., 2000.
[25] J. W. Cngussu, R. A. DeCarlo and A. P. Mathur, “Moni-toring the Software Test Process Using Statistical Process Control: A Logarithmic Approach,” Proceedings of the
9th European Software Engineering Conference, 2003,
pp. 253-265.
[26] D. Caivano, “Continuous Software Improvement through Statistical Process Control,” Proceedings of the 9th Euro-
pean Conference on Maintenance and Reengineering,
2005, pp. 288-293.