http://dx.doi.org/10.4236/jtts.2014.41003
An Investigation on Safety Performance Assessment of
Close-Following Behavior of Heavy Vehicle Using
Empirical-Simulation Technique
Mohamed Rehan Karim1*, Ahmad Saifizul1, Hideo Yamanaka2, Airul Sharizli1, Rahizar Ramli1
1
Center for Transportation Research, Faculty of Engineering, University of Malaya, Kuala Lumpur, Malaysia
2
Department of Civil and Environmental Engineering, The University of Tokushima, Tokushima, Japan
Email: *[email protected]
Received October 19, 2013; revised November 22; 2013; accepted December 17, 2013
Copyright © 2014 Mohamed Rehan Karim et al. This is an open access article distributed under the Creative Commons Attribution License, which permits unrestricted use, distribution, and reproduction in any medium, provided the original work is properly cited. In accordance of the Creative Commons Attribution License all Copyrights © 2014 are reserved for SCIRP and the owner of the intellectual property Mohamed Rehan Karim et al. All Copyright © 2014 are guarded by law and by SCIRP as a guardian.
ABSTRACT
One of the main causes of rear-end crashes is attributed to close-following and hazardous driving behavior. A study was conducted to investigate the close-following behavior of heavy vehicle under various heavy vehicle categories, travel speeds and gross vehicle weights (GVW). Investigation is based on data obtained from simula-tion and empirical observasimula-tions. A safety performance assessment of close-following behavior of heavy vehicles by using empirical-simulation technique is proposed. The simulation, which incorporates vehicle dynamics, is to generate the minimum safe time gap (MSTG) for truck-following-car situations. MSTG is defined as the mini-mum time required by the following vehicle to decelerate and stop without hitting the leading vehicle when both leading and following vehicles apply the emergency brakes. Based on comparison between the actual time gap data and the MSTG, a safety performance assessment technique that considers vehicle type, vehicle braking characteristics, truck GVW and speed is proposed for truck-following-car situation.
KEYWORDS
Road Safety; Vehicle Overloading; Safety Indicator; Close-Following; Traffic Accidents; Weigh-in-Motion
1. Introduction
Close-following has been identified as one of the main causes of road crashes and associated with a large number of rear-end crashes and hazardous driving risks. Knipling
et al. [1] stated that the main causal factors of rear-end collision were inattention and following too closely. Study by Michael et al. [2] also stated that 28.3% of rear-end collisions in Tennesse in 1997 were because of close following. There are many other studies that provide em- pirical evidence to support the connection between short headway and rear-end collisions [3-5].
Time gap is defined as the time that elapses between the rear of the lead vehicle and the front of the following
vehicle. It is important to distinguish time gap from headway, which refers to time separation between the fronts of two successive vehicles passing a point. Time headway consists of the time gap and passage time, which is, the time taken for lead vehicle to pass a point. Because passage time inversely varies with speed [6] and greatly depends on the length of vehicles, the characte-ristics of headways and time gaps are dissimilar. It is very crucial for drivers to keep a safe following time gap in order to prevent a rear-end collision with the vehicle in front. The time gap should be sufficient for the reaction time and stopping time.
With the increase of in-vehicle electronic gadget for information and entertainment, the risk of rear-end colli-sions may increase in the near future. Young and Salmon
[7] stated that driver distraction may contribute to errors through a range of means: by affecting cognitive processes such as perception, planning, decision making, and situation awareness, as well as by interfering with vehicle control tasks. Therefore, distractions such as glance to the other side, making phone calls, playing with electronic gadgets and searching for directions should be avoided as it may cause delay in response time and in-crease the risk of a collision. In addition, a case study found that there was also the effect of behavior compen-sation: drivers start to take more risks (e.g. higher speeds, shorter distance headways, etc.) because they feel safer in a car with certain safety features [8]. As a result, the advanced safety features may not necessarily be able to protect drivers from involving in crashes.
Theoretically, higher travelling speed requires longer time gap. Piao and McDonald [9] revealed more variabil-ity of distance gap between vehicles in high speed situa-tions than in low speed situasitua-tions. However, heavy ve-hicles (HVs) usually require larger time gap compared to other types of road users. According to Manitoba Public Insurance [10], the stopping time for trucks using air brake systems consists of one additional variable that is brake lag. Brake lag refers to the time that air takes to travel through a properly maintained air brake system, approximately 4/10 of a second. Dey and Chandra [11] also revealed the maximum desired time gap for tractors in relation to the characteristics of the HVs, such as per-formance, braking and acceleration capability. Therefore, as mentioned by Sayer et al. [12], depending on its size and weight, the existence of HVs in a traffic stream will definitely cause a significant difference in the vehicle following behavior.
As mentioned by Bixel et al. [13], vehicle weight is one of the essential parameters in vehicle design study that can affect vehicle driving, braking and handling
performance characteristics. Furthermore, most of the time vehicle dynamics influence driver behavior in con-trolling their vehicles [14]. The study by Saifizul et al.
[15,16] has obviously shown that heavy vehicle GVW has direct influence on speed, whether the vehicle travel in a vehicle following situation or in free flow condition. Among four main vehicle following pairs (car follows car, car follows truck, truck follows truck, and truck fol-lows car), trucks following passenger car require much more attention on two-lane single carriage roads. Since the extent of vehicle overloading in Malaysia is more alarming in the 2-axle, 3-axle and 4-axle trucks category [17], the focus in this study is on the situation of these trucks following passenger car. This case requires higher level of concern since the car and truck have a huge dif-ference in dynamics capability. The consequences from a collision would be more severe for the car no matter which party is at fault.
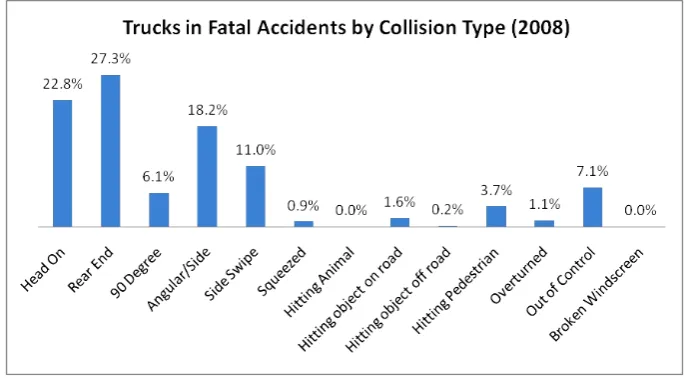
[image:2.595.126.472.529.718.2]Close-following behavior in a traffic stream may be of serious concern when heavy vehicles are involved. Ac-cident data have shown that a significant proportion of fatal accidents involving trucks and buses in Malaysia are the rear-end collision type (see Figures 1 and 2). As so, the objective of this study is to investigate the safety performance of truck-following-car under various truck types, GVWs and travel speeds. The study focuses on two aspects, namely, the frequency of unsafe behavior and the degree of the unsafe behavior of the truck-fol- lowing-car situation on specific road segments. This can be achieved by comparing the empirical time gap data to the minimum safe time gap (MSTG) required for a truck of a certain GVW travelling at a particular speed in a truck-following-car situation. The concept of MSTG will be further explained in the next section. Based on this approach, a possible safety performance assessment technique is proposed.
Figure 2. Buses in fatal accidents by collision type (2008).
2. Proposed Empirical-Simulation Safety
Performance Assessment Technique
The proposed safety performance assessment technique is introduced to investigate the safety performance in vehicle following situation. The main vehicle parameters which have not been explicitly considered in previous safety indices, namely the gross vehicle weight (GVW) and vehicle braking performance will be included in the analysis and development of the safety performance as-sessment technique.
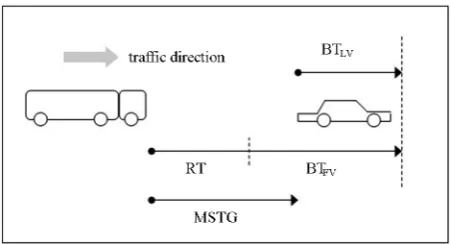
Keeping a safe following distance from the front ve- hicle is critical for mitigating rear-end crashes in truck- following-car situation since it allows the truck sufficient time to stop, and to stop gradually. Thus, in this paper the concept of minimum safe time gap (MSTG) is introduced. The MSTG is defined as the minimum time required by the following vehicle to decelerate and safely stop with-out hitting the leading vehicle when both leading and following vehicles apply the emergency brakes due to unforeseen circumstances.
The value of MSTG (as illustrated in Figure 3) is ob-tained by considering the braking time of the following truck (BTFV) and the leading car (BTLV) as well as the
perception-reaction time of the truck driver (RT). Both the braking time of the following truck and leading car are generated from simulation using the MSC ADAMS software which incorporates vehicle characteristics in-cluding vehicle type and braking performance. As such, the MSTG considers both the truck drivers characteristics as well as the truck characteristics (such as truck type, braking performance, GVW and speed). Changes in truck characteristics, say for example the truck GVW, will affect the truck braking performance and its ability to safely stop in an emergency situation, hence affecting the BTFV and MSTG. Similarly, the truck driver’s physical
and mental condition will affect the perception-reaction
Figure 3. Concept of mean safe time gap (MSTG).
time (RT), hence affecting the MSTG.
The MSTG incorporating GVW and travel speed of trucks following passenger car can be expressed as fol-lows:
FV LV
MSTG=BT −BT +RT (1)
where,
RT is truck driver’s reaction time (1.5 seconds will be adopted),
BTFV and BTLV are braking time of following truck
and leading car, respectively.
Actual time gap data for truck-following-car is ob-tained through empirical study on specific locations along a road network. The empirical time gap data for various following truck type, GVW and speed will be analysed for the purpose of comparison with the respec-tive MSTG data.
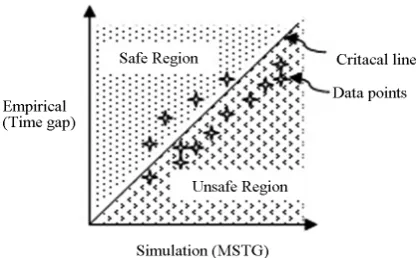
In the interest of measuring safety performance related to close following behavior in a selected traffic stream, the concept of safe vehicle-following behavior (actual time gap is more than MSTG) and unsafe vehicle-beha- vior (actual time gap is less than MSTG) may be explain- ed through the sketch of the empirical-simulation plot shown in Figure 4.
[image:3.595.311.537.291.413.2]Figure 4.Sketch of empirical-simulation plot for time gap and MSTG.
ing-car situation is based on the comparison between the numbers of cases where the actual time gap is less than the MSTG. The degree of unsafe behavior in truck-fol- lowing-car situation is based on the comparison of the deviation of mean time gap from the MSTG for each cluster of vehicle class, speed and truck GVW. The fre-quency of unsafe behavior referred to as “unsafe occur- rence” (UO) and the degree of the unsafe behavior re-ferred to as “unsafe deviation” (UD) on specific road segments may be assessed.
Based on Figure 4, the unsafe occurrence (UO) may be calculated by dividing number of points in the unsafe region by total data points as given in Equation (2).
No. of Data Points in Unsafe Region
UO 100
Total Data Point
= × (2)
The value of UD is calculated as follows: UD=MSTG−MUTG (3)
where,
UO is in percentage and UD is in seconds, MUTGis the mean unsafe time gap in seconds.
3. An Illustrative Example
To illustrate the application of the proposed safety per-formance assessment technique, a case study was con-ducted on a rural two-lane highway in the state of Selan-gor in Malaysia. The empirical data is collected for a four months period using a weigh-in-motion system and the simulation data is obtained using the MSC ADAMS software.
3.1. Simulation Data and Analysis
Close following has been identified as one of the most important contributors to rear-end collisions. Most of the time vehicle dynamics influence driver behavior in con-trolling their vehicles. Thus, braking performance para-meters such as stopping time, stopping distance and de-celeration are essential parameters in close-following study. In a truck-following-car situation, there are signif-
icant dissimilarities in terms of braking performance characteristics.
The brake performance of vehicles can be analyzed in several different ways. This can be through an actual experimental work or through vehicle dynamics simula-tion packages. Obviously, the process of building and instrumenting the prototype for actual experimental test-ing involves significant engineertest-ing time and expense. Furthermore, some actual testing is quite dangerous and difficult to implement such as determination of safe fol-lowing gap time in a vehicle folfol-lowing situation.
As computers have gotten faster, and software user in-terfaces have improved, commercial simulation packages such as MSC ADAMS have become widely used in in-dustry for rapidly evaluating hundreds of test conditions much faster than real time. In addition to testing, simula-tion provides substantial time and cost savings. MSC ADAMS software is a kind of virtual prototyping soft- ware for simulating vehicle dynamics and currently used by many major auto manufacturers.
In this study, MSC ADAMS software has been used to generate stopping time data for passenger cars and trucks under various loading and speed condition. Since the aim of the study is to investigate the safety performance of truck drivers in an actual truck-following-car situation, it is important to develop more realistic simulated truck model. Thus, in this study, the truck model and its speci-fication for 2-axle, 3-axle and 4-axle truck has been de-veloped in accordance to prevalent truck type available on the road. Simulation was carried out under the as-sumption that the vehicle has reached a steady state con-dition and stay on the road at a constant speed before the brakes are applied at 285 N. Furthermore, the trucks with air drum brake and parabolic leaf spring suspension have adequate braking force. The road profile is flat and straight road condition where differences in road mate-rials and stiffness are not significant.
Simulation data on leading car braking time (BTLV) is
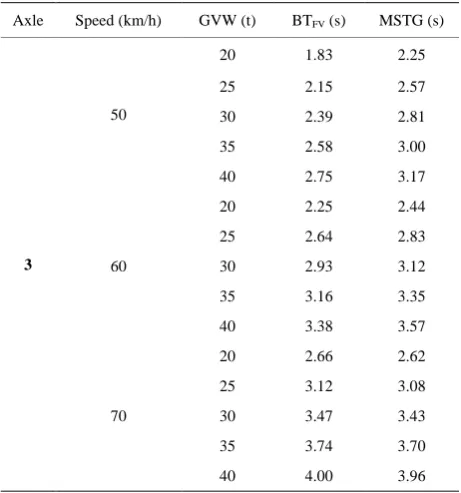
shown in Table 1 while the following truck braking time (BTFV) for 2-axle, 3-axle and 4-axle trucks are shown in
Tables 2-4 respectively.
[image:4.595.307.539.692.737.2]Using Equation (1) the respective values of MSTG are determined for the different truck types travelling at three different speeds with different GVWs. As would be ex-pected the MSTG varies for the different combinations of truck type, truck GVW and travel speed. In general, it is worth noting that for a particular truck type, say the 3-axle truck, travelling at a particular speed, say 60 km/h,
Table 1. Braking time of passenger car (sedan).
Speed (km/h)
50 60 70
the truck braking time (BTFV) will increase as the GVW
increases. It means that as the GVW of the truck increas-es it needs longer time to stop safely after the brakincreas-es are applied. Consequently, the MSTG also increases as the GVW increases implying that for a particular truck fol-lowing a car, the minimum safe time gap will be longer than usual if the truck is carrying higher payload than usual. The truck driver would need to understand this in order to avoid rear-end collision in emergency situation.
3.2. Empirical Data Collection and Analysis
[image:5.595.306.540.317.711.2]Time gap data together with all other traffic and vehicu-lar data such as GVW, wheelbase and vehicle class were obtained from a weigh-in-motion (WIM) system installed on Route 54 in the state of Selangor in Malaysia. The WIM system was installed next to a static weight station operated by the Road Transport Department of Malaysia. The road type is rural single carriageway with standard width and layout and having a straight geometry in a flat
Table 2. BTFV and MSTG for 2-axle trucks.
Axle Speed (km/h) GVW (t) BTFV (s) MSTG (s)
2
50
20 2.29 2.71
25 2.50 2.92
30 2.69 3.11
60
20 2.75 2.94
25 3.06 3.25
30 3.25 3.44
[image:5.595.306.539.317.719.2]70 20 3.25 3.21
Table 3. BTFV and MSTG for 3-axle trucks.
Axle Speed (km/h) GVW (t) BTFV (s) MSTG (s)
3
50
20 1.83 2.25
25 2.15 2.57
30 2.39 2.81
35 2.58 3.00
40 2.75 3.17
60
20 2.25 2.44
25 2.64 2.83
30 2.93 3.12
35 3.16 3.35
40 3.38 3.57
70
20 2.66 2.62
25 3.12 3.08
30 3.47 3.43
35 3.74 3.70
40 4.00 3.96
terrain as shown in Figure 5. Further elaboration of the WIM system is presented in Saifizul et al. [18].
In this study, data was collected for four months from the system. In order to remove the influence of the sur-roundings and focus on the driver behavior and vehicle performance capability in a vehicle following situation, data were filtered based on the following conditions: ● Dry weather condition
● Daytime from 7 am (after sunrise) and before 7 pm (before sunset)
● No change in the infrastructure and surrounding at the site
● Time headway less than 4 s [16]
[image:5.595.56.288.347.463.2]By limiting the number of samples consisting of small relative speed between leading and following vehicle, the time gap data for 2-axle, 3-axle and 4-axle trucks that passed the filtering stage of this study consisted of 3743
Table 4. BTFV and MSTG for 4-axle trucks.
Axle Speed (km/h) GVW (t) BTFV (s) MSTG (s)
4
50
20 1.75 2.17
25 1.85 2.27
30 2.11 2.53
35 2.42 2.84
40 2.71 3.13
60
20 2.16 2.35
25 2.28 2.47
30 2.60 2.79
35 2.96 3.15
40 3.32 3.51
70
20 2.55 2.51
25 2.69 2.65
30 3.08 3.04
35 3.49 3.45
40 3.92 3.88
[image:5.595.57.288.490.737.2]observations. The time gap data are then grouped ac-cording to leader-follower pair composition, GVW and vehicle class (the heavy vehicle is classified based on their number of axles). In this study, only truck following passenger car pairs will be investigated. The analysis of results is presented based on the assumption that all the vehicles travel in one lane without overtaking.
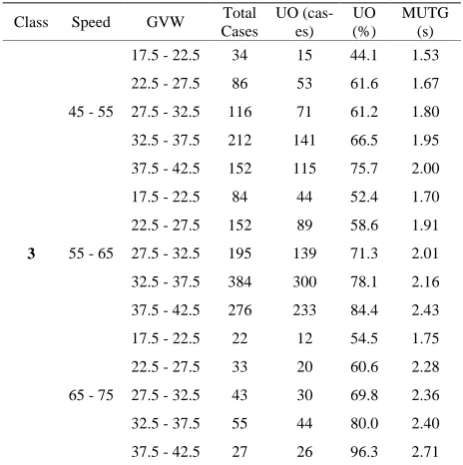
For the case of 2-axle trucks following cars, the oc-currence and frequency of unsafe time gap (UO) are shown in Table 5 while cases involving 3-axle trucks and 4-axle trucks following cars are shown in Tables 6
and 7 respectively. As explained earlier, the UO is ob-tained by comparing the actual time gap and the MSTG for each vehicle class (truck type), speed range and GVW range, and all actual time gaps which are less than the MSTG will be considered unsafe time gap (UO). The mean of the unsafe time gaps (MUTG) for each truck type, speed range and GVW range are also given in
Tables 5-7.
From the observed data it is quite apparent that for each truck type and speed range, both the UO percentage and MUTG increases as the truck GVW increases. This means that there are relatively more occurrences of un-safe time gaps as the truck GVW increases. This implies that the truck driver is generally insensitive to the need to adjust his/her driving behavior (in this case, truck fol-lowing car behavior) as the truck GVW increases. It may also imply that the truck drivers are over confident in their ability to handle the truck even though they are carrying higher payloads than usual. The MUTG will be compared with the respective MSTG to determine the degree of deviation of MUTG from the MSTG and this will be discussed in the next section.
4. Discussion
[image:6.595.307.539.231.464.2]The frequency of occurrence of unsafe time gap (UO) and degree of unsafe time gap (UD) for 2-axle trucks following cars is given in Table 8. The UO varies be-tween 58.3% and 75.0% for mean speeds of 50 km/h to 70 km/h and mean GVW of 20 tons to 30 tons. The mean
Table 5. Unsafe occurrence (UO) and mean time gap of UO cases for 2-axle trucks.
Class Speed GVW Total Cases UO (cases) UO (%) MUTG (s) 2
45 - 55
17.5 - 22.5 151 88 58.3 1.78
22.5 - 27.5 95 61 64.2 1.86
27.5 - 32.5 24 18 75.0 2.13
55 - 65
17.5 - 22.5 168 99 58.9 1.93
22.5 - 27.5 128 93 72.7 2.04
27.5 - 32.5 28 20 71.4 2.16
65 - 75 17.5 - 22.5 17 10 58.8 2.02
UO of 65.6% indicates that a significant proportion of the trucks are following cars at time gaps below the minimum safe time gap (MSTG) and the trucks will not be able to avoid hitting the leading car in an emergency situation. The degree of unsafe time gap (UD) indicates that the deviation of the mean unsafe time gap is 1.09 seconds below the MSTG. The mean unsafe time gap is 35.4% below the MSTG. In the case of an emergency situation, not only does the truck hit the leading car, it
Table 6. Unsafe occurrence (UO) and mean time gap of UO cases for 3-axle trucks.
Class Speed GVW Total Cases UO (cas-es) UO (%) MUTG (s) 3
45 - 55
17.5 - 22.5 34 15 44.1 1.53
22.5 - 27.5 86 53 61.6 1.67
27.5 - 32.5 116 71 61.2 1.80
32.5 - 37.5 212 141 66.5 1.95
37.5 - 42.5 152 115 75.7 2.00
55 - 65
17.5 - 22.5 84 44 52.4 1.70
22.5 - 27.5 152 89 58.6 1.91
27.5 - 32.5 195 139 71.3 2.01
32.5 - 37.5 384 300 78.1 2.16
37.5 - 42.5 276 233 84.4 2.43
65 - 75
17.5 - 22.5 22 12 54.5 1.75
22.5 - 27.5 33 20 60.6 2.28
27.5 - 32.5 43 30 69.8 2.36
32.5 - 37.5 55 44 80.0 2.40
[image:6.595.307.539.504.736.2]37.5 - 42.5 27 26 96.3 2.71
Table 7. Unsafe occurrence (UO) and mean time gap of UO cases for 4-axle trucks.
Class Speed GVW Total Cases UO (cases) UO (%) MUTG (s) 4
45 - 55
17.5 - 22.5 50 27 54.0 1.61
22.5 - 27.5 37 17 45.9 1.70
27.5 - 32.5 34 15 44.1 1.84
32.5 - 37.5 62 40 64.5 2.05
37.5 - 42.5 88 58 65.9 2.22
55 - 65
17.5 - 22.5 221 122 55.2 1.61
22.5 - 27.5 81 40 49.4 1.56
27.5 - 32.5 78 34 43.6 1.97
32.5 - 37.5 153 98 64.1 2.29
37.5 - 42.5 154 115 74.7 2.33
65 - 75
17.5 - 22.5 206 130 63.1 1.71
22.5 - 27.5 26 16 61.5 1.79
27.5 - 32.5 12 7 58.3 2.10
32.5 - 37.5 26 20 76.9 2.29
[image:6.595.58.288.609.734.2]Table 8. Unsafe occurrence (UO) and unsafe deviation (UD) cases for 2-axle trucks.
Class Mean Speed Mean GVW UO (%) UD (s) UD (%)
2
50
20 58.3 0.93 34.3
25 64.2 1.06 36.3
30 75.0 0.98 31.5
60
20 58.9 1.01 34.4
25 72.7 1.21 37.2
30 71.4 1.28 37.2
70 20 58.8 1.19 37.1
Mean 65.6 1.09 35.4
may end up as a fatal accident.
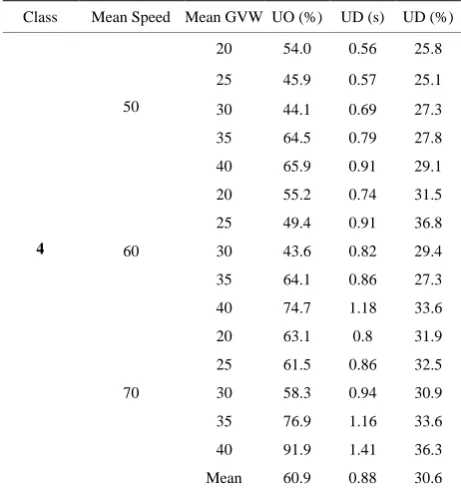
A similar characteristic is observed for the case of 3-axle trucks following cars wherein the mean UO is 67.7%, mean UD is 1.02 seconds and deviation of the mean UD below the MSTG is 33.2% (Table 9). Al-though the occurrence of unsafe time gap is slightly higher as compared to the 2-axle trucks following cars, the degree of unsafe time gap is slightly lower for the case of 3-axle trucks following cars. The case of UO and UD for 4-axle trucks is given in Table 10.
The proposed safety performance assessment tech-nique allows the investigation on vehicle following con-sidering vehicle type, speed and GVW. In this study, the technique is illustrated for the case of truck following car situation. The value of UO indicates the high frequency of unsafe driving among the truck drivers in car-follow- ing situation. Results of UD indicate that significant proportion of truck drivers follow the leading car well below the minimum safe time gap. The results also indi- cate that on the whole an assessment of the safety level on any stretch of road should consider vehicle type, GVW and speed. It is proposed that UO and UD may be used as indicators on the potential of rear-end collisions along a specific stretch of road.
For this case study, the mean UO is found to be 64.5% while mean UD is 0.98 sec. Hence, this means that 64.5% of all truck drivers are following cars at 0.98 seconds less than the minimum safe time gap! This could probably explain why rear-end fatal accidents involving heavy vehicles are alarming in Malaysia, i.e. resulting in 27% of all fatal accidents involving trucks in Malaysia (see
Figures 1 and 2 earlier).
5. Conclusions
This study aims to investigate safety implications of driver behavior in truck-following-car situation consi-dering truck type, time gap, gross vehicle weight and speed. A new approach on safety performance assess-ment involving empirical-simulation technique is sug-gested. The minimum safe time gap (MSTG) is proposed
Table 9. Unsafe Occurrence (UO) and Unsafe Deviation (UD) Cases for 3-Axle Trucks.
Class Mean Speed Mean GVW UO (%) UD (s) UD (%)
3
50
20 44.1 0.72 32.0
25 61.6 0.9 35.0
30 61.2 1.01 35.9
35 66.5 1.05 35.0
40 75.7 1.17 36.9
60
20 52.4 0.74 30.3
25 58.6 0.92 32.5
30 71.3 1.11 35.6
35 78.1 1.19 35.5
40 84.4 1.14 31.9
70
20 54.5 0.87 33.2
25 60.6 0.8 26.0
30 69.8 1.07 31.2
35 80.0 1.3 35.1
40 96.3 1.25 31.6
[image:7.595.56.288.111.241.2]Mean 67.7 1.02 33.2
Table 10. Unsafe occurrence (UO) and unsafe deviation (UD) cases for 4-axle trucks.
Class Mean Speed Mean GVW UO (%) UD (s) UD (%)
4
50
20 54.0 0.56 25.8
25 45.9 0.57 25.1
30 44.1 0.69 27.3
35 64.5 0.79 27.8
40 65.9 0.91 29.1
60
20 55.2 0.74 31.5
25 49.4 0.91 36.8
30 43.6 0.82 29.4
35 64.1 0.86 27.3
40 74.7 1.18 33.6
70
20 63.1 0.8 31.9
25 61.5 0.86 32.5
30 58.3 0.94 30.9
35 76.9 1.16 33.6
40 91.9 1.41 36.3
Mean 60.9 0.88 30.6
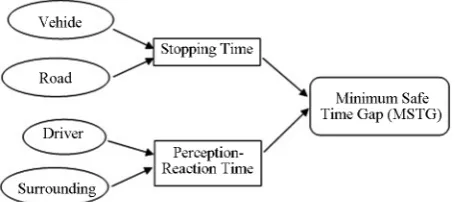
[image:7.595.307.538.393.638.2]simulations, and it is influenced by the factors associated with the driver (e.g. gender, age, fitness etc.), vehicle (e.g. vehicle type, GVW, speed etc.), road (e.g. wet/dry, pave- ment type etc.) and the surrounding conditions (e.g. rain, day/night, fog etc.) as shown in Figure 6.
To illustrate the application of this technique, empiri-cal data were obtained under near optimal driving condi-tions characterized by dry weather, daytime, and no changes in surrounding, and small relative speed using the developed weigh-in-motion-based transport data- collection system, which has been installed on one of the federal roads in Malaysia. The findings of this research highlight the importance of considering the truck type, truck GVW and speed in a truck-following-car situation. Based on this safety performance assessment technique, hazardous vehicle-following behavior of truck drivers may be established for any road segment.
With advancement of computer technology and simu-lation techniques, more accurate simusimu-lation data can be easily achieved at much lower cost. More accurate and comprehensive data on vehicle characteristics and per-formance can be achieved through advanced simulation software which may be quite difficult to obtain by using other means.
Nevertheless, without accurate empirical data, a proper assessment on safety performance could not be done even though accurate simulation data are available. This safety performance assessment technique requires both simulation data (as benchmark) and empirical data (as depicting the actual situation).
The safety performance assessment should go beyond the traditional/conventional methods which may some-times lead to over simplification of the complexity of situation such as involving vehicle dynamics. Consider-ing only kinematics is not enough to explain the actual situation in road safety, heavy vehicles are involved.
[image:8.595.60.288.614.715.2]A major outcome of this study indicates that truck overloading would be a problem in truck-following-car situation when emergency situation arises, and this is rather common in developing countries like Malaysia. Proper monitoring and weight control enforcement strat-egies may be a step forward in addressing this issue. Use of weigh-in-motion systems for road safety studies needs
Figure 6. Significant factors influencing MSTG.
to be considered and enhanced as it has proven to be beneficial. Proper and adequate education of the truck drivers may also be necessary to increase their know-ledge and awareness on the need to adjust their driving habits and time gaps when they carry higher payloads than usual, especially when the leading vehicle has supe-rior dynamic performance capability.
Acknowledgements
The authors would like to acknowledge assistance from the flagship research grant FL020-2012 awarded by the University of Malaya.
REFERENCES
[1] R. R. Knipling J. S. Wang and H. M. Yin, “Rear-End Crashes: Problem Size Assessment and Statistical De- scription,” NHTSA Technical Report DOT HS 807 994, 1993.
[2] P. G. Michael, F. C. Leeming and W. O. Dwyer, “Head- way on Urban Streets: Observational Data and an Inter- vention to Decrease Tailgating,” Transportation Research Part F, Vol. 3, No. 2, 2000, pp. 55-64.
http://dx.doi.org/10.1016/S1369-8478(00)00015-2
[3] L. Evans and P. Wasielewski, “Do Accident-Involved Dri- vers Exhibit Riskier Everyday Driving Behavior?” Acci- dent Analysis and Prevention, Vol. 14, No. 1, 1982, pp. 57-64. http://dx.doi.org/10.1016/0001-4575(82)90007-0
[4] R. L. Postans and W. T. Wilson, “Close-Following on the Motorway,” Ergonomics, Vol. 26, No. 4, 1983, pp. 317- 327. http://dx.doi.org/10.1080/00140138308963348
[5] S. H. Fairclough, A. J. May and C. Carter, “The Effect of Time Headway Feedback on Following Behaviour,” Ac- cident Analysis and Prevention, Vol. 29, No. 3, 1997, pp. 387-397.
http://dx.doi.org/10.1016/S0001-4575(97)00005-5
[6] J. H. Banks, “Average Time Gaps in Congested Freeway Flow,” Transportation Research Part A: Policy and Prac- tice, Vol. 37, No. 6, 2003, pp. 539-554.
http://dx.doi.org/10.1016/S0965-8564(03)00011-9
[7] K. L. Young and P. M. Salmon “Examining the Rela- tionship between Driver Distraction and Driving Errors: A Discussion of Theory, Studies and Methods,” Safety Science, Vol. 50, No. 2, 2012, pp. 165-174.
http://dx.doi.org/10.1016/j.ssci.2011.07.008
[8] SWOV, “Fact Sheet: Intelligent Transport Systems (ITS) and Road Safety,” 2010.
http://www.swov.nl/rapport/Factsheets/UK/FS_ITS_UK. pdf
[9] J. Piao and M. McDonald, “Low Speed Car Following Behaviour from Floating Vehicle Data,” Proceedings of Intelligent Vehicles Symposiumon IEEE Intelligent Vehi- cles Symposium,Columbus, 9-11 June 2003, pp. 462-467. [10] Manitoba Public Insurance, “Air Brake Manual,” 2008.
http://www.mpi.mb.ca/PDFs/AirBrakeManual/AirBrake ManualComplete.pdf
Headway in Steady-State Car-Following on Two-Lane Roads,” Journal of Transportation Engineering, Vol. 135, No. 10, 2009, pp. 687-693.
http://dx.doi.org/10.1061/(ASCE)0733-947X(2009)135:1 0(687)
[12] J. R. Sayer, M. L. Mefford and R. W. Huang, “The Effect of Lead-Vehicle Size on Driver Following Behavior,” (Report number UMTRI-2000-15). The University of Mi- chigan Transportation Research Institute, Ann Arbor, 2000.
[13] R. A. Bixel, G. J. Heydinger, N. J. Durisek and D. A. Guenther, “Effect of Loading on Vehicle Handling,” SAE Paper 980228, SAE International Congress and Exposi- tion, 1998.
[14] J. Y. Wong, “Theory of Ground Vehicle,” John Wiley & Sons Inc., Hoboken, 1993.
[15] A. A. Saifizul, H. Yamanaka and M. R. Karim, “Empiri- cal Analysis of Gross Vehicle Weight and Free Flow
Speed and Consideration on Its Relation with Differential Speed Limit,” Accident Analysis and Prevention, Vol. 43, No. 3, 2011, pp. 1068-1073.
http://dx.doi.org/10.1016/j.aap.2010.12.013
[16] A. A. Saifizul, H. Yamanaka, M. R. Karim and M. Oku- shima, “Empirical Analysis on the Effect of Gross Ve- hicle Weight and Vehicle Size on Speed in Car Following Situation,” Proceedings of the Eastern Asia Society for Transportation Studies, Vol. 8, 2011, pp. 305-317. [17] A. A. Saifizul, H. Yamanaka and M. R. Karim, “Develop-
ment of Integrated Data Collection and Enforcement Sys- tem,” Proceedings of the 17th ITS World Congress, Bu- san, 25-29 October 2010, 11 p.
[18] A. A. Saifizul, H. Yamanaka and M. R. Karim, “Prospect of Using Weigh-in-Motion Based System for Enhancing Vehicle Weight Enforcement—A Case Study of Malay- sian Roads,” Proceedings of the 17th ITS World Congress, Busan, 25-29 October 2010, 11 p.
Nomenclature
WIM—weigh-in-motion GVW—gross vehicle weight MSTG—minimum safe time gap MUTG—mean of the unsafe time gaps
UO—occurrence of unsafe time gaps UD—deviation of MUTG from MSTG STFV—stopping time of following vehicle