http://dx.doi.org/10.4236/ce.2016.71018
Differential Item Functioning in Online
Learning Instrument (EPFun)
Juhaida Abdul Aziz, Maslawati Mohamad, Parilah Mohd Shah, Rosseni Din
Universiti Kebangsaan Malaysia, Bangi, MalaysiaReceived 25 November 2015; accepted 26 January 2016; published 29 January 2016
Copyright © 2016 by authors and Scientific Research Publishing Inc.
This work is licensed under the Creative Commons Attribution International License (CC BY). http://creativecommons.org/licenses/by/4.0/
Abstract
Providing young learners with high-quality digital primary education and literacy skills are nec-essary for them to excel academically. The development of the online Fun Learning Instrument known as English Primary Fun (EPFun) is based on the Piaget Constructivism Development theory. This theory could be applied to young learners as it includes cognitive, behaviourist and second- language acquisition theory as well. The purpose of this study is to detect Differential Item Func-tioning (DIF) in performances between genders among Malaysian young learners in rural primary schools. The data were obtained from the randomly selected respondents of 106 male and 144 female young learners from the target group. The EPFun instrument consists of four constructs: a) Usefulness (USFN), b) Ease of Use (EOU), c) Ease of Learning (EOL) and d) Satisfaction (SAT). To analyse the responses to the instruments, 40 items overall were made up using 5 levels of coded smileys from the 4 constructs. The data were analysed using SPSS and Winsteps version 3.68.2, a Rasch-based item analysis programme. The findings indicate there is no significant difference in DIF performance between male and female young learners. This conclusion is derived from the t-test for Equality of Means, which revealed the results of the Sig. (2 tailed) for every construct (USFN; Sig = 0.558; EOU; Sig = 0.638; EOL; Sig = 0.628 and SAT; Sig = 0.500) larger than 0.5. The findings also revealed that there were only 7 items detected as DIF. However, there is no signifi-cant DIF based on the size range of the logits scales. Female young learners excel in one con-struct-Satisfaction (SAT). However, male young leaners are on a par with female young learners with regard to other constructs. Thus, this instrument is free from DIF and could be used as an in-dicator to gauge young learners’ literacy skills, especially in using hypermedia reading materials in English.
Keywords
1. Introduction
As they advocate a 21st-century learning environment, educators are highly encouraged to promote meaningful
learning contexts. Hence, in order to promote meaningful learning contexts, educators should conduct activities
which integrate the usage of technology (Juhaida, 2014; Nachmias & Segev, 2003). This is because the net-
generations are interested in and surrounded by new digital technologies. Some of them already have the rele-vant knowledge and skills in technologies. This exposure facilitates them in communicating, interacting, and re-flecting constructively during their learning process (Nachmias & Segev, 2003; Maslawati et al., 2011; Zaha-rudin et al., 2011; Juhaida, 2014; Juhaida et al., 2014). The digital environment also promotes fun and authentic learning, which is an essential part of young learners’ lives (Cauffman & MacIntosh, 2006; Rosseni, 2010; Ra-hamat et al., 2011).
Various attempts have been made by educators to ensure that Web-based Fun learning is fundamental throughout the learning process, especially in reading English materials. Along the way, several studies pro-posed logical procedures for the study of Differential Item Functioning (DIF) (Cauffman & MacIntosh, 2006; Hanizah et al., 2006; Rosseni et al., 2011). Generally, studies on DIF analysis focus on academic areas. Accord-ing to Stoneberg Jr. (2004), DIF analysis has been infused into a variety of subjects, namely science, mathemat-ics, English, history, econommathemat-ics, and research studies. However, very few studies have focused on gender bias. Thus, these scholars suggested that studies should be conducted on various aspects related to the item structure and arrangement with the aim of eliminating or reducing any gender bias. To support the issue, Siti Rahayah et al. (2008a; 2008b) revealed some findings on students’ achievement based on gender. Their studies have be-come the local references from different field to ensure that DIF analysis on the item functioning is essential to confirm its reliability. In some other related DIF studies, Sheppard et al. (2006) investigated the Hogan Person-ality Inventory across gender and two racial groups (Caucasian and Black) and have revealed 38.4% (53 out of 138 items) gender-based DIF and 37.7% (52 out of 138 items) race-based DIF. These indicate potential bias for the items displaying DIF more for Caucasians than Blacks. Cauffman & MacIntosh (2006) measured the Mas-sachusetts Youth Screening Instrument by identifying race and gender differential item functioning among juve-nile offenders. An item is a basic unit in an instrument. In order to create an item, it is essential to ascertain the stability and equality of all participants. Thus, DIF is used to measure items with different functions in a con-struct. This can be applied to various demographic groups provided that they are of similar capabilities (Tennant & Pallant, 2007). Numerous educational studies highlighted the diversity of learners’ characteristics, especially gender differences. However, few studies used DIF to provide an explanation of the different performance be-tween genders. Therefore, to proceed locally, this study was embarked upon. In this study, the researchers ex-amined three aspects of EPFun: 1) reliability and validity, 2) the influence of DIF on young learners’ gender and 3) difficulty of EPFun items.
2. Methodology
This study used a survey design. The randomly selected sample consisted of 106 male and 144 female young learners from rural primary schools in Malaysia. The data gathered were analysed using SPSS and Winsteps version 3.68.2, a Rasch-based item analysis programme. The EPFun instrument was developed by a group of
researchers (Juhaida, 2014; Juhaida et al., 2014; Rosseni et al., 2011). The EPFun instrument consists of 40
items that examine four constructs: a) Usefulness (10 items), b) Ease of Use (10 items), c) Ease of Learning (10 items) and d) Satisfaction (10 items). Subsequently, in order to measure the data gathered, Item Response The-ory (IRT) that employs Rasch measurement analysis was utilized to identify the DIF in the instrument. This step is necessary to ensure the quality of the items. Therefore, the items could be further improved, and thus, gender bias could be avoided or reduced.
3. Results
Problem Solution with Rasch-Based Item Analysis
Table 1. Group statistics.
Gender N Mean Std. Deviation Std. Error Mean
Total Score
Male 106 4.39 0.657 0.064
Female 144 4.45 0.583 0.049
Total 250
Table 2. Independent samples test.
Independent Samples Test
Levene’s Test for
Equality of Variances t-test for Equality of Means
F Sig. t df Sig. (2-tailed) Mean Difference
Std. Error Difference
USFN Equal variances assumed 0.051 0.822 0.586 248 0.558 0.038 0.064
Equal variances not assumed −0.582 220.769 0.561 −0.038 0.065
EOU Equal variances assumed 4.868 0.028 0.471 248 0.638 0.030 0.065
Equal variances not assumed 0.458 201.453 0.648 0.030 0.077
EOL
Equal variances assumed 2.065 0.152 −0.485 248 0.628 −0.037 0.079
Equal variances not assumed −0.474 205.609 0.636 −0.037 0.079
SAT Equal variances assumed 0.398 0.529 −0.676 248 0.500 −0.053 0.079
Equal variances not assumed −0.664 210.078 0.507 −0.053 0.080
Note: Usefulness (USFN); Ease of Use (EOU); Ease of Learning (EOL) and Satisfaction (SAT).
To verify whether gender bias existed in the four constructs of the EPFun instrument, further analysis using Winsteps version 3.68.2, a Rasch-based item analysis programme, was administered. Rasch analysis converts raw data from scores to logits. The logits are compared to a linear model to find its odds of success. The logits are within the range of 0 to 1. It is stated that reliability is measured by the ability of the scale to locate the level of the attribute (Bond & Fox, 2011). The purpose is to ascertain its validity; even though the same constructs are given to other groups of respondents in different environments, the same ability can be produced (Bond & Fox, 2011; Tennant & Pallant, 2007).
[image:3.595.89.539.94.373.2]Two significant elements of validity are criterion and construct (Linacre, 2006). The criterion-related validity analyses the ability to calculate an outcome. Construct validity observes whether the items used are able to re-flect the construct measured. As stated by Linacre (2006), point-measured correlations should be positive. Every item should add a significant approach to the construct (Tennant & Pallant, 2007; Bond & Fox, 2011). The suit-able item is calculated by the mean-square residual fit statistics (Bond & Fox, 2011). Fit statistics expected value is 1.0, and ranges from 0 to infinity. Abnormalities represent a lack of fit between the items and the model. The lower values than expected can be interpreted as item redundancy or overlap. Bond and Fox (2011) recom-mended that item mean square for Infit and Outfit scale (Likert/survey) ranges from 0.6 to 1.4.
Table 3 and Table 4 illustrate the statistical summary of items and person reliability index, respectively. The item reliability index is 0.95, whereas the person reliability index is 0.91. This value is positive, as it is near to 1.0 (Bond & Fox, 2011). Hence, EPFun item repetition prediction is also high if it is being conducted on other groups of respondents with similar capabilities (Bond & Fox, 2011). Item separation index is 4.27. It indicates that EPFun items could be divided into 4 strata. Moreover, this provision connotes that the items are 4 times
more distributed from mean square error. The items and person reliability index respectively ≥0.8 is acceptable
and strong (Bond & Fox, 2011). In addition, the separation index of ≥2.0 is also acceptable (Bond & Fox, 2011).
Table 3. Summary Statistics of Item Reliability Index.
RAW SCORE COUNT MEASURE MODEL ERROR
INFIT OUTFIT
MNSQ ZSTD MNSQ ZSTD
MEAN 1082.30 250.00 0.00 0.10 1.01 −0.40 1.13 0.00
S.D. 72.20 0.00 0.50 0.01 0.55 4.80 0.69 5.30
MAX. 1178.00 250.00 1.55 0.14 2.28 9.90 2.56 9.90
MIN. 821.00 250.00 −0.67 0.06 0.47 −6.30 0.39 −7.10
REAL RMSE 0.12 ADJ.SD 0.49 SEPARATION 4.27 ITEM RELIABILITY 0.95
[image:4.595.86.538.102.229.2]MODEL RMSE 0.11 ADJ.SD 0.49 SEPARATION 4.66 ITEM RELIABILITY 0.96
Table 4. Summary statistics of person reliability index.
SUMMARY OF 250 MEASURED PERSONS
RAW SCORE COUNT MEASURE MODEL ERROR
INFIT OUTFIT
MNSQ ZSTD MNSQ ZSTD
MEAN 181.80 40.00 1.90 0.28 1.23 0.40 1.13 0.00
S.D. 17.70 0.00 1.14 0.08 0.75 2.50 0.76 2.60
MAX. 207.00 40.00 4.62 0.61 3.96 6.90 3.94 7.10
MIN. 113.00 40.00 −0.80 0.16 0.22 −4.10 0.22 −4.70
REAL RMSE 0.35 ADJ.SD 1.09 SEPARATION 3.12 PERSON RELIABILITY 0.91
MODEL RMSE 0.29 ADJ.SD 1.11 SEPARATION 3.80 PERSON RELIABILITY 0.94
Table 5. Point measure correlation (PTMEA CORR) of EPFun constructs.
ENTRY RAW
COUNT MEASURE MODEL S.E.
INFIT OUTFIT PT−MEASURE ITEM
NO ITEM SCORE MNSQ ZSTD MNSQ ZSTD CORR.
4 821 250 1.52 0.08 2.28 9.9 2.37 9.9 0.13 A4
39 1119 250 0.25 0.12 0.47 −6.3 0.39 −7.1 0.84 D39
can be increased if misfitting items are dropped from the cluster item measurement.
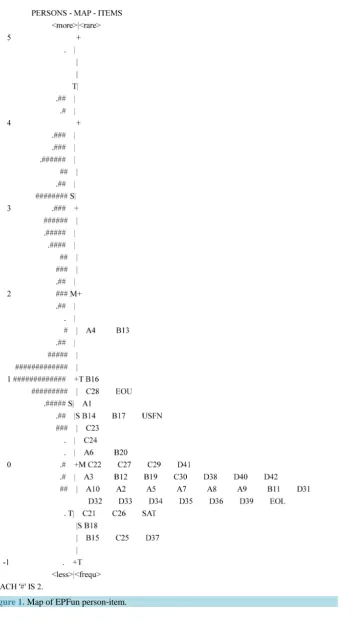
Figure 1 shows the numbers of respondents and the difficulty of items capability hierarchy above a logit scale. The results confirm that all items are scattered and point towards the respondents’ capability level. The ranking of respondents with high capability (easy to agree) is above the scale, whilst the ranking of low ability respon-dents (difficult to agree) is below the scale. The items that are difficult to agree upon are A4 and B13, while dif-ficulty to be measured is 1.58 logit on the top scale. In contrast, the simplest items to agree upon are items C25
and D37 with the measurement of −1.85 logit on the lower scale. The item perceived to be difficult could be
answered by respondents with high capability. On the other hand, respondents could answer easy items with both high and low capability (Bond & Fox, 2011; Linacre, 2006). Overlapping items measure different elements with diverse levels of difficulty (Bond & Fox, 2011).
DIF exists when a group of respondents manages to score higher than another group on the same item. In this
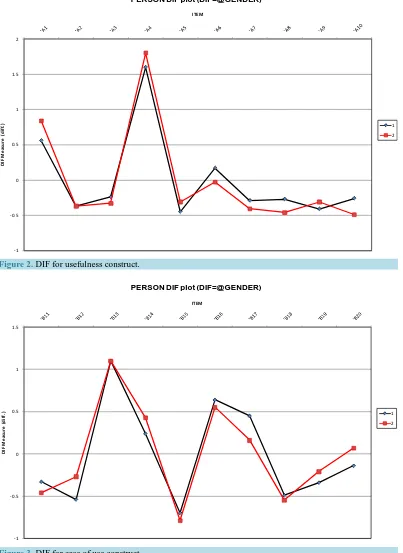
study, this phenomenon could be observed in Figures 2-5. Hence, to support this finding, item parameters
should be similar across the population. As such, to determine if DIF exists in the instrument used, three indica-tors were used (Bond & Fox, 2011; Tennant & Pallant, 2007), namely:
i) t value of < −2.0 or > 2.0
ii) DIF contrast value of < −0.5 or > 0.5 iii) p (Probability) value < 0.05 or > −0.05
[image:4.595.85.540.255.403.2] [image:4.595.87.541.428.492.2]-1 -0.5 0 0.5 1 1.5 2
DI
F M
ea
su
re
(d
iff
.)
ITEM
PERSON DIF plot (DIF=@GENDER)
[image:6.595.114.517.90.643.2]1 2
Figure 2. DIF for usefulness construct.
-1 -0.5 0 0.5 1 1.5
DI
F M
ea
su
re
(d
iff
.)
ITEM
PERSON DIF plot (DIF=@GENDER)
[image:6.595.119.513.92.367.2]1 2
Figure 3. DIF for ease of use construct.
and it should be dropped from the instrument. If the item only meets one of the conditions, it should not be re-jected but it should be separated and fixed (Rosseni et al., 2011). With respect to the three indicators given, DIF
from EPFun constructs can be determined from Figures 2-5.
[image:6.595.116.516.374.647.2]-1 -0.8 -0.6 -0.4 -0.2 0 0.2 0.4 0.6 0.8 1
DI
F M
ea
su
re
(d
iff
.)
ITEM
PERSON DIF plot (DIF=@GENDER)
[image:7.595.114.517.96.422.2]1 2
Figure 4. GDIF for ease of learning construct.
-1 -0.8 -0.6 -0.4 -0.2 0 0.2 0.4 0.6 0.8 1
DI
F M
ea
su
re
(d
iff
.)
ITEM
PERSON DIF plot (DIF=@GENDER)
[image:7.595.115.513.369.650.2]1 2
Figure 5. GDIF for satisfaction construct.
two lines. This suggests the items are more difficult for male respondents (Blue line 1) and easier for female re-spondents (Red line 2). The t-test for Equality of Means revealed the result of the Sig. (2 tailed) as 0.558, which is more than 0.5 as the cut-off point for DIF. The visible distance is very close and not much difference can be measured. Thus, it is safe to conclude that there is no gender bias for items in the first construct (Usefulness).
significant differences within the logit scales. The t-test for Equality of Means revealed the result of the Sig. (2 tailed) as 0.638, which is more than 0.5 for DIF contrast value. Again, the visible distance is very close, and not much difference can be measured except for items B11, B12, B17, B19 and B20. Nevertheless, all ten items in the second construct (Ease of Use) donot show any sign of bias, whereas even the hardest item, B12, appears to be easier for male respondents. Item B17 appears to be easier for female respondents. However, the values indi-cated in the logit scales are not strong enough to make it a biased item. Hence, the conclusion can be drawn that all items that measure the second construct (Ease of Use) show fairness to both genders.
Similar to the first and second constructs, the third construct (Ease of Learning) in Figure 4 also reveals the
same phenomenon. DIF contrast value is 0.628, above 0.5. From the graph, the lines indicate that there is a big gap between male and female respondents. Out of ten items in this construct, six items, namely C21, C23, C26, C28, C29 and C30 exhibit distance between the two lines. This suggests that items C21, C23 and C26 are more difficult for male respondents (Blue line 1) and easier for female respondents (Red line 2). Items C28, C29, C30 reflect otherwise. With respect to the items in EPFun questionnaire, items C21, C23 and C26 are asking one’s opinion on how to use the blog. Asking one’s opinion and expecting an answer that can be neither right nor wrong could be considered as a higher-order thinking skill (HOTs) (Juhaida, 2014). Generally, females are known to be able to exercise HOTs better than males (Din et al., 2011; Prensky, 2001; Prensky, 2007). This ex-planation can be accepted because males tend to take matters lightly, especially if they do not trigger their inter-est. Males seldom focus on details or irrelevant issues (Hanizah et al., 2006; Sheppard et al., 2006).
For the last construct (Satisfaction), as can be referred to in Figure 5, seven out of ten items are detected to
have a gap between both lines (Blue line 1 and Red line 2). This indicates gender bias. The items D31, D38, D39 and D41 are identified to be easier for male respondents. Items D32, D35 and D37 reveal otherwise. In order to support the issue, the t-test for Equality of Means revealed the result of the Sig. (2 tailed) as 0.5, which is equal to 0.5 for DIF contrast value. The value is not much contradicted to the cut of value of the indicator. Though the items indicate gender bias, researchers were reluctant to drop the items. This is because moderate bias items are considered not problematic, especially when its direction is unsystematic (Tennant & Pallant, 2007). Therefore, the items need to be separated, fixed and then reused in the instrument.
Meanwhile, several astonishing findings were revealed with regards to the issue discussed (Sheppard et al., 2006;
Zaharudin et al., 2011). Though gender bias has been detected in some items under the construct (Satisfaction), it
could not be the reason for the researchers to drop these items. The findings of this study reveal otherwise, indicat-ing that there is no significant difference between male and female young learners in gainindicat-ing fun durindicat-ing web-based learning. These findings are parallel with another study, which indicates that itembias does not adversely affect the measurement quality and predictive validity of the overall instrument (Sheppard et al., 2006). Hence, there is no difference with regard to the capability of male and female young learners in Fun learning during web-based learn-ing, as perceived by some scholars (Prensky, 2001; Rahamat et al., 2011). They believe that male young learners are expected to be more powerful in certain aspects, especially physical endurance. Female young learners, on the other hand, are more at ease with cognitive matters, namely mathematic and scientific areas. Female young learners are also capable of achieving good results in the domain of technology. For these reasons, it is imperative that a digital learning environment be developed for both genders. Despite all the issues discussed, DIF analysis indicates that female young learners are prone to possess more non-verbal intelligence than male young learners. Male young learners, on the other hand, are prone to have more verbal intelligence (Hanizah et al., 2006). Each learner has his unique learning style; namely, learning strategies, cognitive levels, types of instruction to which they re-spond best, and perceptions and attitudes toward the nature of knowledge.
4. Conclusion
It is safe to conclude that EPFun is a valid and reliable instrument, since only 7 out of 40 items were detected to be gender biased. The solution was to simplify and improve the sentence construction. They could be retained and easily understood by the young respondents. Generally, Malaysian young learners are robust in struggling to be proficient in their field (Din et al., 2011). The issue of gender bias could be eliminated or reduced only by the educators’ correct perceptions. Whether an instrument is created or adapted, the process of measuring the reli-ability and validity of the instrument should be the main focus of any researcher.
New and appropriate teaching approaches hopefully will increase students’ achievement and motivation to
learn (El-Bakry et al., 2011; Nachmias & Segev, 2003; Norman et al., 2011; Prensky, 2007; Wheeler, 2011;
of the primary educational system in Malaysia, appropriate measures could be taken to attract young learners, regardless of their gender differences toward new multimodal modes of learning. In a nutshell, DIF benchmark-ing could also be administered in primary schools throughout Malaysia.
References
Bond, T. G., & Fox, C. M. (2011). Applying the Rasch Model: Fundamental Measurement in the Human Sciences. NJ: Law-rence Erlbaum Association Publishers.
Cauffman, E., & MacIntosh, R. (2006). A Rasch Differential Item Functioning Analysis of the Massachusetts Youth Screen-ing Instrument: IdentifyScreen-ing Race and Gender Differential Item FunctionScreen-ing among Juvenile Offenders. Educational and Psychological Measurement, 66, 502-521. http://dx.doi.org/10.1177/0013164405282460
El-Bakry, H. M., Saleh, A. A., Asfour, T. T., & Mastorakis, N. (2011). A New Adaptive e-Learning Model Based on Learner’s Styles. In M. Demiralp, Z. Bojkovic, & A. Repanovici (Eds.), Mathematical Methods & Techniques in Engi-neering and Environmental Science, Proceedings of the 13th WSEAS International Conference on Mathematical and Computational Methods in Science and Engineering (MACMESE’II).
Juhaida, A. A. (2014). Development and Evaluation of a Web-Based Fun Reading English for Primary Learners. Ph.D. The-sis, National University of Malaysia.
Juhaida, A. A., Parilah. M. S., & Rosseni, D. (2014). A Paradigm in Education: Validation of Web-Based Learning for Young Learners. International Journal of Education and Information Technologies, 8, 288-293.
Linacre, J.M. (2006). WINSTEPS: Facets Rasch Measurement Computer Program. Chicago: Winsteps. Com.
Maslawati, M., Azura, O., Supyan, H., & Zaini, A. (2011). Evaluating the Effectiveness of e-Learning in Language Class-rooms. E-ACTIVITIES’11 Proceedings of the 10th WSEAS International Conference on e-Activities, 112-117.
Nachmias, R., & Segev, L. (2003). Students’ Use of Content in Web-Supported Academic Courses. Internet and Higher Education, 6, 145-157. http://dx.doi.org/10.1016/S1096-7516(03)00021-6
Norman, H., Rosseni, D., & Nordin, N. (2011). A Preliminary Study of an Authentic Ubiquitous Learning Environment for Higher Education. Proceedings of the 10th WSEAS e-Activities.
Prensky, M. (2001). Digital Natives, Digital Immigrants. On the Horizon, 9, 1-6. http://dx.doi.org/10.1108/10748120110424816
Rahamat, R., Shah, P. M., Rosseni, D., Nor, R., Puteh, S., Mohamed Amin, E., & Abdul Aziz, J. (2011). Learners’ Evalua-tion of an e-Learning Material. Proceedings of the 10th WSEAS e-Activities.
Rosseni, D. (2011). Development and Validation of an Integrated Meaningful Hybrid e-Training (I-Met) for Computer Sci-ence: Theoretical-Empirical Based Design and Development Approach. Ph.D. Thesis, Universiti Kebangsaan Malaysia.
Rosseni, D., Norazah, N. K., Jusof, F., Sahar, M., Nordin, I., Zakaria, M. S., Khairul Anwar, M., & Mohamed Amin, E. (2011). Hybrid E-Training Measurement Tool: Reliability and Validity. Middle East Journal of Scientific Research, 7, 40-45.
Rosseni, D., Verawati, M. F. K., & Johar, N. (2011). Gender Differential Item Functioning (GDIF) Analysis for the Mean-ingful e-Learning Instrument. Proceedings of the 10th WSEAS e-Activities, 40-45.
Sheppard, R., Kyunghee, H., Colarelli, S. M., Guangdong, D., & King, D. W. (2006). Differential Item Functioning by Sex and Race in the Hogan Personality Inventory. Assessment, 13, 442-453. http://dx.doi.org/10.1177/1073191106289031
Siti Rahayah, A., Noriah, M. I., Abdul Ghafur, A., Rodiah, I., & Nur’ Ashiqin, N. (2008a). Communication, Leadership, and Teamwork Skills as Core Competencies among Higher Education Students. Proceedings of the ASAIHL International Conference, 7-10 April, Bangkok, 149-158.
Siti Rahayah, A., Rodiah, I., & Noriah, M. I. (2008b). Profil kemahiran generik pelajar-pelajar institut pengajian tinggi: Ka-jian kes di Universiti Kebangsaan Malaysia (UKM). Seminar Kebangsaan Jawatankuasa Penyelaras Pendidikan Guru.
Stoneberg Jr., B. D. (2004). A Study of Gender-Based and Ethnic-Based Differential Item Functioning (DIF) in the Spring 2003 Idaho Standards Achievement Tests Applying the Simultaneous Bias Test (SIBTEST) and the Mantel-Haenszel Chi Square Test. Internship in Measurement and Statistics, 1-15.
Tennant, & Pallant, J. (2007). SPSS Survival (3rd Ed.). NY: Open University Press.
Wheeler, S. (2011). Teacher Resistance to New Technologies: How Barriers to Web Enhanced Learning Can Be Overcome. In G. Trentin, & M. Repetto (Eds.), Faculty Training for Web Enhanced Learning, Nova Science.
Wood, S. L. (2010). Technology for Teaching and Learning. International Journal of Teaching and Learning in Higher Education, 22, 299-307.