Volume 63 Number 6233 DOI: 10.22444/IBVS.6233
Konkoly Observatory Budapest
23 January 2018 HU ISSN 0374 – 0676
SPECTROSCOPY OF BRIGHT ALGOL-TYPE SEMI-DETACHED CLOSE BINARY SYSTEM HU TAURI (HR 1471)
M. PARTHASARATHY
Indian Institute of Astrophysics, Bangalore – 560034, India e-mail: [email protected]
Abstract
Radial velocities of the primary component (B8V) of HU Tauri derived from the photographic spectra obtained during January 1974 to December 1974 and spectroscopic orbital elements from the analysis of the radial velocity curve of the B8V primary are given. The Hαline of the late type secondary component is clearly detected on the photographic spectra taken around the quadratures and radial velocities of the secondary component are derived. The radial velocity semi amplitudes of the primary (K1) and secondary (K2) are found to be 60 km/sec and 234 km/sec respectively. The
mass ratio M2/M1 = K1/K2 is found to be 0.2564. The detection of the Hαline of the secondary is confirmed from the high resolution spectra that I obtained during 1981 and 1983 at quadratures using the 2.1-m McDonald observatory Otto Struve reflector telescope and high resolution coud´e Reticon spectrograph.
1
Introduction
The light variability of HU Tauri (HR 1471 = HD 29365, V = 5.92, Sp: B8V) was discovered by Strohmeier (1960). Strohmeier & Knigge (1960) found it to be an eclipsing binary with an orbital period of 2.056 days. Mammano & Margoni (1967) found the system to be a single-lined spectroscopic binary. I made photometric and spectroscopic observations of this system and derived the photometric and spectroscopic elements and absolute dimensions of the components. The observational data and the results of the analysis were included in my PhD thesis (Parthasarathy 1979).
V light curves; a solution to these light curves was presented by Nakamura et al. (1994). Maxted et al. (1995) obtained spectroscopic orbit and absolute parameters of HU Tauri which are in agreement with those obtained by Parthasarathy et al. (1993, 1995) and Parthasarathy (1979). In this paper I present the radial velocities, spectroscopic orbital elements and Hα profiles of HU Tauri.
Table 1: Radial velocities of HU Tauri.
Plate No Emulsion JD(Hel) Phase Radial Velocity
d km/sec
1 2 3 4 5
2442000+
3142 IIa-0 404.238 0.0042 −17
3026 ′′
363.309 0.1054 −41
3027 ′′
363.359 0.1295 −62
3006 103a-0 361.312 0.1341 −78
3111 IIa-0 384.131 0.2313 −67
3112 IIa-0 348.157 0.2439 −59
2953 ′′
353.327 0.2512 −54
2520 103a-0 088.097 0.2668 −63
3092 IIa-0 382.233 0.3083 −63
3093 ′′
382.268 0.3252 −58
3053 103a-0 378.206 0.3502 −73
3164 IIa-0 411.258 0.4186 −24
3034 ′′
364.243 0.5598 −04
3016 ′′
362.228 0.5795 +00
2991 103a-0 360.242 0.6141 +06
2992 ′′
360.275 0.6298 +16
3019 IIa-0 362.441 0.6831 +30
3137 ′′
389.298 0.7441 +54
3100 ′′
383.143 0.7512 +66
3138 ′′
389.321 0.7552 +51
3101 II-a-O 383.173 0.7656 +62
3126 ′′
387.323 0.7838 +62
3062 ′′
379.202 0.8342 +40
3063 ′′
379.241 0.8528 +42
3143 ′′
408.086 0.8759 +43
3153 ′′
410.413 0.8762 +21
2
Observations
All the spectra were obtained on photographic plates and were widened to 400µm with a projected slit width of 20µm. A few spectra in the Hα region were widened to 800µm. The blue spectra were obtained on Eastman Kodak 103a-O and IIa-O (baked and unbaked) photographic plates. The spectra in the Hα region were obtained on Eastman Kodak 098-02, 103a-E and 103a-F photographic plates. Typical exposure times were thirty to sixty minutes for spectra in the blue and 90 minutes for spectra in the Hα
[image:3.595.161.437.220.472.2]region.
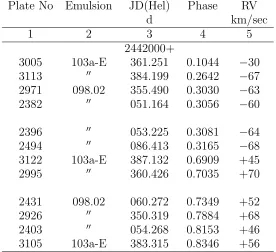
Table 2: Radial velocities (RV) of B8V primary of HU Tau derived from the Hαline. Plate No Emulsion JD(Hel) Phase RV
d km/sec
1 2 3 4 5
2442000+
3005 103a-E 361.251 0.1044 −30
3113 ′′
384.199 0.2642 −67
2971 098.02 355.490 0.3030 −63
2382 ′′
051.164 0.3056 −60
2396 ′′
053.225 0.3081 −64
2494 ′′
086.413 0.3165 −68
3122 103a-E 387.132 0.6909 +45
2995 ′′
360.426 0.7035 +70
2431 098.02 060.272 0.7349 +52
2926 ′′
350.319 0.7884 +68
2403 ′′
054.268 0.8153 +46
3105 103a-E 383.315 0.8346 +56
Table 3: Radial velocities derived from the Hαline of the secondary. Plate No Emulsion JD(Hel) Phase RV
d km/sec
2442000+
3008 098-02 361.437 0.1949
-3113 103-aE 384.199 0.2642 +273
2935 098-02 351.324 0.2769 +243
2382 ′′
051.164 0.3056 +219
2396 ′′
053.225 0.3081 +240
2494 ′′
086.143 0.3165 +223
3017 103-aF 362.306 0.6177
-2431 098-02 060.272 0.7349
-2926 ′′
350.319 0.7884
-2403 ′′
054.268 0.8153 −208
[image:3.595.160.436.531.729.2]Zeiss Abbe comparator. The spectra in the blue cover a wavelength range from 3700 ˚A to 4500 ˚A. The spectral lines used for radial velocity measurement were all the Balmer lines. The HeI 4026.2 ˚A and SiII 4128 ˚A lines were found to be very weak and were not used. Several radial velocity standard stars were observed. Radial velocities given in Tables 1, 2 and 3 are on the standard system.
The method of deriving radial velocities from the spectra obtained on photographic plates was described by Petrie (1964).
High resolution coud´e Reticon spectra in the Hα region were obtained with the Mc-Donald observatory 2.1 m Otto Struve telescope and coud´e spectrograph with Reticon diode array detector. The details of the Reticon diode array and coud´e spectrograph can be found in the paper of Vogt, Tull and Kelton (1978). The high resolution spectra in the Hα region were obtained with the above mentioned telescope during 1981 December 18th
(phase: 0.2402), 1983 February 28th
(phase: 0.7579) and 1982 February 17th
(phase: 0.9833). The Hα line of the secondary which was detected by me earlier on the photo-graphic plates (see Figure 1) is clearly present at quadratures in the above mentioned high resolution spectra (see also Figure 4 in Section 3.2).
The radial velocities given in Table 1 are based on the measurements of Hγ, Hδ, Hǫ
and H8 absorption lines on the blue plates in the spectra of B8V primary. In the Balmer lines in the blue spectra there is no signature of the secondary component of HU Tau.
Since the blue spectra have a dispersion of 25 ˚A/mm and Hα region spectra have a dispersion of 17 ˚A/mm therefore the radial velocities of the B8V primary derived from its Hα line are given in Table 2.
The Hα line of the secondary is clearly resolved only around the quadratures and the radial velocities of the secondary of HU Tau are given in Table 3.
I have considered only the radial velocity curve of the B8V primary. The radial veloci-ties of the secondary are very few in number and they are mostly around the quadratures. The preliminary elements were obtained from the analysis of the radial velocity curve of the B8V primary by using the Lehmann-Filhes (1894) method. The orbit is circular (e = 0). Mammano et al. (1967) also found that the orbit is circular. Therefore, using
e = 0 and using Sterne’s (1941) method for improving the elements of an approximate orbit successive least squares solutions were obtained until the corrections become smaller than mean errors of the various unknowns. Solution obtained from the analysis of the radial velocity curve of the B8V primary of HU Tau using the above described method is given in Table 4 (see Figure 2).
I have not attempted the fit of both components radial velocity curves simultaneously as the measured radial velocities of the secondary are very few and secondly they are mostly around the quadatures. I have not attempted to fit simultaneously the photometric and spectroscopic data as our coverage of the B and V light curves and radial velocity curve of the secondary are largely incomplete.
3
Analysis
Figure 1. The Hαprofiles of HU Tauri at different phases, based on microphotometer tracings. The zero of the velocity scale is the rest position of the line. The Hαabsorption line of the secondary is
marked in the figure. Plate numbers and phases are given in the figure.
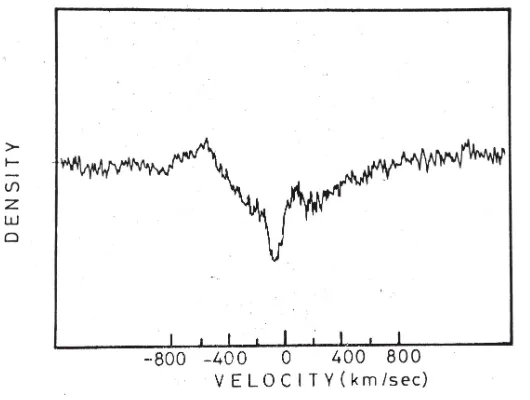
[image:5.595.161.436.498.695.2]Figure 3. A spectrogram (No. 2382) obtained on 3 January 1974 (phase: 0.3056) shows a violet shifted broad emission feature. The peak velocity of the emission feature is found to be −600 km/sec.
3.1 The Hα line
The radial velocities of the primary component derived from the Hα absorption line are given in Table 2 and they were also used in the orbit computation. A spectrogram (No. 2382) obtained on 3rd
January 1974 shows a violet-shifted broad emission feature (Figures 2 & 3). The peak velocity of the emission feature is found to be −600 km/sec (Figures 2 & 3). This spectrogram was obtained on Eastman Kodak 098-02 emulsion like rest of the Hαplates. A few spectra in the Hαregion were obtained on 103a-E and 103a-F plates. The spectrogram of 3rd
January is well exposed and it is widened to 800 microns and the exposure time was 89 minutes. The violet-shifted emission feature extends very much in to the violet wing of the Hαline. This emission feature is absent on a plate taken immediately after one orbital period. This indicates that this emission is a transient event. The same spectrogram shows absorption feature of the secondary towards the red side of the Hα absorption core of the primary (Figure 3). The spectrum obtained on 6th January 1974 (plate No. 2403, phase: 0.8153) shows clearly that this absorption feature is violet-shifted with respect to the Hα absorption core of the primary. This indicates that we are seeing the Hα absorption line of the secondary.
3.2 The Hα line of the secondary
The radial velocities of the secondary component derived from its Hαline are given Table 2 (ref. Parthasarathy, 1979, table 10). The Hαline of the secondary of HU Tauri is clearly seen in the high resolution coud´e Reticon spectra of HU Tauri obtained with the 2.1 m Otto Struve telescope of the McDonald observatory (Figure 4).
From the radial velocities of the Hα line of the secondary (Table 2) K2 is found to be +234 km/sec. The mass ratio m2/m1 = K1/K2 is found to be 60/234 = 0.2564. Figure 4 shows the high resolution Hα region spectra obtained on 1981 December 18th
(phase: 0.2402), on 1983 February 28th
(phase: 0.7579) and at phase 0.9833 on 1982 February 17th
Figure 4. Coud´e Reticon high resolution spectra of HU Tauri in the Hαregion obtained with the 2.1-m Otto Struve telescope of the McDonald observatory. The Hαline of the secondary is marked. The Hα absorption lines of the primary and secondary at phase 0.2402 are clearly seen. Top: phase 0.2402 (1981
December 18),middle: phase 0.7579 (1983 February 28),bottom: phase 0.9833 (1982 February 17).
they are rotating rapidly.
The probable errors in V0, K1 and K2 are found to be 2 km/sec, 2.5 km/sec and 3.5 km/sec, respectively.
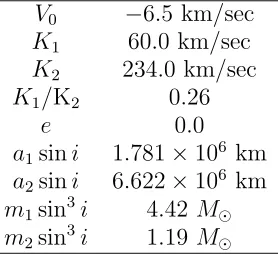
Table 4: Spectroscopic orbital elements of HU Tauri.
V0 −6.5 km/sec K1 60.0 km/sec K2 234.0 km/sec
K1/K2 0.26
e 0.0
a1sini 1.781×10 6
km
a2sini 6.622×10 6
km
m1sin 3
i 4.42 M⊙
m2sin 3
i 1.19 M⊙
4
Conclusions
[image:7.595.231.370.530.657.2]The Hα line of the secondary detected on photographic plates is confirmed with the high resolution coud´e Reticon spectra of HU Tauri obtained with the 2.1 meter Otto Struve telescope of the McDonald Observatory (Figure 4). The strength of the Hα line of the secondary (Figures 1, 2 and 4) indicates that it may be a late F–early G III-IV type star.
HU Tauri is a semi-detached Algol-type close binary system. The primary minimum in the light curve is due to an occultation eclipse. The secondary has filled its Roche lobe and mass-transfer and gaseous streams seem to be present in the system, the phase interval 0.56 to 0.68 seems to be affected. Maxted et al. (1995) also mention that around phase 0.15 there is some scatter. In the IUE UV high resolution spectrum of HU Tauri outside the eclipse SiIV (1393.755 ˚A, 1402.770 ˚A) absorption feature is found, which indicates the presence of high temperature plasma between the components or close to the B8V primary.
Further study of the system based on high resolution and high signal to noise ratio spectra is needed.
Acknowledgements: I am very much thankful to late Prof. M. K. V Bappu for generously allotting observing time on the 1 m telescope of the Kavalur observatory. I am also very much thankful to late Prof. Harlan J. Smith for generously allotting observing time on the 2.1 m Otto Struve telescope of the McDonald observatory. I am thankful to the referee and Dr. L´aszl´o Moln´ar for helpful comments. I am thankful to Dr. L´aszl´o Moln´ar for improving the figures in the paper. I am thankful to Dr. S. Muneer, for his help in preparing the IBVS–style manuscript. I am also thankful to Ms Evelin B´anyai.
References:
Dumitrescu, A., Dinescu, R., 1980, IBVS, No. 1740 Dumitrescu, A., Suran, M.D., 1992, RoAJ,2, 105 Giuricin, G., Mardirossian, F., 1981,A&A, 97, 410 Ito, Y., 1988,IBVS, No. 3212
Mammano, A., Mannino, G., Margoni, R., 1967, Mem. Soc. Astron. Italiana, 38, 459 Maxted, P.F.L., Hill, G., Hilditch, R.W., 1995, A&A, 301, 141
Nakamura, Y., Yamasaki, A., Ito, Y., 1994, PASJ, 46, 267
Parthasarathy, M., 1979, PhD Thesis, Madurai University, Madurai, Tamilnadu, India Parthasarathy, M., Sarma, M.B.K., 1980, Ap&SS, 72, 477 DOI
Parthasarathy, M., Sarma, M.B.K., Vivekananda Rao, P., 1993, Bull. Astr. Soc. India,
21, 601
Parthasarathy, M., Sarma, M.B.K., Vivekananda Rao, P., 1995, A&A, 297, 359 Strohmeier, W., 1960, IAU Cir. No. 1706
Strohmeier, W., Knigge, R., 1960, Ver¨off. Remeis-Sternw. Bamberg. V. 5 Tumer, O., Kurutac, M., 1979, IBVS, No. 1547