Katus,
Tobias
and
Grubert,
Anna
and
Eimer,
Martin
(2015)
Electrophysiological
evidence
for
a
sensory
recruitment
model
of
somatosensory working memory. Cerebral Cortex 25 (12), pp. 4697-4703.
ISSN 1047-3211.
Downloaded from:
Usage Guidelines:
Please refer to usage guidelines at or alternatively
Full Manuscript Title 1
Electrophysiological evidence for a sensory recruitment model of
2
somatosensory working memory
3
4
Running Title 5
Sensory recruitment in tactile working memory
6
7
Authors and Affiliations: Tobias Katusa, Anna Gruberta & Martin Eimera
8
a
Department of Psychology, Birkbeck College, University of London, London
9
WC1E 7HX, United Kingdom.
10
11
Corresponding Author: Tobias Katus
12
Dept. of Psychological Sciences, Birkbeck College, University of London
13
Malet Street, London WC1E 7HX
14
Phone: +44(0)20 7631 6522, Email: t.katus@bbk.ac.uk
15
16
17
18
Conflict of Interest: The authors declare no competing financial interests.
19
20
22
Abstract
23
Sensory recruitment models of working memory assume that information
24
storage is mediated by the same cortical areas that are responsible for the perceptual
25
processing of sensory signals. To test this assumption, we measured somatosensory
26
event-related brain potentials (ERPs) during a tactile delayed match-to-sample task.
27
Participants memorized a tactile sample set at one task-relevant hand to compare it
28
with a subsequent test set on the same hand. During the retention period, a
29
sustained negativity (tactile contralateral delay activity, tCDA) was elicited over
30
primary somatosensory cortex contralateral to the relevant hand. The amplitude of
31
this component increased with memory load and was sensitive to individual
32
limitations in memory capacity, suggesting that the tCDA reflects the maintenance of
33
tactile information in somatosensory working memory. The tCDA was preceded by a
34
transient negativity (N2cc component) with a similar contralateral scalp distribution,
35
which is likely to reflect selection of task-relevant tactile stimuli at the encoding stage.
36
The temporal sequence of N2cc and tCDA components mirrors previous
37
observations from ERP studies of working memory in vision. The finding that the
38
sustained somatosensory delay period activity varies as a function of memory load
39
supports a sensory recruitment model for spatial working memory in touch.
40
41
42
Introduction
43
Working memory (WM) is responsible for the active maintenance of
44
information that is no longer perceptually present. Visual and tactile working memory
45
are both assumed to be based on distributed neural networks that include prefrontal
cortex (PFC) and modality-specific perceptual areas. The activation of PFC during
47
the maintenance of visual and tactile stimuli in working memory is well established
48
(Curtis and D'Esposito 2003; Curtis, Rao, D'Esposito 2004; Fuster and Alexander
49
1971; Kostopoulos, Albanese, Petrides 2007; Romo and Salinas 2003; Postle 2005).
50
Additionally, modality-specific visual (Harrison and Tong 2009; Supèr, Spekreijse,
51
Lamme 2001) or somatosensory areas (e.g., Kaas et al. 2013; Zhou and Fuster
52
1996) show persistent activation during the retention of visual or tactile stimuli.
53
Although the exact role of this delay-period activity in visual areas during working
54
memory maintenance and their link to selective visual attention are still debated (e.g.,
55
van Dijk et al. 2010; Lewis-Peacock et al. 2012; Postle et al. 2013), its existence has
56
led to the “sensory recruitment” model of working memory (D'Esposito 2007; Harrison
57
and Tong 2009; Pasternak and Greenlee 2005; Postle 2006). This model postulates
58
that perceptual brain regions which are responsible for the sensory processing of
59
visual or tactile stimuli are also involved in working memory storage. The sustained
60
activation of perceptual areas might be particularly important when working memory
61
tasks require the maintenance of detailed sensory information (e.g., Lee, Kravitz,
62
Baker 2013; see also Sreenivasan, Curtis, D’Esposito 2014).
63
Support for the sensory recruitment model comes from ERP studies of visual
64
working memory (e.g., Vogel, McCollough, Machizawa 2005; Vogel and Machizawa
65
2004). In these studies, bilateral sample displays were followed after a retention
66
interval by test displays, and participants had to match sample and test objects on
67
one side of these displays. A sustained negativity at posterior electrodes contralateral
68
to the side of the memorized objects (contralateral delay activity, CDA) started 300
69
ms after sample onset and persisted throughout the retention interval. The fact that
70
this CDA component is sensitive to manipulations of visual working memory load and
71
to individual differences in working memory capacity strongly suggests that the CDA
directly reflects the maintenance of visual information in working memory. The
73
contralateral nature and posterior scalp topography of the CDA is consistent with
74
neural generators in extrastriate visual areas (McCollough, Machizawa, Vogel 2007),
75
in line with the sensory recruitment model. The CDA is typically preceded by an N2pc
76
component that emerges around 200 ms post-stimulus, has a similar posterior scalp
77
topography (e.g. McCollough, Machizawa, Vogel 2007), and reflects the attentional
78
selection and encoding of task-relevant objects in ventral visual cortex (Eimer 1996;
79
Luck and Hillyard 1994).
80
While ERP markers of visual working memory are well established,
81
corresponding electrophysiological correlates of tactile working memory have not yet
82
been described. Here, we demonstrate the existence of two somatosensory ERP
83
components that are elicited during the encoding and maintenance of tactile stimuli in
84
working memory, and both show modality-specific topographies over primary
85
somatosensory cortex. We employed a task that was modelled on the delayed
86
match-to-sample task used in earlier studies of visual working memory (e.g., Vogel,
87
McCollough, Machizawa 2005; Vogel and Machizawa 2004). On each trial, a set of
88
tactile sample stimuli was followed after a 2000 ms retention period by tactile test
89
stimuli. Sample and test stimuli were delivered simultaneously to both hands, but the
90
memory task had to be performed for one of these hands only. Participants had to
91
encode and maintain tactile sample stimuli on the currently task-relevant hand, and to
92
match them to subsequent test stimuli on the same relevant hand. On low-load trials,
93
a single tactile stimulus had to be maintained and matched. On high-load trials, two
94
tactile pulses had to be memorized.
95
Results revealed the existence of two somatosensory ERP components that
96
have not yet been described in the literature on tactile attention and working memory.
97
During the retention interval, a sustained tactile contralateral delay activity (tCDA)
emerged with a modality-specific scalp distribution over somatosensory areas. This
99
tCDA component was sensitive to memory load and to individual differences in tactile
100
working memory capacity. It was preceded by a central contralateral negativity (N2cc
101
component) with a similar modality-specific topography that was also modulated by
102
working memory load. Analogous to the visual N2pc and CDA, these N2cc and tCDA
103
components reflect the spatially selective encoding and maintenance of task-relevant
104
information in tactile working memory.
105
106
Materials and Methods
107
Participants
108
Eighteen neurologically unimpaired paid adult participants were tested. The
109
study was conducted in accordance with the Declaration of Helsinki, and was
110
approved by the Psychology Ethics Committee, Birkbeck College. All participants
111
gave informed written consent prior to testing. Two participants were excluded from
112
analysis because their tactile WM capacity measured by Cowan’s K (Cowan 2001)
113
was below 1. Sixteen participants remained in the sample (mean age 32 years, range
114
25-44 years, 3 male, 13 right-handed).
115
116
Stimuli and task design
117
Participants were seated in a dimly lit recording chamber, viewing a monitor
118
showing a central white fixation cross against a black background. Both hands were
119
covered from sight and were placed on a table at a distance of approximately 40 cm.
120
Eight mechanical tactile stimulators were attached to the distal phalanges of the
121
index, middle, ring and small fingers of the left and right hand. Stimulators were
122
driven by an eight-channel sound card (M-Audio, Delta 1010LT) and custom-built
123
amplifiers, controlled by Matlab (MathWorks, Natick, MA). Continuous white noise
was delivered via headphones to mask sounds produced by the tactile stimulators.
125
All tactile stimuli were 100 Hz sinusoids (duration: 200 ms; intensity: 0.37 N).
126
Figure 1 illustrates the experimental procedure. Each trial started with a set of
127
tactile sample stimuli that were delivered simultaneously to the left and right hand.
128
After a 2000 ms retention period, a set of tactile test stimuli was presented
129
simultaneously to both hands. Prior to the start of each block, instructions displayed
130
on the monitor informed participants whether the left or right hand was relevant in the
131
upcoming block. Participants had to decide whether sample and test stimulus
132
locations on this hand were identical (match trials) or different (mismatch trials). The
133
task-relevant hand was swapped after each experimental block. Two load conditions
134
were randomized within each block. In the low-load condition, one sample pulse was
135
presented with equal probability to one of the four fingers of the left hand and the
136
right hand. On match trials, the test pulse was delivered to the same finger of the
137
relevant hand as the sample pulse. On mismatch trials, one of the three other fingers
138
on that hand was stimulated at test. In the high-load condition, two sample pulses
139
were presented to two randomly selected fingers of the left hand and the right hand,
140
respectively. On match trials, test pulses were delivered to the same two fingers of
141
the relevant hand. On mismatch trials, at least one of the two test pulses was
142
presented to a different finger of that hand. Because one of the two sample locations
143
could be repeated at test on mismatch trials, participants had to retain the location of
144
both sample stimuli on the relevant hand to perform the task in the high-load
145
condition. Match and mismatch trials were equiprobable. On the currently
task-146
irrelevant hand, sample and test stimuli were also presented at matching or
147
mismatching locations, and this was independent of whether there was a match or
148
mismatch on the relevant hand.
Participants signalled a match or mismatch between sample and test on the
150
relevant hand with a vocal response (“a” for match and “e” for mismatch) that was
151
recorded with a headset microphone between 200 ms and 1700 ms after test
152
stimulus offset. A question mark replaced the fixation cross on the monitor during this
153
period. The interval between the offset of this question mark and the onset of the
154
sample pulses on the next trial varied between 800 and 1100 ms. The experiment
155
included ten blocks of 48 trials, with twelve trials per block for each of the four
156
combinations of high versus low load trials and match versus mismatch trials.
157
Instructions emphasized accuracy over speed, and the need to avoid head and arm
158
movements and to maintain central gaze fixation. Feedback on hit and correct
159
rejection rates was provided after each block. Two training blocks were run prior to
160
the first experimental block.
161
162
---
163
Insert Figure 1 about here
164
---
165
166
Processing of EEG data
167
EEG data, sampled at 500 Hz using a BrainVision amplifier, were DC-recorded
168
from 64 Ag/AgCl active electrodes at standard locations of the extended 10-20
169
system. Two electrodes at the outer canthi of the eyes monitored lateral eye
170
movements (horizontal electrooculogram, HEOG) and electrodes sites TP9/10 were
171
used as mastoid references. Continuous EEG data was referenced to the left mastoid
172
during recording, and was offline re-referenced to the arithmetic mean of both
173
mastoids and submitted to a 40Hz low-pass finite impulse response filter (Blackman
window, filter order 666). EEG epochs for the 2000 ms interval following sample
175
stimulus onset were computed relative to a 200 ms pre-stimulus baseline. Blind
176
source separation of EEG data was performed with the Independent Component
177
Analysis (ICA) algorithm implemented in the EEGLab toolbox (Delorme and Makeig
178
2004; Delorme, Sejnowski, Makeig 2007). Independent components related to
179
artifacts at anterior scalp regions (in particular, eye movements and blinks), were
180
identified by visual inspection and subtracted from the EEG data. To obtain reliable
181
ICA decompositions, a copy of the data was segmented into eight 250 ms frames
182
covering the 2000 ms retention period. These frames were corrected using
whole-183
epoch baselines to achieve data stationarity (cf., Groppe, Makeig, Kutas 2009)
184
without high-pass filtering, which would have removed slow brain potentials. The
185
copy was discarded after ICA decompositions had been applied to the original data
186
set. Epochs with lateral eye movements that escaped ICA artifact correction were
187
identified and removed with a differential step function on the bipolarized HEOG (step
188
width 100 ms, threshold 24 µV). The resulting HEOG waveforms contained no
189
systematic eye gaze deflections towards the task-relevant hand (Figure 2, bottom
190
panel). After artifact rejection and elimination of trials with incorrect responses, 90.2%
191
of all epochs were retained for statistical analyses (low load: 93.4%; high load:
192
87.1%).
193
194
Results
195
Behavioral performance
196
Participants responded correctly on 97.1% of all low-load trials and 90.4% of
197
all high-load trials. Sensitivity indices (d’) were analysed in a two-way repeated
198
measures ANOVA with the factors memory load (low, high) and relevant hand (left,
199
right). Performance was reduced with high load relative to low load (F(1,15) = 71.728,
p < 10-6), and did not differ between blocks where the left or right hand was relevant
201
(F(1,15) = 1.081, p > 0.3). A significant memory load x relevant hand interaction
202
(F(1,15) = 6.222, p = 0.025) was due to the fact that the performance decrement with
203
high as compared to low memory load was larger when the memory task was
204
performed with the left hand (8.5%) relative to blocks where the right hand was
205
relevant (4.9%).
206
Mean vocal reaction times (RTs) in trials with correct responses were faster in
207
the low-load relative to the high-load condition (799 ms versus 817 ms; main effect of
208
memory load: F(1,15) = 8.801, p = 0.010). RTs did not differ between blocks where
209
the left or right hand was task-relevant (F(1, 15) = 1.846, p > 0.1). The memory load x
210
relevant hand interaction was significant (F(1,15) = 5.25, p = 0.037), as the RT costs
211
for the low-load versus high-load condition were larger when the memory task was
212
performed with the right hand (26 ms) relative to blocks where the left hand was
213
relevant (10 ms). In other words, there was an asymmetric speed-accuracy tradeoff
214
between the two hands for task performance in the high-load versus low-load
215
condition.
216
217
Electrophysiological data
218
Figure 2 shows ERP waveforms averaged across lateral central electrodes (FC3/4,
219
FC5/6, C3/4, C5/6, CP3/4, CP5/6) contralateral and ipsilateral to the task-relevant
220
hand for the 2000 ms interval between the bilateral sample stimulus and the
221
subsequent test stimulus. Results are shown separately for the low-load and
high-222
load conditions. Following the early sensory-evoked ERP components to the sample
223
stimulus, ERP waveforms were characterized by a gradually developing sustained
224
negativity that reached its maximal amplitude immediately before the onset of the test
stimuli. This sustained negativity that was present at contralateral as well as
226
ipsilateral electrodes reflects the Contingent Negative Variation (CNV; see Birbaumer
227
et al. 1990) that is elicited in anticipation of expected task-relevant events such as the
228
test stimulus set used in this study. More importantly, sample stimuli triggered a
229
transient enhanced negativity contralateral to the task-relevant hand. This N2cc
230
component emerged around 180 ms after sample stimulus onset, and its amplitude
231
was larger in the high-load as compared to the low-load condition. The N2cc was
232
followed by a sustained contralateral negativity (tCDA) that remained present
233
throughout the retention period. This tCDA component was larger when two tactile
234
stimuli had to be memorized relative to the low load condition. The topographical
235
maps in Figure 2 illustrate the scalp distribution of N2cc and tCDA components in the
236
low-load and high-load conditions. Data shown in these maps were collapsed across
237
blocks where the left or right hand was task-relevant by flipping ERPs at contralateral
238
electrodes in blocks with a left-hand memory task over the midline. Both N2cc and
239
tCDA components were maximal over somatosensory areas in the postcentral gyrus
240
and adjacent parietal regions (see also Figure 4 below).
241
242
---
243
Insert Figure 2 about here
244
---
245
246
Difference waveforms were computed by subtracting ERPs ipsilateral to the
247
currently task-relevant hand from contralateral ERPs. Statistical tests were conducted
248
on mean amplitudes of these difference waves for a time window centered on the
249
N2cc component (180-260 ms post-stimulus), and a second window centered on the
tCDA (300-2000 ms). Difference values that statistically differ from zero mark the
251
presence of reliable lateralized components in the ERP waveforms. The N2cc was
252
present in both the low-load (t(15) = -5.593, p < 10-4) and high-load condition (t(15) =
253
-7.037, p < 10-5). N2cc amplitudes were significantly larger with high relative to low
254
memory load (t(15) = 4.235, p < 10-3). The tCDA component was present with low
255
load (t(15) = -2.951, p = 0.010) as well as with high memory load (t(15) = -6.126, p <
256
10-4). Similar to the N2cc, tCDA amplitudes were significantly larger in the high-load
257
relative to the low-load condition (t(15) = 3.801, p = 0.002).
258
An additional analysis of mean amplitudes in the tCDA time window obtained
259
for the unsubtracted ERP waveforms revealed a main effect of contralaterality
260
(electrodes contralateral versus ipsilateral to the task-relevant hand; F(1,15) =
261
38.006, p < 10-4) that interacted with load (F(1,15) = 14.448, p = 0.002), due to the
262
fact that the tCDA was larger in the high-load condition. There was also a main effect
263
of load (F(1,15) = 14.862, p=0.002), with larger CNV components with high memory
264
load. This load-dependent modulation of CNV amplitudes was reliable at contralateral
265
as well as ipsilateral electrodes t(15) = -4.500 and -2.481, p < 0.001 and 0.026,
266
respectively).
267
Tactile working memory capacity was calculated for each individual participant
268
on the basis of their performance in the high-load condition, using the formula K = 269
(hits + correct rejections -1) x 2, where 2 denotes memory set size in this condition
270
(Cowan 2001). As illustrated in Figure 3, individual memory capacity was reliably
271
correlated with the difference of tCDA amplitudes between the high-load and low-load
272
conditions (r = -0.640, p = 0.008). Participants with higher tactile working memory
273
capacity showed a more pronounced increase of the tCDA component on trials with
274
high versus low memory load than participants with lower capacity. No correlation
was found between individual K values and the difference of N2cc amplitudes
276
between high- and low-load conditions (p > 0.7).
277
To obtain additional evidence for a link between tCDA amplitudes and
278
behavioral performance at the level of individual trials in the high-load condition, we
279
computed tCDA components in the high-load condition separately for trials with vocal
280
RTs above and below the median RT (with RT median splits conducted individually
281
for each participant and trial condition). Trials with fast responses were more
282
accurate than slow response trials (Cowan’s K: fast = 1.786, slow = 1.453; t(15) =
283
6.362, p < 10-4). Critically, tCDA amplitudes were larger for fast as compared to slow
284
response trials (-0.749 µV versus -0.594 µV), and this amplitude difference was
285
significant (t(15) = -2.564, p = 0.022).
286
287
---
288
Insert Figure 3 about here
289
---
290
291
An additional current source density (CSD) analysis was conducted to further
292
illustrate the modality-specific scalp topographies of the N2cc and tCDA components,
293
and to demonstrate that the selection of lateral central electrodes for the analysis of
294
these components was appropriate. ERP data were collapsed across the low- and
295
high-load conditions, after conversion of scalp potentials to surface Laplacians
296
(lambda = 10-5, iterations = 50, m = 4; cf. Tenke and Kayser 2012). This
297
transformation minimizes effects of volume conduction from remote sources, and
298
leads to a reference-independent representation of EEG/ERP data. CSD
299
topographies provide a conservative estimate of the neural generator patterns that
contribute to scalp-recorded ERPs (Nunez and Westdorp 1994; Tenke and Kayser
301
2012). Robust lateralized effects were found over somatosensory brain regions
302
(Figure 4), as demonstrated by significant differences of contra- minus ipsilateral
303
activity recorded at central electrodes in the time window of N2cc (t(15) =-6.476, p <
304
10-4) and tCDA (t(15) = -4.066, p = 0.001). Apart from an almost significant
305
contralateral positivity at anterior regions during the N2cc time window (t(15) = 2.107,
306
p = 0.052), no statistically reliable lateralization was evident over posterior
307
(electrodes P3/4, P5/6, PO3/4, PO7/8) and anterior (electrodes AF3/4, AF7/8, F3/4,
308
F5/6) scalp regions (all ps > 0.2; see Figure 4).
309
310
---
311
Insert Figure 4 about here
312
---
313
314
315
Discussion
316
We employed a tactile memory task that was modelled on the delayed
match-317
to-sample task used in previous research on visual working memory (e.g., Vogel and
318
Machizawa 2004) to identify ERP correlates of the selection and maintenance of
319
task-relevant tactile stimuli. When participants memorized the spatial locations of one
320
or two tactile sample pulses on the left or the right hand, an enhanced negativity with
321
a centroparietal focus emerged contralateral to the hand where the memorized tactile
322
sample was delivered. This tCDA component was sensitive to tactile working memory
323
load, as it was larger on trials where participants had to remember two tactile
324
stimulus locations than when only a single tactile location had to be memorized
(Figure 2). The load-dependent increase of tCDA amplitudes was more pronounced
326
for participants with higher tactile working memory capacity than for individuals
327
whose capacity (measured by Cowan’s K) was closer to 1 (Figure 3), mirroring
328
previous findings for the visual CDA component (Vogel and Machizawa 2004).
329
Furthermore, the tCDA component was reliably larger on trials with fast vocal
330
responses in the high-load condition, which were also more accurate than slow
331
responses. This demonstrates that the tCDA component is linked to behavioral
332
performance on individual trials. These observations strongly suggest that the tCDA
333
is an electrophysiological correlate of the maintenance of somatosensory information
334
in tactile working memory.
335
Analogous to the visual CDA, which has a modality-specific topography over
336
posterior visual cortex (McCollough, Machizawa, Vogel 2007), the tactile CDA
337
component emerged at contralateral central electrodes. The scalp topography of the
338
tCDA in a CSD-transformed map (Figure 4) also suggests neural generators that are
339
located within the somatosensory system. We conclude that the tCDA component
340
reflects the spatially selective activation of modality-specific brain regions
341
contralateral to the task-relevant hand during the retention of tactile stimuli in working
342
memory. These results provide new support for the sensory recruitment model, which
343
assumes that brain regions involved in the perceptual processing of sensory stimuli
344
are also active during the maintenance of these stimuli in working memory. It should
345
be noted that topographical distributions of CSD-transformed scalp maps only allow
346
relatively coarse approximations of the neural origins of components such as the
347
tCDA, and that the exact anatomical basis of this component needs to be determined
348
in future work.
349
Previous research has used transcranial magnetic stimulation (TMS; Harris et
350
al. 2002) and EEG source reconstruction techniques in studies with human
participants (Spitzer and Blankenburg 2011), as well as single-cell recordings in
352
monkeys (Romo and Salinas 2003) to show that the activity of neurons in primary
353
(SI) and secondary (SII) somatosensory cortex is modulated in tactile working
354
memory tasks. For example, a suppression of alpha activity indicative of attentional
355
processing was found over contralateral SI during the retention period of a
356
vibrotactile frequency discrimination task (Spitzer and Blankenburg 2011).
357
Asymmetric alpha band oscillations have also been suggested as the physiological
358
basis of the visual CDA component (van Dijk et al. 2010). Indirect evidence for a
359
recruitment of somatosensory brain areas comes from a tactile EEG study that used
360
task-irrelevant probe stimuli presented during the retention period to examine how
361
working memory influences somatosensory encoding (Katus, Andersen, Müller
362
2012). The retention of locations in working memory was mirrored by spatially
363
selective modulation of early ERP components to tactile probe stimuli with putative
364
origins in somatosensory areas such as SII (Frot and Mauguière 1999). These lines
365
of evidence point towards close links between the maintenance of tactile information
366
in working memory and the spatially specific activation of early somatosensory areas.
367
The critical new finding of the present study is the discovery of the tCDA component
368
that reflects the maintenance of tactile information in a sustained and load-dependent
369
manner. Because the tCDA is computed by comparing ERPs at electrodes
370
contralateral and ipsilateral to the location of memorized tactile events, it only reflects
371
the difference in the absolute activation of contralateral versus ipsilateral
372
somatosensory areas, and should therefore not be interpreted as evidence that
373
tactile working memory storage is exclusively contralateral. In fact, there is
374
electrophysiological evidence that ipsilateral somatosensory cortex may also be
375
involved in the maintenance of tactile pattern information (Li Hegner et al. 2007).
The tCDA component was preceded by an earlier contralateral negativity,
377
(N2cc component) which emerged around 180 ms after sample stimulus onset.
378
Similar to the tCDA, the N2cc showed a centroparietal scalp topography (see Figures
379
2 and 4), and was larger in the high-load as compared to the low-load condition. This
380
new N2cc component is likely to represent the somatosensory equivalent of the
well-381
known visual N2pc component. The N2pc is triggered at contralateral posterior
382
electrodes at a similar post-stimulus latency during the attentional selection of targets
383
among distractors in visual displays (Eimer 1996; Luck and Hillyard 1994), and
384
precedes the CDA in visual working memory studies that employ a similar delayed
385
match-to-sample task as the one used in the present study (e.g., Anderson, Vogel,
386
Awh 2011; McCollough, Machizawa, Vogel 2007). The load-dependent increase of
387
the tactile N2cc component observed in the present study mirrors previous findings
388
for the visual N2pc, which increases in size with the number of attended objects in
389
visual displays (e.g., Drew and Vogel 2008; Mazza and Caramazza 2011).
390
The absence of N2cc components in previous ERP studies of tactile spatial
391
attention is due to the fact that instead of employing bilateral stimuli, tactile events
392
were delivered to a single location on the left or right hand. In these studies,
modality-393
specific components of the somatosensory event-related potential, such as the P100
394
or N140, were found to be larger for tactile stimuli at currently attended as compared
395
to unattended positions (e.g., Forster and Eimer 2005), demonstrating that spatial
396
attention enhances the sensory processing of tactile events. Analogous to the visual
397
N2pc, which is elicited when target and distractor objects appear in both visual
398
hemifields, measurement of the N2cc component requires that relevant and irrelevant
399
tactile events are presented simultaneously to both hands, or to other homologous
400
locations on the left and right side of the body. Note that the modality-specific
401
somatosensory N2cc component found here is distinct from another ERP component
with the same label that has been observed in stimulus-response compatibility
403
experiments, and is linked to visuospatially guided response selection (Praamstra
404
and Oostenveld 2003). The question whether the effects of memory load on the N2cc
405
and tCDA components reflect load-sensitive modulations of two distinct processing
406
stages (i,e., the attentional selection and the subsequent storage of task-relevant
407
tactile information in working memory), or of a single memory maintenance stage that
408
temporally overlaps with the N2cc component needs to be investigated in future
409
studies where the demands on attentional target selection and working memory load
410
are independently manipulated. In addition to the N2cc and tCDA components, a
411
sustained bilateral CNV component that was observed in the interval between
412
sample and test stimuli was also modulated by memory load. This modulation may
413
primarily reflect differences in the preparation for the match/mismatch decision in
414
response to the test stimulus, which is more demanding in the high-load condition.
415
However, the presence of load effects at ipsilateral electrodes could in principle as
416
well reflect contributions of ipsilateral somatosensory cortex to working memory
417
maintenance (Li Hegner et al. 2007; see also van Ede, Lange, Maris 2013).
418
When considered together with the results of previous ERP investigations of
419
visual working memory (Anderson, Vogel, Awh 2011; McCollough, Machizawa, Vogel
420
2007; Vogel, McCollough, Machizawa 2005; Vogel and Machizawa 2004), the current
421
findings reveal striking similarities between the mechanisms that underlie the spatial
422
selection and selective maintenance of sensory stimuli in vision and touch. During
423
both visual and tactile working memory tasks, two contralateral ERP components are
424
elicited successively, with a highly similar time course in both modalities. N2pc and
425
N2cc components that emerge around 180 ms after sample display onset reflect
426
spatial selection during encoding of task-relevant visual or tactile information. The
427
subsequent CDA and tCDA components are linked to the sustained maintenance of
stored information during the retention period. The fact that the load-sensitive tCDA
429
component observed in this study showed a topography over lateral central
430
somatosensory areas (see Figure 4), while the visual CDA component is elicited over
431
lateral posterior visual cortex (McCollough, Machizawa, Vogel 2007) strongly
432
suggests that the maintenance of visual or tactile information in working memory
433
involves the activation of distinct modality-specific regions, in line with the sensory
434
recruitment model of working memory (D'Esposito 2007; Pasternak and Greenlee
435
2005; Postle 2006; Sreenivasan, Curtis, D’Esposito 2014). In both vision and touch,
436
neural networks that mediate the perceptual processing of sensory signals contribute
437
to the storage and maintenance of information in working memory.
438
439
Acknowledgments
440
This work was funded by the Deutsche Forschungsgemeinschaft (DFG grant KA
441
3843/1-1). We thank Sue Nicholas for invaluable help in setting up the hardware
442
used for tactile stimulation.
443
444
References
445
Anderson DE, Vogel EK, Awh E. 2011. Precision in visual working memory reaches a
446
stable plateau when individual item limits are exceeded. J Neurosci. 31(3):1128–
447
1138.
448
Birbaumer N, Elbert T, Canavan AG, Rockstroh, B 1990. Slow potentials of the
449
cerebral cortex and behavior. Physiol Rev. 70(1): 1-41.
450
Cowan N. 2001. The magical number 4 in short-term memory: a reconsideration of
451
mental storage capacity. Behav Brain Sci. 24(1):87-114x.
Curtis CE, D'Esposito M. 2003. Persistent activity in the prefrontal cortex during
453
working memory. Trends Cogn Sci. 7(9):415–423.
454
Curtis CE, Rao VY, D'Esposito M. 2004. Maintenance of spatial and motor codes
455
during oculomotor delayed response tasks. J Neurosci. 24(16):3944–3952.
456
Delorme A, Makeig S. 2004. EEGLAB: an open source toolbox for analysis of
single-457
trial EEG dynamics including independent component analysis. J Neurosci
458
Methods. 134(1):9–21.
459
Delorme A, Sejnowski T, Makeig S. 2007. Enhanced detection of artifacts in EEG
460
data using higher-order statistics and independent component analysis.
461
Neuroimage. 34(4):1443–1449.
462
D'Esposito M. 2007. From cognitive to neural models of working memory. Philos
463
Trans R Soc Lond B Biol Sci. 362(1481):761–772.
464
Drew T, Vogel EK. 2008. Neural measures of individual differences in selecting and
465
tracking multiple moving objects. J Neurosci. 28(16):4183–4191.
466
Eimer M. 1996. The N2pc component as an indicator of attentional selectivity.
467
Electroencephalogr Clin Neurophysiol. 99(3):225–234.
468
Forster B, Eimer M. 2005. Covert attention in touch: Behavioral and ERP evidence
469
for costs and benefits. Psychophysiology. 42(2):171–179.
470
Frot M, Mauguière F. 1999. Timing and spatial distribution of somatosensory
471
responses recorded in the upper bank of the sylvian fissure (SII area) in humans.
472
Cereb Cortex. 9(8):854–863.
473
Fuster JM, Alexander GE. 1971. Neuron activity related to short-term memory.
474
Science. 173(3997):652–654.
475
Groppe DM, Makeig S, Kutas M. 2009. Identifying reliable independent components
476
via split-half comparisons. Neuroimage. 45(4):1199–1211.
Harris JA, Miniussi C, Harris IM, Diamond ME. 2002. Transient storage of a tactile
478
memory trace in primary somatosensory cortex. J Neurosci. 22(19):8720–8725.
479
Harrison SA, Tong F. 2009. Decoding reveals the contents of visual working memory
480
in early visual areas. Nature. 458(7238):632–635.
481
Kaas AL, van Mier H, Visser M, Goebel R. 2013. The neural substrate for working
482
memory of tactile surface texture. Hum Brain Mapp. 34(5):1148–1162.
483
Katus T, Andersen SK, Müller MM. 2012. Maintenance of tactile short-term memory
484
for locations is mediated by spatial attention. Biol Psychol. 89(1):39–46.
485
Kostopoulos P, Albanese M, Petrides M. 2007. Ventrolateral prefrontal cortex and
486
tactile memory disambiguation in the human brain. Proc Natl Acad Sci USA.
487
104(24):10223–10228.
488
Lee SH, Kravitz DJ, Baker CI. 2013. Goal-dependent dissociation of visual and
489
prefrontal cortices during working memory. Nature Neurosci. 16(8), 997-999.
490
Li Hegner Y, Lutzenberger W, Leiberg S, Braun C. 2007. The involvement of
491
ipsilateral temporoparietal cortex in tactile pattern working memory as reflected in
492
beta event-related desynchronization. Neuroimage. 37(4): 1362–1370.
493
Lewis-Peacock JA, Drysdale AT, Oberauer K, Postle BR. 2012. Neural evidence for a
494
distinction between short-term memory and the focus of attention. J Cogn
495
Neurosci. 24(1): 61–79.
496
Luck SJ, Hillyard SA. 1994. Spatial filtering during visual search: Evidence from
497
human electrophysiology. J Exp Psychol Hum Percept Perform. 20(5):1000–1014.
498
Mazza V, Caramazza A. 2011. Temporal brain dynamics of multiple object
499
processing: the flexibility of individuation. PLoS ONE. 6(2):e17453.
500
McCollough AW, Machizawa MG, Vogel EK. 2007. Electrophysiological measures of
501
maintaining representations in visual working memory. Cortex. 43(1):77–94.
Nunez PL, Westdorp AF. 1994. The surface Laplacian, high resolution EEG and
503
controversies. Brain Topogr. 6(3):221–226.
504
Pasternak T, Greenlee MW. 2005. Working memory in primate sensory systems. Nat
505
Rev Neurosci. 6(2):97–107.
506
Postle BR. 2005. Delay-period activity in the prefrontal cortex: one function is sensory
507
gating. J Cogn Neurosci. 17(11):1679–1690.
508
Postle BR. 2006. Working memory as an emergent property of the mind and brain.
509
Neuroscience. 139(1):23–38.
510
Postle BR, Awh E, Serences JT, Sutterer DW, D'Esposito M. 2013. The
positional-511
specificity effect reveals a passive-trace contribution to visual short-term memory.
512
PLoS ONE. 8(12): e83483.
513
Praamstra P, Oostenveld R. 2003. Attention and movement-related motor cortex
514
activation: a high-density EEG study of spatial stimulus-response compatibility.
515
Brain Res Cogn Brain Res. 16(3):309–322.
516
Romo R, Salinas E. 2003. Flutter discrimination: neural codes, perception, memory
517
and decision making. Nat Rev Neurosci. 4(3):203–218.
518
Spitzer B, Blankenburg F. 2011. Stimulus-dependent EEG activity reflects internal
519
updating of tactile working memory in humans. Proc Natl Acad Sci USA.
520
108(20):8444–8449.
521
Sreenivasan KK, Curtis CE, D’Esposito M. 2014. Revisiting the role of persistent
522
neural activity during working memory. Trends Cogn Sci. 18(2), 82-89.
523
Supèr H, Spekreijse H, Lamme VA. 2001. A neural correlate of working memory in
524
the monkey primary visual cortex. Science. 293(5527):120–124.
525
Tenke CE, Kayser J. 2012. Generator localization by current source density (CSD):
526
implications of volume conduction and field closure at intracranial and scalp
527
resolutions. Clin Neurophysiol. 123(12):2328–2345.
van Dijk H, van der Werf J, Mazaheri A, Medendorp WP, Jensen O. 2010.
529
Modulations in oscillatory activity with amplitude asymmetry can produce
530
cognitively relevant event-related responses. Proc Natl Acad Sci USA. 107(2):
531
900–905.
532
van Ede F, de Lange FP, Maris E. 2013. Anticipation increases tactile stimulus
533
processing in the ipsilateral primary somatosensory cortex. Cereb Cortex.
534
Doi: 10.1093/cercor/bht111.
535
Vogel EK, McCollough AW, Machizawa MG. 2005. Neural measures reveal individual
536
differences in controlling access to working memory. Nature. 438(7067):500–503.
537
Zhou YD, Fuster JM. 1996. Mnemonic neuronal activity in somatosensory cortex.
538
Proc Natl Acad Sci USA. 93(19):10533–10537.
539
540
541
542
Figure Legends
543
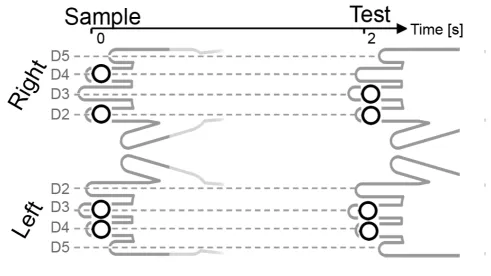
Figure 1. Illustration of the experimental setup. Participants memorized a tactile
544
sample set at one task-relevant hand to compare it with a test set on the same hand
545
after a 2 second retention period. Memory load was varied between trials (low load:
546
one pulse, high load: two pulses per hand). The relevant hand (left, right) was varied
547
between blocks. The example shown here illustrates a high-load trial where the
548
locations of tactile sample and test stimuli (symbolized by white dots) are identical at
549
the left hand (match), but not at the right hand (mismatch).
550
551
Figure 2. Grand mean ERPs elicited in the 2000 ms interval following sample
552
stimulus onset in the low-load and high-load conditions. ERPs were averaged across
lateral central electrode clusters contralateral (blue lines) and ipsilateral (red lines) to
554
the hand where the memory task was performed. Difference maps show the
555
topographical distribution of lateralized effects in the N2cc (bottom) and tCDA (top)
556
time windows. These maps represent the amplitude difference of contralateral minus
557
ipsilateral recordings, collapsed across blocks where the memory task was
558
performed with the left or right hand. Enhanced contralateral negativities are shown
559
in blue. The two bottom panels show difference waveforms for the low-load and
high-560
load condition, obtained by subtracting electrodes ipsilateral to the task-relevant hand
561
from contralateral electrodes, and HEOG difference waveforms, calculated by
562
subtracting HEOG electrodes ipsilateral to the task-relevant hand from contralateral
563
electrodes after artifact rejection. In these HEOG difference waves, any eye
564
movements towards the task-relevant hand would be reflected by negative
565
(downward) HEOG deflections.
566
567
Figure 3. Correlation of individual participant’s tactile working memory capacity K
(x-568
axis) and the increase of tCDA amplitudes in the high-load relative to the low-load
569
condition measured for each participant (y-axis). K was calculated on the basis of
570
individual performance in the high-load condition.
571
572
Figure 4. Grand mean current source density (CSD) topographical maps, showing
573
the scalp distribution of lateralized effects in the N2cc and tCDA time windows. These
574
maps represent the amplitude difference of contralateral minus ipsilateral recordings,
575
collapsed across blocks where the memory task was performed with the left or right
576
hand, and averaged across the low- and high-load conditions. Six electrodes at
577
lateral central scalp regions (black dots) were averaged for each recording cluster
(contra- and ipsilateral to the task-relevant hand). The presence of lateralized effects
579
was also tested for different sets of electrodes over anterior (white triangles) and
580
posterior (white crosses) scalp areas. Reliable lateralized effects were present only
581
for the central electrode cluster.
582
584
FIGURE 1
585
[image:26.595.66.558.74.350.2]587
FIGURE 2
588
[image:27.595.61.552.70.433.2]590
FIGURE 3
591
[image:28.595.58.478.90.484.2]593
FIGURE 4
[image:29.595.59.528.68.365.2]