How to cite this paper: Tang, M. and Hou, J.P. (2016) Statistical Analysis and Evaluation of Heavy Metal Ions in Soil Envi-ronment. Open Access Library Journal, 3: e2690. http://dx.doi.org/10.4236/oalib.1102690
Statistical Analysis and Evaluation of
Heavy Metal Ions in Soil Environment
Min Tang, Jianping HouEnvironmental Monitoring Station, Chongqing, China
Received 28 April 2016; accepted 21 May 2016; published 26 May 2016
Copyright © 2016 by authors and OALib.
This work is licensed under the Creative Commons Attribution International License (CC BY).
http://creativecommons.org/licenses/by/4.0/
Abstract
The paper comprehensively analyzes and evaluates the urban grid soil and rural soil quality and pollution characteristics through methods of single factor index and Nemero comprehensive pol-lution index on the physical and chemical nature of soil, the element pollutants, organic pollutants and other pollutants. The contents of soil pollutants in rural and urban areas showed that the overall soil quality is good and advice on how to improve soil quality in the region is put forward.
Keywords
Soil Environment, Heavy Metals, Statistical Analysis, Single Factor Index Method and Nemerow Comprehensive Pollution Index Method
Subject Areas: Environmental Sciences
1. Introduction
With the rapid development of industry and agriculture, the unreasonable use of pesticides and fertilizers, long- term sewage irrigation, as well as urban and industrial pollution and other factors since 1930s, through different ways, a great number of pollutants entered into the soil environment, did damage to the soil structure, destroyed the soil function [1], and caused quality deterioration of soil ecological environment, making soil pollution a great threat to agricultural product quality safety across China and even the global [2]. The composition, struc-ture, function, characteristics and the special status and role played in the environment ecosystem in environ-mental ecosystem of soil make the soil pollution more complicated than the air and water pollution.
OALibJ | DOI:10.4236/oalib.1102690 2 May 2016 | Volume 3 | e2690
ability to monitor soil pollution, evaluate the risk of soil pollution, confirm the soil environmental safety level, and establish the supervision and management system for soil environmental quality, an investigation on soil environmental quality was carried out in 2014. The investigation and monitoring protect and reasonably utilize land resources, as well as offer scientific and effective basic data to improve the quality of soil environment.
2. Survey Method
Grid distribution is used in urban soil, which means that 1 km × 1 km size square grid is drawn in administrative map with corresponding proportion, 1 monitoring point lying in each grid. According to the landscape, distribu-tion of land use types, soil types and other factors in Northern Yangtze River area, the number of points is ob-tained by the formula that land use area/grid size = number of sample points. After optimization, points number of urban soil survey is ultimately determined as 62. The rural scope of the soil investigation involves the 7 vil-lages of Wubao town and each village has 1 monitoring point, 7 monitoring points in total.
3. Evaluation Index
The evaluation on soil quality is mainly based on Soil environmental quality standard (GB15618-1995) [4], which is divided into three major categories. Class I is mainly applicable to natural reserves approved by the state (except reserves with the original background of high heavy metal concentrations), the centralized drinking water source, tea garden, and pasture and soil in other protected areas; soil quality maintains the natural back-ground level. Class II is mainly suitable for general farmland, vegetable lands, tea gardens, orchards, pasture and other soil; soil quality basically does not do harm to the plant and the environment nor causes pollution. Class III is mainly used in forest land and farmland such as soil with high background value and mineral those have large deal of pollutants (except the vegetable land) ; soil quality basically does not do harm to the plant and the envi-ronment nor causes pollution. The detection of soil generally focuses on detecting their physicochemical proper-ties: pH, full Nitrogen, full Phosphorus and full Kalium and the organics; elements: Arsenic, Cadmium, Cobalt, Chromium, Copper, Fluoride, Mercury, Manganese, Nickel, Lead, Selenium, Vanadium, Zinc; organic pollu-tants: organochlorine pesticides (Six Six Six, DDT) and other major categories. Soil is often contaminated by a variety of heavy metals. Therefore methods of single factor index [5] and Nemero comprehensive pollution in-dex [6] [7] are often used for comprehensive evaluation on soil pollution.
3.1. Single Factor Pollutant Index
Pi reflects the extent of pollution. Its values less than 1 means no pollution while that greater than 1 means
pol-lution. It can be expressed as follows.
i i i
P=C S (1) where Pi is the single pollution index of pollutant i in the soil; Ci is the measured concentration of pollutant i in
the soil of surveyed locations; Si is standard referential value for the evaluation of pollutant i. 3.2. Nemero Comprehensive Pollution Index
Nemero comprehensive pollution index are often used for comprehensive evaluation on soil pollution and the formulation is as below:
(
)
( )
{
}
1 22
mean max 2
N
P = P + P (2)
(
)
( )
{
}
1 22
mean max 2
N
P = P + P (3) where PN is the Nemero comprehensive pollution index; Pmean is the average single pollution index;
2 mean P is the maximum single pollution index.
OALibJ | DOI:10.4236/oalib.1102690 3 May 2016 | Volume 3 | e2690
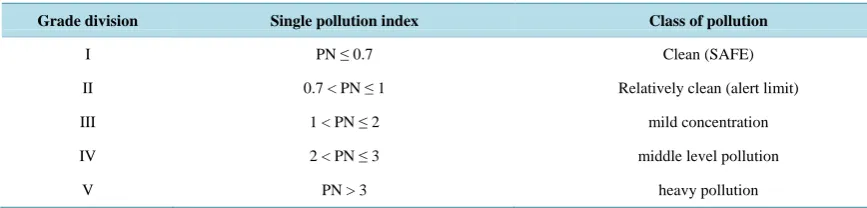
Table 1.Nemero pollution index soil evaluation criteria.
Grade division Single pollution index Class of pollution
I PN ≤ 0.7 Clean (SAFE)
II 0.7 < PN ≤ 1 Relatively clean (alert limit)
III 1 < PN ≤ 2 mild concentration
IV 2 < PN ≤ 3 middle level pollution
V PN > 3 heavy pollution
4. Results and Discussions
There are 7 sampling rural fields for the survey, and the monitoring projects include 20 items: pH, full Nitrogen, full Phosphorus and full Kalium and the organics; elements: Arsenic, Cadmium, Cobalt, Chromium, Copper, Fluoride, Mercury, Manganese, Nickel, Lead, Selenium, Vanadium, and Zinc. The monitoring results of physi-cochemical properties, elemental pollutants and organics are shown inTables 2-4, respectively.
Basic situation of soil fertility: the material composition, structure status and the natural conditions determine the level of soil fertility, which affects growth of plant and is the material basis for the crop yields [8]. From the results of the physicochemical property inTable 7, the pH of rural sampling points varies from 6.9 to 8.0 while the appropriate growth pH environment for general crops is nearly neutral. Thus, the rural soil pH is moderate.
According to the dry soil fertility grading standard (seeTable 5) of Environmental quality standard of nation-al green food places of origin (NY/T391-2000) [9], among seven surveyed villages, whose soil organic contents vary from 9.2 to 14.2 g/kg, the highest is village C, and the lowest is village F. The content of organics reaching class II of accounts for 71.4%, class III 28.6%, which shows that the majority of soil organics in the seven vil-lages reaches class II (good level). The monitoring results of soil full Nitrogen, full Potassium and full Phos-phorus show that the soil fertility levels of the seven villages are all proved to be class III (relatively bad level), indicating the insufficient contents of N, P and K in soil.
The content and distribution of pollutants : The monitoring result of element pollutants in Table 3shows that there is no Arsenic, Mercury and Cadmium, Selenium in the seven villages; the content of Fluoride is 189 - 452 mg/kg, the average value is 318 mg/kg, and village A has the highest content of it; the content of Chromium is 58 - 198 mg/kg, the average value is 107 mg/kg, and village G has the highest content of it; the content of Cop-per is 15 - 43 mg/kg, the average value is 32 mg/kg, and village A has the highest content of it; the content of Manganese is 505 - 7306 mg/kg, the average value is 1988 mg/kg, and village F has the highest content of it; the content of Zinc is 24 - 99 mg/kg, the average value is 58 mg/kg, and village B has the highest content of it; the content of Nickel is 33 mg/kg, it’s sampled in village B and none of it were detected in the other six villages; the content of Cobalt is 0 - 1195 mg/kg, and village F has the highest content of it; the content of Lead is 0 - 24 mg/kg, and village A has the highest content of it. From the organochlorine pesticide monitoring result inTable 4, organochlorine pesticides of Six Six Six and DDT were not detected in any of the seven villages. In all of the monitoring results, Cadmium, Mercury, Arsenic, Copper, Lead, Chromium, Zinc, Nickel and organochlorine pesticides all meet class II. Five elements of Fluoride, Manganese, Cobalt, Selenium and Vanadium are not re-quired in class II. And those that are detected high content of elemental monitoring factors are village F, A and B.
Urban grid soil sampling points are distributed across the whole are, a total of 62 points, and the monitoring projects include 14 items: pH, Arsenic, Cadmium, Cobalt, Chromium, Copper, Fluoride, Mercury, Manganese, Nickel, Lead, Selenium, Vanadium, and Zinc. The detailed monitoring result is shown inTables 5-7.
Statistics of pH monitoring: Among 62 urban grid soil point locations, pH monitoring result is in the range of 4.72 - 8.40, the lowest is in the entry into 412 Park, the highest point is 708. There are 9 points with value of pH less than 6.5 accounting for 14.5% of the total grid number. The number of pH value ranging from the 6.5 - 7.5 is 14 accounting for 22.6% of the total grid number. The number of pH value greater than 7.5 is 39 accounting for 62.9% of the total grid number. The result shows that the pH in this area of soil is alkalescent (Figure 1).
Pollution index evaluation [10]: according to the monitoring results of heavy metal pollutants in soil, single factor index and comprehensive pollution index are calculated respectively and the detailed results are shown in
OALibJ | DOI:10.4236/oalib.1102690 4 May 2016 | Volume 3 | e2690
Table 2. List of results of physical and chemical properties of rural areas.
Sampling point
Projects and results
pH Total nitrogen (%) Total phosphorus (mg/Kg) Total potassium (mg/Kg) organic matter (g/Kg)
A 7.62 0.004 ND 25764 13.4
B 7.83 0.002 ND 27702 9.9
C 7.68 0.006 ND 19854 14.2
D 7.25 0.005 ND 29687 13.5
E 7.84 0.009 ND 25103 12.9
F 8.02 ND ND 20530 9.2
G 6.93 0.003 ND 30605 11.5
[image:4.595.89.544.319.497.2]Remarks: ND: Not detected.
Table 3.List of monitoring results of soil elements in rural areas (unit mg/Kg).
Sampling point
Projects and results
Fluoride As Cd Co Cr Cu Hg Mn Ni Pb Se Zn
A 452 ND ND ND 58 43 ND 572 ND 24 ND 83
B 361 ND ND ND 84 29 ND 560 33 20 ND 99
C 204 ND ND ND 74 15 ND 505 ND 20 ND 46
D 344 ND ND 195 88 33 ND 880 ND ND ND 69
E 382 ND ND 460 104 35 ND 1551 ND ND ND 56
F 189 ND ND 521 140 27 ND 2544 ND ND ND 24
G 293 ND ND 1195 198 42 ND 7306 ND ND ND 26
Remarks: ND: Not detected.
Table 4. A list of results of the monitoring results of soil organic chlorine pesticides in rural areas (unit: mg/Kg).
Sampling point
A list of results of the monitoring results of soil organic chlorine pesticides in rural areas (unit: mg/Kg).Projects and results
α-benzene hexachloride
β-benzene hexachloride
γ-benzene hexachloride
δ-benzene
hexachloride p,p’-DDD p,p’-DDE p,p’-DDT o,p’-DDT
A ND ND ND ND ND ND ND ND
B ND ND ND ND ND ND ND ND
C ND ND ND ND ND ND ND ND
D ND ND ND ND ND ND ND ND
E ND ND ND ND ND ND ND ND
F ND ND ND ND ND ND ND ND
G ND ND ND ND ND ND ND ND
[image:4.595.89.540.548.707.2]OALibJ | DOI:10.4236/oalib.1102690 5 May 2016 | Volume 3 | e2690
Table 5. List of monitoring results of soil elements in urban areas (pH < 6.5) (unit: mg/Kg).
Grid name pH V Cr Mn Co Ni Cu Zn As Se Cd Hg Pb
005 5.27 227 199 32,229 1866 ND 95 22 ND ND ND ND 165
509 6.07 98 76 257 ND ND 27 55 17 ND ND ND 14
306 6.33 370 77 6580 ND 67 37 68 23 ND ND ND 36
004 5.98 102 81 682 ND 30 42 104 17 ND ND ND 21
511 5.18 81 64 383 ND ND 28 52 ND ND ND ND 26
003 5.82 77 72 430 ND 51 29 68 11 ND ND ND 18
105 6.32 91 108 601 198 ND 39 77 ND ND ND ND 25
412 4.72 73 72 459 110 ND 18 38 9 ND ND ND 13
304 6.26 97 69 528 ND ND 31 78 ND ND ND ND 31
Standard limit (≤) / / 150 / / 40 50 200 40 / 0.30 0.30 250
Remarks: ND: Not detected.
Table 6.List of monitoring results of soil elements in urban areas (pH > 7.5) (unit: mg/Kg).
Grid name pH V Cr Mn Co Ni Cu Zn As Se Cd Hg Pb
708 8.40 114 77 673 ND 29 21 82 ND ND ND ND 24
708 8.40 133 83 742 ND 29 45 107 ND ND ND ND 35
601 7.72 98 53 551 ND 35 37 70 16 ND ND ND 18
707 8.01 76 77 569 ND ND 41 86 ND ND ND ND 24
801 8.12 99 87 539 ND 31 39 83 12 ND ND ND ND
701 7.55 94 127 668 ND 32 54 169 15 ND ND ND 47
603 7.72 105 77 846 ND 43 32 110 ND ND ND ND 23
706 7.85 87 72 613 ND 35 45 86 15 ND ND ND 26
805 7.68 108 74 555 ND ND 33 93 10 ND ND ND 18
308 8.06 101 69 614 ND 32 29 79 12 ND ND ND 16
211 7.93 89 54 448 ND ND 22 61 9 ND ND ND 13
107 7.82 113 104 758 ND ND 42 98 16 ND ND ND 21
712 7.94 91 86 665 ND 36 67 88 ND ND ND ND 26
413 8.04 106 76 740 ND 33 22 74 11 ND ND ND 23
605 7.77 99 43 578 ND 36 ND 73 ND ND ND ND 22
803 8.33 102 77 589 ND 40 55 89 ND ND ND ND 31
607 7.86 131 65 541 ND ND 82 321 23 ND ND ND 40
709 7.88 113 58 570 ND 42 32 90 14 5.5 ND ND 31
406 7.78 100 60 570 ND 52 37 84 ND ND ND ND 19
508 7.82 74 51 87 ND ND ND 37 17 ND ND ND 16
309 8.12 91 64 581 ND 28 41 84 ND ND ND ND 24
408 7.68 97 79 881 ND 42 98 182 ND ND ND ND 83
[image:5.595.88.537.310.725.2]OALibJ | DOI:10.4236/oalib.1102690 6 May 2016 | Volume 3 | e2690
Continued
502 7.63 86 85 547 ND 48 34 69 ND ND ND ND 24
612 7.56 108 41 395 ND 34 27 64 ND ND ND ND 17
409 7.74 90 102 594 ND ND 24 97 12 ND ND ND 20
705 7.78 88 67 478 ND ND 24 82 ND ND ND ND 30
802 7.67 87 70 722 ND 45 36 77 ND ND ND ND 30
202 7.84 115 52 510 ND ND 39 76 ND ND ND ND 22
204 8.25 111 73 650 ND 32 31 81 10 ND ND ND 13
106 7.90 87 52 639 ND ND 35 68 14 ND ND ND 18
804 8.08 108 81 677 ND 38 44 85 ND ND ND ND 27
307 8.18 95 60 623 ND 31 17 65 ND ND ND ND 15
510 7.83 110 98 1150 373 ND 32 67 ND ND ND ND ND
103 8.32 128 114 1549 571 ND 32 60 ND ND ND ND ND
104 7.79 193 216 2887 1050 ND 54 62 ND ND ND ND ND
109 7.70 154 243 5659 1201 ND 65 42 ND ND ND ND ND
108 7.81 128 217 5221 1182 ND 52 25 ND ND ND ND ND
506 7.84 229 309 7554 1638 ND 223 216 19 ND ND ND ND
110 7.66 169 258 13,001 1558 ND 56 22 ND ND ND ND ND
Standard limit (≤) / / 250 / / 60 100 300 25 / 0.60 1.0 350
[image:6.595.89.535.443.705.2]Remarks: ND: Not detected.
Table 7. List of monitoring results of soil elements in urban areas (pH = 6.5 - 7.5) (unit: mg/Kg).
Grid name pH V Cr Mn Co Ni Cu Zn As Se Cd Hg Pb
609 7.02 285 492 31,354 2676 ND 81 27 ND ND ND ND 86
410 7.44 161 224 6435 1977 ND 93 95 ND ND ND ND ND
703 7.41 78 152 579 ND 37 84 286 ND ND ND ND 86
310 6.86 84 64 133 ND 41 18 33 11 ND ND ND 20
402 7.20 110 89 580 ND ND 33 85 ND ND ND ND 17
702 7.46 114 77 554 ND 50 45 85 ND ND ND ND 21
711 7.32 100 88 682 ND ND 50 76 12 ND ND ND 25
312 6.95 101 59 520 ND 31 40 74 ND ND ND ND 22
203 7.20 75 46 519 ND ND ND 72 ND ND ND ND 55
710 7.29 100 72 551 ND 39 44 93 ND ND ND ND 24
206 7.12 117 82 574 ND 31 39 94 ND ND ND ND 30
208 7.26 102 75 452 ND ND 29 78 10 ND ND ND 26
313 7.15 89 50 400 ND ND 30 55 16 ND ND ND 22
207 7.22 93 89 536 ND ND 28 99 15 ND ND ND 21
Standard limit (≤) / / 200 / / 50 100 250 30 / 0.30 0.50 300
OALibJ | DOI:10.4236/oalib.1102690 7 May 2016 | Volume 3 | e2690
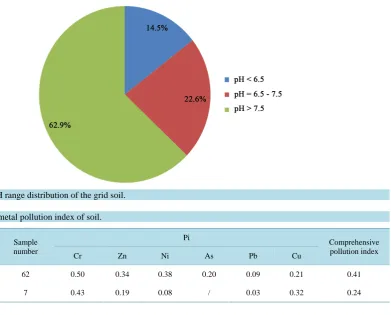
[image:7.595.148.540.81.396.2]Figure 1. The pH range distribution of the grid soil.
Table 8. Heavy metal pollution index of soil.
Area Sample number
Pi Comprehensive
pollution index
Cr Zn Ni As Pb Cu
City Proper 62 0.50 0.34 0.38 0.20 0.09 0.21 0.41
Countryside 7 0.43 0.19 0.08 / 0.03 0.32 0.24
From Table 8, it can be seen that the comprehensive pollution index of the rural soil and urban grid soil is less than 0.7, which means safe and clean. The single factor pollution index indicates the greatest single factor pollution index of Cr in Northern Yangtze River area, which shows that the main pollution factor in this area is Cr.
5. Conclusions
From the above investigations, the followings are concluded:
1) The contains of heavy metals and organ chlorine pesticides in the soil of the Northern Yangtze River area are low, abundant in the organics, N, P, K are obviously insufficient but in some areas the organic content is low and organic fertilizers should be added.
2) The total content of heavy metals in urban soils of Northern Yangtze River area is not very high, and the soil environment quality is good. In terms of the average pollutant index level of heavy metals, there is no pollu-tion, but the heavy metal content in some regions is high, which leads to relatively high potential hazard.
References
[1] Nogueira, T.A.R., Franco, A., He, Z., et al. (2013) Short-Term Usage of Sewage Sludge as Organic Fertilizer to Su-garcane in a Tropical Soil Bears Little Threat of Heavy Metal Contamination. Journal of Environmental Management, 114, 168-177.http://dx.doi.org/10.1016/j.jenvman.2012.09.012
[2] Ganyuan (2009) Geochemistry Characteristics of Heavy Metal Elements in the Soil and Its Quality Conditions, Peng-shan County, Sichuan, China. Chengdu University of Technology, Chengdu.
[3] Li, B.C. (2011) Evaluation on the Soil Environmental Quality and Risk Assessment for the Soil Pollution of Key Re-gions in Harbin. Northeast Forestry University.
[4] Zhou, Q.X. (2006) New Researching Progresses in Pollution Chemistry of Soil Environment and Chemical Remedia-tion. Environmental Chemistry, 3, 257-265.
OALibJ | DOI:10.4236/oalib.1102690 8 May 2016 | Volume 3 | e2690
[6] Xu, Z.Q., Ni, S.J., Zhang, C.J., et al. (2004) Assessment on Heavy Metals in the Sediments of Jinsha River in Panzhi-hua Area by Pollution Load Index. Sichuan Environment, 3, 64-67.
[7] Guo, Z.H., Xiao, X.Y., Chen, T.B., et al. (2008) Heavy Metal Pollution of Soils and Vegetables from Midstream and Downstream of Xiangjiang River. Acta Geographica Sinica, 1, 3-11.
[8] Zhan, J.Y. (2014) Study on the Basic Condition of Chongqing Farmland and the Main Characteristics of Fertility. Southwest University, Chongqing.
[9] Chinese Ministry of Agriculture (2006) Green Food-Guideline for Area’s Environmental Investigation and Assessment. NY/T 1054-2006. (In Chinese)