Munich Personal RePEc Archive
Welfare reform in the United States. A
descriptive policy analysis
Martin, Megan and Caminada, Koen
Department of Economics, Leiden University
2009
Online at
https://mpra.ub.uni-muenchen.de/20139/
Leiden Law School
Department of Economics Research Memorandum 2009.03
Welfare Reform in the United States. A descriptive policy
analysis.
Megan Martin and Koen Caminada
Correspondence to
Leiden Law School Department of Economics P.O. Box 9520
2300 RA Leiden The Netherlands Phone ++31 71 527 7756 Email: [email protected]
Website: www.economie.leidenuniv.nl
Editors
WELFARE REFORM I N THE UNI TED STATES.
A DESCRI PTI VE POLI CY ANALYSI S.
∗Megan Mart in
Leiden Law School
Econom ics Depart m ent , Leiden Universit y P.O. Box 9520, 2300 RA, The Net her lands
URL: www .hsz.leidenuniv.nl
E- m ail: m egcm art in@gm ail.com
Guest Resear cher
Koen Cam inada
Leiden Law School
Econom ics Depart m ent , Leiden Universit y P.O. Box 9520, 2300 RA, The Net her lands
URL: www .hsz.leidenuniv.nl
E- m ail: c.l.j .cam [email protected]
Professor of Em pir ical Analysis of Tax and Social Policy
Abst ract
Povert y alleviat ion is an im port ant obj ect ive of European count r ies and of t he Unit ed St at es. I f t hese ‘rich’ st at es offer elaborat e syst em s of incom e m aint enance, w hy is t here st ill a considerable am ount of povert y? And why are ant i- povert y out com es so different in t he Unit ed St at es com pared t o European count ries?
This paper com plet es a t rilogy of cross- count ry research papers on ant i- povert y policy. Two form er paper s analyzed t he effect s of social t ransfers on bot h povert y levels and povert y alleviat ion t hrough t ax and social t ransfer syst em s. These papers m arked t he Unit ed St at es as an out lier: high povert y rat es, low public social spending but high privat e social expendit ures, a rat her st rong belief t hat people are poor because of laziness or lack of will, and rem arkable differences across t he Federal St at es caused by st at e discret ion. Therefore, t his paper analyzes U.S. welfare in m ore det ail; we focus on part of t he m aj or welfare reform in 1996.
The 1996 welfare reform em phasizes an Am erican preference for work. I ndeed, t he welfare reform increased w ork, alt hough t he earnings of m ost individuals w ho left w elfare w ere st ill below t he povert y line, even m any years aft er t heir exit . A drawback of t his w ork- first approach is t he t erm inat ion of cash assist ance aft er 5 years, especially for vulnerable groups w it h low skills. Recent econom ic recession can cause severe t r oubles; one could - for ex am ple – ar gue t hat r ecipient s who reach t im e lim it s w it hout m eet ing w ork requirem ent s should be offered a chance t o w ork in com m unit y service j obs in ret urn for cash assist ance. We found huge variat ion of w elfare eligibilit y right s across st at es, depending on abilit y t o pay and pr eferences t o m eet a cert ain level of social st andard and ot her ( social) obj ect ives such as child care, work support and em ploym ent program s.
JEL- codes: H53, H55, I 32
Keywords: welfare reform , povert y
∗
“ No one who works full- t im e and has children at hom e should be poor anym ore. No one who can work should be able t o st ay on welfare forever.”
( President ial candidat e Clint on, 1992 cam paign speech)
“ I n t he absences of a renew ed ant ipovert y effort , m any households w ill cont inue t o be unable t o afford adequat e food, housing, and shelt er. Our high povert y rat e
cont ribut es t o an erosion of social cohesion, a wast e of t he hum an capit al of a port ion of our cit izenry, and t he m oral discom fort of condoning povert y am idst affluence.”
( Scholz, Moffit and Cowan, 2008, p. 31)
1. I NTRODUCTI ON
Povert y alleviat ion is an im port ant obj ect ive of t he European Union. The povert y problem is also st riking in ot her highly- developed welfare st at es, such as t he Unit ed St at es. I ndust rialized count ries spend a large share of t heir budget on incom e m aint enance, but povert y has not been eradicat ed. A sizable proport ion of t he populat ion lives in econom ic povert y in all indust rial welfare st at es. According t o t he m ost com m on st andards used in int ernat ional povert y analyses, on average roughly one in t en households live in relat iv e povert y in OECD count ries ( OECD, 2008) . The persist ence of povert y in indust rial welfare st at es calls for an explanat ion. I f t hese welfare st at es offer elaborat e syst em s of incom e m aint enance, w hy is t here st ill a considerable am ount of povert y? And why are ant i- povert y out com es so different in t he Unit ed St at es com pared t o European count ries?
This paper is part of a t rilogy of cross- count ry research papers on ant i- povert y policy. Two form er analyses report som e profound differences bet ween EU15 and non- EU15 count ries; t he Unit ed St at es is a special case ( Cam inada and Goudswaard, 2009 and 2010) . Bot h analyses t ook int o account 28 OECD count ries and dist inguished bet ween EU15 count ries and non-EU15 count ries t o invest igat e if bot h groups of count ries generat e ( dis) sim ilar ant i- povert y effect s w it h t heir syst em s of incom e t ransfers. The overall result of bot h quant it at ive st udies seem s t o be t hat t here is negat ive correlat ion bet w een povert y respect ively, povert y reduct ion, and social ex pendit ures across count ries over t he last 25 years, alt hough t his result depends on t he social spending indicat or used. The effect of t ax and t ransfer policies in reducing povert y is analyzed by com paring povert y rat es at t he level of m arket and disposable incom e, t hat is before and aft er social t ransfers, i.e. t o det erm ine t he t arget efficiency of social t ransfers across count ries. This kind of com parison m ay guide us t o cross-count ry differences on povert y alleviat ion.
across nat ions. He claim s t hat t he U.S. redist ribut ive pack age is t he prim e explainer of t he differences. Therefore, t his paper analyzes U.S. welfare in m ore det ail; we focus on a part of t he U.S.’s m aj or w elfare reform in 1996.
This paper com plet es our t rilogy of cross- count ry research on ant i- povert y policy. We first highlight w hy t he Unit ed St at es is an out lier am ong ‘rich’ count ries: high povert y rat es, low public social spending but high privat e social ex pendit ures, a rat her st rong belief t hat people are poor because of laziness or lack of will, and rem arkable differences across t he Federal St at es caused by st at e discret ion. Next , t his paper analyzes U.S. welfare in m ore det ail. The paper is organized as follows. Sect ion 2 present s som e background of t he com bat against povert y in Europe and in t he Unit ed St at es. Sect ion 3 gives a descript ive overview of t he U.S. safet y net . Next , we inv est igat e welfare reform in t he Unit ed St at es in m ore det ail in sect ion 4. Our reading of t he lit erat ure present s an overview of t he effect s of welfare reform in t he Unit ed St at es in sect ion 5. Sect ion 6 concludes.
2. POVERTY I N THE EUROPEAN UNI ON AND I N THE UNI TED STATES - I S THE U.S. DI FFERENT?
2.1 A world of difference
This sect ion highlight s som e of t he differences wit h regard t o social spending and povert y reduct ion bet ween t he U.S. and t he ot her OECD count ries. Clearly, nat ional preferences play a role in ex plaining t he differences in social spending across count ries, but t here m ay be ot her fact ors as w ell, such as t he st ruct ure of t he labor m arket , t he level of fract ionalizat ion ( race) , count ry size, and so on. I n t heir t im ely st udy of t he different approaches of Am erica and Europe t o t he problem s of dom est ic inequalit y and povert y, Alesina and Glaeser ( 2004) describe j ust how different Am erica and Europe are in t he level of St at e engagem ent in t he redist ribut ion of incom e. They discuss various possible econom ic explanat ions for t he difference, including different levels of pre- t ax incom e, openness of t he econom y, and social m obilit y . Moreover, t hey survey polit ico- hist orical differences such as t he varying phy sical size of nat ions, t heir elect oral and legal syst em s, and t he charact er of t heir polit ical part ies, as well as t heir experiences of war. Finally, t hey exam ine sociological explanat ions which include different at t it udes t o t he poor and not ions of social responsibilit y, as well as, m ost im port ant ly , at t it udes t o race. Alesina and Glaeser ( 2004) conclude t hat t he reasons why Am ericans and Europeans differ on t heir choices over welfare st at e and redist ribut ion run very deep int o t heir different hist ory and cult ure. No sim ple econom ic t heory provides a one- line answ er. I nst ead, et hnic het erogeneit y and polit ical inst it ut ions seem t o explain m ost of t he differences. Especially t he im port ance of et hnic fract ionalizat ion is em phasized by Alesina and Glaeser. Com pared t o Europe, t he U.S. is a highly het erogeneous societ y t hat is part icularly dist inguished by overrepresent at ion am ong t he poor of t he m ost visible and socially dist inct m inorit ies. As such, it has alway s been easy for opponent s of welfare t o use racial and et hnic divisions t o at t ack redist ribut ion ( p. 181) . Est im at es of Alesina and Glaeser ( 2004) show t hat racial fract ionalizat ion can explain approxim at ely one- half of t he differences in t he degree of redist ribut ion bet ween t he U.S. and Europe ( p. 13) .
2.2 Povert y rat es
I n t he European Union people are said t o be at risk of incom e povert y if t heir incom es are below 60 percent of t he m edian disposable incom e of households in t heir count ry , aft er adj ust ing for household size ( equiv alence scales) . For com parison, t he official Unit ed St at es povert y line was j ust about 30 percent of m edian Unit ed St at es disposable post - t ax household incom e in 2007.1 Based on t he EU- agreed definit ion, t he proport ion of t he EU15- populat ion
who was at risk of povert y in 2007 is 17 percent . The com parable figure for t he Unit ed St at es is higher: 24 percent .
The U.S. povert y t hreshold is based on an absolut e povert y st andard, which rem ains fixed over t im e in real t erm s. According t o U.S. povert y definit ion, 12.5 percent of t he populat ion was living in povert y in 2007. The U.S. official m easure of povert y is t ypically in t he form of t he cost of a basket of goods and services required t o assure m inim um living condit ions and indexed for price changes over t im e. While t he t hreshold is adj ust ed annually based on inflat ion using t he Consum er Price I ndex ( CPI - U) , t he m easure is absolut e and has been essent ially unchanged since it was developed by Mollie Orshansky at t he Unit ed St at es Social Securit y Adm inist rat ion in 1964 ( Nat ional Povert y Cent er, Universit y of Michigan) . The povert y t hreshold est im at es t he rat e of povert y in t he Unit ed St at es by det erm ining t he num ber of households whose annual incom e is below t he set t hreshold for t he household’s size. The det erm inat ion of povert y is m ade based solely on incom e and cash benefit s. Noncash benefit s, such as food st am ps and housing subsidies, are not included in t he det erm inat ion of a household’s povert y ( U.S. Census Bureau, 2007) .
Report s on relat ive pov ert y profiles for OECD count ries for t he lat est dat a year available consist ent ly show – in general - Scandinavian and Benelux count ries have t he lowest povert y rat es, follow ed by cont inent al European count ries. Anglo Sax on welfare st at es have relat ively higher povert y rat es. Am ong t hem , t he level of povert y is highest in t he Unit ed St at es.2
Using t he official absolut e povert y m easurem ent from t he U.S. ( Orshansky- povert y) alt ers t he pict ure t o som e ext ent . Not t en and De Neubourg ( 2007) est im at e t hat according t o t he Orshansky- m et hodology for years 1996 and 2000, t hat w hile U.S. has a high pov ert y rat e, it is not significant ly different from t he rat e est ablished in m ost European count ries using t he Orshansky m easure, while Greece, Spain and Port ugal have figures four t im es higher t han t he Unit ed St at es. I t should however be not ed t hat t heir result is rat her sensit ive for t he purchasing pow er parit y rat es used t o convert t he U.S. povert y lines t o count ry specific t hresholds of EU15.
I n spit e of differences in t he m easurem ent of povert y, m ost st udies have consist ent ly found t hat t here is a large difference in povert y rat es bet ween ( m ost ) European count ries and t he Unit ed St at es.
2.3 Ant i- povert y policy
Povert y alleviat ion has been a European obj ect ive since t he Treat y of Rom e in 1957. I n 2000 t he European Council adopt ed t he goal t hat in addit ion t o econom ic growt h, social cohesion should be st rengt hened in t he EU ( t he Lisbon Agenda) . The open m et hod of coordinat ion was int roduced as t he m eans of spreading best pract ices and achieving great er convergence t owards t he m ain EU- goals. Social indicat ors w ere developed t o m onit or t he im provem ent s wit h respect t o social cohesion. The Lisbon Agenda has renew ed t he int erest in povert y alleviat ion across m em ber st at es. However, t here is st ill a sizable proport ion of t he EU15 populat ion living in povert y ( 17 percent ) , alt hough bot h pov ert y st ruct ure and povert y rat es vary across count ries from 10 percent in t he Net herlands t o about 20 percent in Greece, I t aly and Spain. Moreover, t he average at - risk- of- povert y rat es – an official EU social cohesion indicat or – have risen since t he adopt ion of t he Lisbon Agenda.
The incom e povert y reduct ion goal for t he Unit ed St at es was officially declared by President Johnson in 1964: “ We cannot and need not wait for t he gradual growt h of t he econom y t o lift t his forgot t en fift h of our Nat ion above t he pov ert y line” ( Danziger, 2007, p. 3) . President Johnson’s 1964 St at e of t he Union speech em phasized st ruct ural fact ors as prim ary causes of povert y, including, “ ...our failure t o give our fellow cit izens a fair chance t o develop t heir own capacit ies, in a lack of educat ion and t raining, in a lack of m edical care and housing, in a lack of decent com m unit ies in which t o live....” . The pr evailing view at t hat t im e was t hat t he poor
2 See Cam inada and Goudswaard ( 2009 and 2010) for det ails. Dat a and analyses on povert y rat es and povert y allev iat ion am ong OECD count r ies are available from Cam inada’s webpage:
did not work because of excessive unem ploym ent or, if t hey did work , t hey earned an insufficient am ount in less- skilled j obs. I n spit e of t he pronounced “ War on Povert y” , incom e povert y was not elim inat ed by 1980, as planned. Even t oday, t he U.S. is far from fulfilling t he vision of t he “ War on Povert y” declared by President Johnson. What went wrong? Broadly speaking, m ost social scient ist s point at t hree ‘causes’. ( 1) Crit ics have blam ed t he growt h of ant ipovert y program s t hem selves. Especially t he Reagan- adm inist rat ion which crit icized t he adverse incent ives for w elfare recipient s t o accept ( low- ) paid j obs. ( 2) Ot her crit ics argued t hat elim inat ing incom e povert y w as not as im port ant a goal as changing t he personal behaviors of t he poor. ( 3) Several m acro- econom ic circum st ances ( oil shocks) failed t o deliver t he benefit s of econom ic growt h am ong U.S. societ y equally.
I t should be m ent ioned t hat t he European Union has em phasized t he m ult idim ensional nat ur e of deprivat ion, and have developed supplem ent ary indicat ors of pov ert y based on social indicat ors and t he broad concept of social exclusion. The European Union has defined com m on obj ect ives on social indicat ors - based on At kinson et al ( 2002) - t o be benchm arked by t he st ream lined Open Met hod of Coordinat ion. Bot h dat a and m easurem ent t echniques have been developed in order t o capt ure a variet y of dim ensions of deprivat ion beyond m oney incom e ( povert y) . On t he cont rary, t he Unit ed St at es solely focus on t he incom e dim ension of povert y, alt hough influent ial scient ist s argue t hat m oving t owards broader m easures of povert y t hat t ake int o considerat ion indicat ors of m at erial deprivat ion and social exclusion has a num ber of advant ages ( e.g. Havem an, 2008) .
2.4 Social spending and ant i- povert y effect s
[image:9.595.78.533.489.747.2]Table 1 provides a pict ure of povert y rat es and several social ex pendit ure rat ios for EU15 count ries and t he Unit ed St at es. Povert y rat es are from t he Luxem bourg I ncom e St udy ( 2009) and from OECD ( 2008) . Three relat ive povert y lines are applied, and incom e is adj ust ed using equivalence scales. The figures show t hat t he U.S. com bines relat ively high povert y rat es w it h rat her low social spending, albeit depending on t he social spending indict or used.
Table 1: Povert y rat es and social spending in EU15 count ries and in t he Unit ed St at es
Povert y t ot al populat ion Social expendit ure in % GDP, 2005
LI S ( around 2001) OECD ( 2003- 2005)
PL40 PL50 PL60 PL40 PL50 PL60
Gross public
Gross public and privat e
I dem ,
excluding
Healt h
Net public
and privat e
EU15 4.6 9.4 16.0 4.7 9.4 16.4 24.1 26.9 19.6 23.0
Aust ria 3.6 7.7 13.4 3.4 6.6 13.4 27.2 29.1 21.8 23.5
Belgium 3.7 8.1 16.1 3.1 8.8 16.2 26.4 30.9 23.1 26.8
Denm ark 2.3 5.6 13.2 2.1 5.3 12.3 26.9 29.5 23.5 21.6
Finland 2.5 6.5 13.5 2.8 7.3 14.8 24.0 25.1 18.7 19.5
France 2.8 7.3 13.7 2.8 7.1 14.1 29.2 32.2 23.0 29.0
Germ any 4.6 8.4 13.4 6.3 11.0 17.2 26.7 29.7 21.0 27.0
Greece 8.6 14.3 21.4 7.0 12.6 19.6 20.5 22.2 16.6 n.a.
I reland 7.4 16.2 22.5 7.0 14.8 23.3 16.7 18.1 11.0 16.1
I t aly 7.4 12.8 20.0 6.6 11.4 19.7 25.0 27.0 20.1 23.1
Luxem bourg 3.2 8.8 13.7 3.1 8.1 13.2 23.2 24.3 17.1 20.3
Net her lands 2.5 4.9 11.1 4.0 7.7 14.4 20.9 29.2 21.4 23.3
Port ugal n.a. n.a. n.a. 7.4 12.9 20.7 22.9 23.8 16.2 21.4
Spain 7.6 14.2 20.8 8.1 14.1 21.0 21.2 21.7 15.4 19.1
Sw eden 2.6 5.6 12.0 2.5 5.3 11.4 29.4 32.2 25.4 24.8
Unit ed Kingdom 5.4 11.6 19.2 3.7 8.3 15.5 21.3 28.4 20.4 25.9
Unit ed St at es 11.4 17.3 24.1 11.4 17.1 23.9 15.9 26.0 13.2 25.3
I n all OECD count ries, public cash benefit s and t axes significant ly reduce povert y. As report ed by OECD ( 2008, p. 291- 292) , m ost of t he redist ribut ion t ow ards people at t he bot t om of t he incom e scale is generally achieved t hrough public cash benefit s – w it h t he m ain except ion being t he Unit ed St at es, where a large part of t he support provided t o low- incom e fam ilies is adm inist ered t hrough t he incom e t ax syst em ( EI TC) . These cross- count ry differences in t he scale of redist ribut ion part ly reflect differences in t he size and st ruct ure of social spending. OECD count ries redist ribut e in a variet y of ways – som e t hrough univ ersal benefit s, ot her s wit h m ore t arget ed program s, som e prim arily relying on t ransfers, ot hers prim arily grant ing t ax rebat es t o low- incom e fam ilies.
Cam inada and Goudswaard ( 2009) calculat e t he reduct ion of povert y rat es of m arket incom e and disposable incom e across 25 OECD count ries. They show t hat EU15 count ries generat e an ant ipovert y effect of 19.0 percent age point s on average, while non- EU15- count ries produce on average a lower ant ipovert y effect of 14.7 percent age point s am ong t heir populat ion. On t he bot t om of t he count ry rankings we find Korea and t he Unit ed St at es wit h ant ipovert y effect s of less t han 10 percent age point s.
Each percent age point of t ot al social expendit ure alleviat es povert y in EU15 by .7 percent age point s on average. A m uch lower score is found for t he Unit ed St at es ( .35) . The t arget ed effect iveness of t he Unit ed St at es is rem arkably low, and lies j ust below half of t he average of all count ries. Two specific fact ors seem t o be of im port ance. First , a t hreshold of 50 percent of m edian incom e is applied, w hile U.S. social policies t arget lower levels of incom e t o lift people out of povert y. Second, t he Unit ed St at es devot es t he sm allest share of it s resources t o public
ant ipovert y incom e t ransfer program s across t he count ries exam ined ( cf. Sm eeding, 2005) . However, when pr ivat e social expendit ures are also t aken int o account , t his pict ure changes. I n t hat case, t he Unit ed St at es rank s fift h when all 25 count ries are ordered on t he basis of t heir level of t ot al social expendit ures. Therefore, public versus privat e social expendit ures m ay have opposit e ant ipovert y effect s ( cf. Cam inada and Goudswaard, 2005) . I n any case, t he large cross- count ry differences in t he ant ipovert y effect of social t ransfers and t axes – wit h except ionally low scores for t he U.S. - call for furt her inv est igat ion.
2.5 Nat ional preferences for social spending
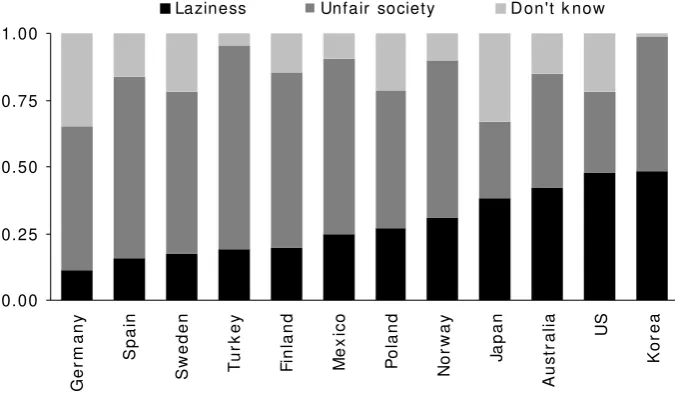
Nat ional preferences for social prot ect ion differ subst ant ially across count ries. Anglo- Saxon count ries do not seem t o be prepared t o sust ain t he high prot ect ion lev els prevailing in ot her count ries wit h t he sam e levels of incom e. Sw abish et al ( 2006) assem bled dat a t o exam ine t he cross- nat ional effect s of incom e inequalit y and t rust on social ex pendit ures. Their result s suggest t hat as t he ‘rich’ becom e m ore dist ant from t he m iddle and lower classes; t hey find it easier t o opt out of public program s and t o buy subst it ut es for social insurance in t he privat e m arket . These cult ural differences wit hin t he group of OECD count ries could point t o variance in t he ant ipovert y nat ure of social sy st em s as well. Anglo- Sax on welfare st at es ( especially t he Unit ed St at es) rely m ore heavily on privat e social arrangem ent s as far as pensions, healt h care and ot her program s are concerned ( Super, 2008) . How ever, privat e social program s m ay generat e a m ore lim it ed redist ribut ion of resources t han public ones, and t ax advant ages t owards privat e pension and healt h plans are m ore likely t o benefit t he rich. Moreover, t he burden of povert y on individuals and fam ilies depends not j ust on it s size but also on how ot hers in societ y view it s nat ure, in part icular whet her povert y is perceived as t he result of individual at t it udes or of t he w ay societ y is organized ( OECD, 2008, p. 131) . Figure 1 show s t he share of respondent s w ho believ e t hat people are poor because of laziness or lack of will, on one side, or because societ y is unfair, on t he ot her. I n general, t he share of respondent s who believe t hat povert y reflect s laziness is great er in t he Unit ed St at es t han in t he Nordic and Cont inent al European count ries.3
Figure 1: Subj ect ive at t it udes t o povert y - share of respondent s at t ribut ing povert y t o different reasons
0.00 0.25 0.50 0.75 1.00 G e rm a n y S p a in S w e d e n T u rk e y F in la n d M e x ic o P o la n d N o rw a y Ja p a n A u s tr a li a U S K o re a
Laziness Unfair society D on't k now
Source: OECD ( 2008, p. 131)
2.6 Policy Coordinat ion Mechanism t o Com bat Povert y
I n Decem ber 2000, t he Nice European Council launched t he open m et hod of coordinat ion on social inclusion ( soft law ) . This governance m et hodology was m odeled on t he t reat y- based European Em ploym ent St rat egy and includes agreem ent on com m on EU obj ect ives and ( incom e povert y) indicat ors, t he adopt ion of Nat ional Act ion Plans on I nclusion, and periodic m onit oring and peer review . I t should be not ed t hat ‘coordinat ion’ is a m ercurial t erm in t he cont ex t of OMC ( Arm st rong, 2006) ; however, policy com pet ence rem ains wit h t he m em ber st at es.
I n t he Unit ed St at es, responsibilit y for ant ipovert y policy has shift ed since 1996 from t he ant ipovert y agencies of t he federal governm ent t o t he individual U.S. st at es and t o t he t ax code ( EI TC) . The Personal Responsibilit y and Work Opport unit y Reconciliat ion Act of 1996 provides block grant s t o st at es wit h few rest rict ions. St at es w ere required t o spend at least 75 percent of t heir previous level of welfare spending, and st at es had t o m eet t arget s for m oving recipient s int o work act ivit ies. Thus, t he European Union em ploys “ soft law” as a policy coordinat ion m echanism , while in t he U.S. “ hard law” is applied. Furt herm ore, while t he m aj orit y of welfare funding is provided by t he federal governm ent in t he Unit ed St at es, an above- st at e budget for povert y alleviat ion is lacking in Europe, based on t he principle of subsidiarit y. Finally , policy goals for reducing povert y rat es are rat her vague and do not aspire t o a specified t arget on eit her side of t he At lant ic.
3. U.S. SAFETY NET
3.1 Mean- t est ed benefit s4
Just as a prim er, t his sect ion highlight s t he U.S. safet y net . We focus solely on t he m ain m ean- t est ed benefit s, because t hese program s have explicit ant ipovert y goals. Means- t est ed program s are financed by general t ax revenues; all rest rict benefit s t o t hose whose incom es and or asset s fall below an est ablished t hreshold. Som e are ent it lem ent s - all who sat isfy t he st ipulat ed eligibilit y requirem ent s get benefit s, regardless of t he t ot al budget ary cost ( e.g.
com plex m ix t ure of cynicism and com passion; m isinfor m ed and racially charged, t hey nevert heless reflect bot h a dist r ust of welfare recipient s and a desir e t o do m ore t o help t he " deserv ing" poor.
Food St am ps) . Ot her m eans- t est ed program s provide benefit s only unt il t he funds Congress or a st at e has allocat ed are spent even if som e eligible part icipant s are not served ( e.g. TANF) .
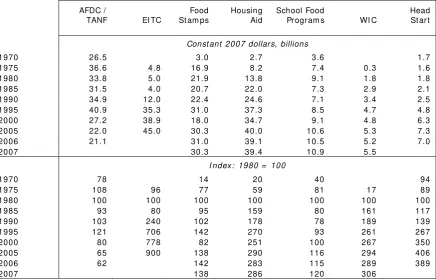
[image:12.595.78.515.240.520.2]Table 2 sum m arizes t he evolut ion of m eans- t est ed ( ant ipov ert y) spending.5 Not e t hat t here has been a sharp reduct ion in cash ent it lem ent s for poor fam ilies in past decades in t he Unit ed St at es. The nat ure of program s has changed as well. Cash welfare benefit s, for exam ple, have been t ied t o work requirem ent s, part ly in response t o evolving view s about t he nat ure of t he povert y problem . Responsibilit y for ant ipovert y policy has broadened from t he ant ipovert y agencies of t he federal governm ent t o t hose in t he U.S. st at es and t o t he t ax code, as evidenced by t he Earned I ncom e Tax Credit ( EI TC) .
Table 2: Tot al m eans- t est ed benefit s by program , 1970- 2007
AFDC /
TANF EI TC Food St am ps
Housing Aid
School Food
Program s WI C Head St art
Const ant 2007 dollar s, billions
1970 26.5 3.0 2.7 3.6 1.7
1975 36.6 4.8 16.9 8.2 7.4 0.3 1.6
1980 33.8 5.0 21.9 13.8 9.1 1.8 1.8
1985 31.5 4.0 20.7 22.0 7.3 2.9 2.1
1990 34.9 12.0 22.4 24.6 7.1 3.4 2.5
1995 40.9 35.3 31.0 37.3 8.5 4.7 4.8
2000 27.2 38.9 18.0 34.7 9.1 4.8 6.3
2005 22.0 45.0 30.3 40.0 10.6 5.3 7.3
2006 21.1 31.0 39.1 10.5 5.2 7.0
2007 30.3 39.4 10.9 5.5
I ndex: 1980 = 100
1970 78 14 20 40 94
1975 108 96 77 59 81 17 89
1980 100 100 100 100 100 100 100
1985 93 80 95 159 80 161 117
1990 103 240 102 178 78 189 139
1995 121 706 142 270 93 261 267
2000 80 778 82 251 100 267 350
2005 65 900 138 290 116 294 406
2006 62 142 283 115 289 389
2007 138 286 120 306
Abbreviat ions:
AFDC = Aid t o Fam ilies w it h Dependent Children TANF = Tem porary Assist ance for Needy Fam ilies EI TC = Earned I ncom e Tax Credit
WI C = supplem ent al nut rit ion program for wom en, infant s and children
Source: Scholz et al ( 2008, pp. 48- 49)
Aid t o Fam ilies w it h Dependent Children ( AFDC) was t he cent ral safet y net program for poor fam ilies wit h children from 1936 t o 1996. This program was direct ed prim arily at single-parent fam ilies, t hough som e t wo- single-parent fam ilies w it h an unem ployed single-parent received benefit s. I n 1996 t he Tem porary Assist ance for Needy Fam ilies Block Grant ( TANF) was creat ed. A 5- year lifet im e lim it w as im posed on receipt cash assist ance ( som e hardship exem pt ions were allow ed) , and st at es had t o m eet t arget s for m oving recipient s int o work act iv it ies. Not e - for now - t hat benefit s for ADFC/ TANF declined from a peak of about $40 billion in 1995 t o about $21 billion in 2006.
I n cont rast , expendit ures on t he earned incom e t ax credit ( EI TC) have grown sharply from $5 billion in 1975 t o $45 billion in 2005. No ot her federal ant ipovert y program has grown so rapidly. The EI TC is now US’s largest cash ant ipovert y program . The incent ives em bedded in
t he EI TC differ from t hose in AFDC/ TANF. AFDC recipient s wit h no earnings received t he largest w elfare paym ent s. I n cont rast , t he EI TC encourages low- skilled workers t o ent er t he labor m arket , since non- earners do not receive t he credit and t he EI TC am ount rises wit h earnings up t o about t he povert y line.
The safet y net for low- incom e fam ilies includes in- kind benefit program s, t he largest of which are food st am ps, housing assist ance, Head St art , school nut rit ion program s and t he special supplem ent al nut rit ion program for wom en, infant s and children ( WI C) .
Food st am ps are designed t o enable low- incom e households t o purchase a nut rit ionally adequat e low- cost diet . Bet ween 1994 and 2000, real food st am p expendit ures fell t o $18 billion from $32 billion, even t hough only m odest changes t o food st am p program rules w er e m ade by t he 1996 welfare reform . Food st am p part icipat ion and spending increased sharply bet ween 2000 and 2005. Fact ors affect ing t hese developm ent s include increases in t he num ber of poor people over t his period, and t he use of food st am ps as federal disast er aid for Hurricanes Kat rina, Rit a, and Wilm a as well as ot her nat ural disast ers.
The safet y net housing assist ance program s assist aid in t wo principal form s: proj ect - based aid, where subsidies are t ied t o unit s const ruct ed for low- incom e households, and household-based subsidies, where rent ers choose housing unit s in t he exist ing privat e housing st ock. The school lunch and breakfast program s provide federal support for m eals served by public and privat e nonprofit elem ent ary and secondary schools and resident ial child care inst it ut ions t hat enroll and offer free or reduced- price m eals t o low- incom e children. The special supplem ent al nut rit ion program for wom en, infant s and children ( WI C) provides vouchers for food purchase, supplem ent al food, and nut rit ion risk screening and relat ed nut rit ion orient ed serv ices t o low- incom e pregnant wom en and low- incom e w om en and t heir children ( up t o age 5) .
Head St art is an early childhood educat ion program t o im prove social com pet ence, learning skills, healt h and t he nut rit ion st at us of low- incom e children so t hat t hey can begin school on an equal basis wit h t heir m ore advant aged peers.
3.2 Case loads and povert y effect
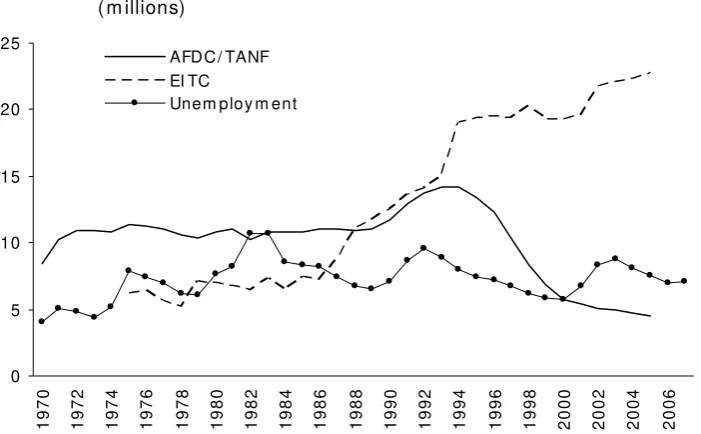
The U.S. safet y net has changed in st riking w ays for t he nonelderly; Table 2 show ed t he reduct ion in AFDC/ TANF expendit ures, which hist orically went t o non- workers, and t he increase in EI TC benefit s, which go overwhelm ingly t o low- incom e workers wit h children. The welfare reform of 1996 encouraged welfare recipient s of t he form er ADFC t o ent er t he labor m arket . The t ight er eligibilit y rules of TANF and policy orient at ed increases of t he EI TC – in com binat ion wit h rapid econom ic growt h - ‘caused’ a sharp decrease in t he num ber of welfare recipient s since 1996. However, t he decline of t he num ber of welfare recipient s ( AFDC/ TANF) from 12.3 m illion t o 4.5 m illion in t he period 1996- 2005 ( 63 percent ) didn’t change unem ploym ent t hat m uch during t his period; see Figure 2.
Welfare- dependency fell sharply over 50 percent in a few years, w hile t he EI TC account ed for an increase of low- skilled j obs; see Figure 2.6 St udies have shown t hat t he EI TC has encouraged large num bers of single parent s t o leave welfare and ent er int o work. The Com m it t ee for Econom ic Developm ent , an organizat ion of 250 corporat e execut ives and universit y president s, concluded in 2000 t hat “ [ t ] he EI TC has becom e a powerful force in
6 The Earned I ncom e Tax Credit ( EI TC) is a t ax benefit for low- and m oderat e- incom e wor kers t hat helps t o offset t heir pay roll and incom e t axes. Very low- wage work ers can also receiv e an incom e supplem ent t hrough t he EI TC: if t he size of t he cr edit ex ceeds t he am ount of t ax ow ed, an indiv idual will r eceive t he difference ( in t he form of a refund check ) . Twent y - four St at es have est ablished t heir ow n EI TCs t o
supplem ent t he federal EI TC. Working fam ilies wit h childr en t hat have annual incom es below about $34,000 t o $41,000 ( depending on m arit al st at us and t he num ber of children in t he fam ily) gener ally are eligible for t he EI TC. Also, poor workers wit hout childr en t hat have incom es below about $13,000 ( $16,000 for a m arried couple) can r eceive a very sm all EI TC ( Cent er on Budget and Policy Prior it ies, 2008) .
dram at ically raising t he em ploym ent of low- incom e wom en in recent y ears.” I n 2005, t he EI TC lift ed 5.0 m illion people out of povert y, including 2.6 m illion children. Wit hout t he EI TC, t he povert y rat e am ong children would have been nearly one- fourt h higher. The EI TC lift s m ore children out of povert y t han any ot her single program or cat egory of program s ( Cent er on Budget and Policy Priorit ies, 2008) .
Figure 2: Num ber of recipient s AFDC/ TANF and EI TC, and Unem ploym ent , 1970- 2007 ( m illions)
0 5 10 15 20 25 1 9 7 0 1 9 7 2 1 9 7 4 1 9 7 6 1 9 7 8 1 9 8 0 1 9 8 2 1 9 8 4 1 9 8 6 1 9 8 8 1 9 9 0 1 9 9 2 1 9 9 4 1 9 9 6 1 9 9 8 2 0 0 0 2 0 0 2 2 0 0 4 2 0 0 6
AFDC / TANF EI TC
Unem ploy m ent
Source: Scholz et al ( 2008, pp. 50- 51) ; see Annex B for det ails.
A recent evaluat ion by Danziger ( 2009) suggest s t hat , in it s first few years, t he 1996 welfare reform was m ore successful in som e dim ensions ( not ably, reducing caseloads) t han in ot hers ( raising disposable incom e) . The dram at ic caseload decline has not caused t he surge in povert y or hom elessness t hat m any crit ics of t he 1996 Act predict ed, because m ost form er recipient s are finding j obs. Even t hough m any w elfare leavers are not working t im e, full-year, and m any are working at low- wage j obs, a significant num ber are earning at least as m uch as t hey had receiv ed in cash welfare benefit s and som e now have higher net incom e. However, despit e t he large caseload reduct ion, t he U.S. pov ert y rat e has fallen rat her lit t le. Many who have left welfare for work rem ain poor and cont inue t o depend on Food St am ps, Medicaid, and ot her governm ent assist ance; ot hers have left welfare and rem ain poor but do not receive t he Food St am p or Medicaid benefit s t o which t hey rem ain ent it led. The ext ent of econom ic hardship rem ains high because, m any form er and current welfare recipient s hav e lim it ed earnings prospect s in a labor m arket t hat increasingly dem ands higher skills. For exam ple, t he end of ent it lem ent has m eant t hat som e single m ot hers, wit h poor labor m arket prospect s and no ot her m eans of support , have not receiv ed t he benefit s t hey would have under t he pre- 1996 w elfare sy st em . For single m ot hers w it h a high school degree or less, despit e t heir increased work hours and earnings over t he last decade, about 43 percent rem ain poor by t he official definit ion ( Danziger, 2007, p. 9) .
3.3 Social spending
Bet ween 1975, t he first year t he EI TC exist ed, and 2005, t ot al spending on all m eans- t est ed cash and in- kind t ransfers in Table 2 averaged 2.0 percent of GDP, ranging bet ween 1.8 and 2.5 percent . I n 2005, it was 1.8 percent of GDP, near it s 31- year low . These pat t erns are driven by subst ant ial changes in t he ant ipovert y policy m ix. Why has U.S. ant i- povert y spending been low and relat ively st able given it s persist ent and high pov ert y rat es?
near- cash, and housing expendit ures) as a percent age of GDP for five groups of count ies – Scandinav ia; Nort hern Cont inent al Europe; Cent ral and Sout hern Europe; “ Anglo” ( Aust ralia, Canada, and t he U.K.) ; and t he Unit ed St at es – bet w een 1980 and 1999. Spending ranges bet ween 2.7 t o 3.6 percent of GDP in t he U.S., a far low er level t han every ot her count ry group. The ot her Anglo count ries av eraged bet w een 4.8 and 7.8 percent of GDP, sim ilar t o t he Cent ral and Sout hern European count ies. Nort hern Europe and t he Scandinavian count ries averaged bet w een 8.1 and 15.3 percent of GDP. The t rends across count ry groups vary , t hough m ost count ry groups increased expendit ures as a share of GDP bet w een 1980 and 1999. The U.S. did not .
3.4 Personal Responsibilit y and Work Oppor t unit y Reconciliat ion Act
From 1935 unt il 1996 t he cent erpiece of t he Unit ed St at es Federal Governm ent ( U.S.F.G.) welfare policy was a program ent it led Aid t o Fam ilies wit h Dependent Children ( AFDC) whose principal benefit was t he provision of cash assist ance t o needy fam ilies. I n 1996, how ever, t he U.S.F.G. dram at ically shift ed it s povert y reduct ion st rat egies by im plem ent ing large- scale social w elfare reform aim ed at m ak ing ‘w elfare a t ransit ion t o work’ by officially becom ing a t em porary assist ance program ( U.S. Depart m ent of Healt h and Hum an Services, 1996) .7 The
legislat ive basis for t he reform w as t he Personal Responsibilit y and Work Opport unit y Reconciliat ion Act of 1996 ( PRWORA) .8 The PRWORA t erm inat ed t he AFDC program .9 I n place of AFDC, PRWORA int roduced a new program known as Block Grant s for Tem porary Assist ance for Needy Fam ilies ( TANF) .
There are significant differences bet ween TANF and t he AFDC program t hat it supplant ed in 1996. TANF m arked a break from t he policy obj ect ives, eligibilit y rules, funding, t im e lim it at ions and work requirem ent s under AFDC. The changes have had serious im plicat ions for t he fam ilies who cont inue t o receive benefit s under TANF as well as for t hose fam ilies who no longer part icipat e. I n t he Unit ed St at es t oday, 13 years aft er t he PRWORA was passed and TANF replaced AFDC, it is not clear t hat t he reform has achieved t he int ended result s ( Danziger, 2009) .
The rem ainder of t his working paper det ails t he m ost significant differences bet ween AFDC and TANF. We begin by exam ining t he underly ing t enant s and policy obj ect ives of t he t wo program s including t he im pact t hat increased U.S. St at e discret ion has had on w elfare in t he Unit ed St at es. Follow ing t he policy overview, t he paper surveys t he lit erat ure evaluat ing t he successes and failures of welfare reform . Finally, t he paper considers som e of welfare reform ’s unint ended consequences and t he overall im pact of welfare reform on t he U.S.’s neediest fam ilies.
4. POLI CY OVERVI EW
The passage of t he Personal Responsibilit y and Work Opport unit y Reconciliat ion Act of 1996 was incredibly cont roversial. I t was considered by m any in t he social policy and polit ical com m unit ies t o be t oo great a com prom ise wit h very conservat ive m em bers of t he Unit ed St at es Congress; even leading t o t he resignat ion of several president ial advisors and officials
7 Welfare refor m included a series of policy changes, m ost not ably t he passage of t he Per sonal Responsibilit y and Work Opport unit y Act of 1996. For t his paper, welfare reform refer s t o a com ponent of t hat Act , Tem porary Assist ance for Needy Fam ilies, and it s relat ionship t o t he pr ior law, Aid t o Fam ilies wit h Dependent Children.
8 The Personal Responsibilit y and Work Opport unit y Act of 1996, included t he Tem porary Assist ance t o Needy Fam ilies Block Grant s as a com ponent , which is t he prim ar y m at t er of discussion in t his paper. How ever, t he legislat ion’s passage also included alm ost 55 m illion dollar s in cut s t o low - incom e assist ance program s including: food st am ps, benefit s t o legal im m igrant s, and t he SSI program for childr en wit h disabilit ies. PRWORA also included a child support enforcem ent syst em as well as provided m andat or y funds ( $50 m illion annually) in abst inence educat ion funding.
at t he Unit ed St at es Depart m ent of Healt h and Hum an Services. One such advisor, form er assist ant secret ary of children and fam ilies, Mary Jo Bane, in an art icle t it led “ Welfare as We Might Know I t ,” in The Am er ican Prospect ( January/ February 1997) , st at ed, “ The public, right ly, w ant ed welfare reform t hat expect ed w ork and parent al responsibilit y . The polit ical rhet oric support ing t he new law, unfort unat ely , m ade t he concept of a federal ent it lem ent synonym ous wit h irresponsibilit y and lifelong dependency, and t he replacem ent of t he ent it lem ent wit h block grant s sy nonym ous wit h work requirem ent s. This rhet oric was m isleading but powerfully effect ive.” ( Cabe, 2002) .
4.1 Policy obj ect ives
The underly ing purpose of U.S.F.G. welfare policy has alw ays been t o reduce povert y by providing assist ance t o t he count ry’s neediest fam ilies. While t his fundam ent al m ission rem ained unchanged following t he welfare reform of 1996, t he policy t ools used t o achieve t hat m ission, and t he program s im plem ent ed, changed significant ly w it h t he passage of t he PRWORA. The replacem ent of t he count ry ’s prim ary cash assist ance program , from AFDC t o TANF, represent ed not only a change in nam e, but a serious policy shift t hat revised povert y reduct ion st rat egies t hroughout t he Unit ed St at es.
AFDC w as est ablished t hrough t he Social Securit y Act of 1935. The policy’s obj ect iv e was t o reduce povert y t hrough t he provision of cash w elfare t o needy children suffering from lack of parent al support due t o t heir m ot her or fat her being incapacit at ed, deceased, absent from t he hom e or unem ployed ( U.S. Depart m ent of Healt h and Hum an Services, 2004) . AFDC was accom panied by em ploy m ent t raining and educat ion program called t he Job Opport unit ies and Basic Skills Program ( JOBS) and an em ergency cash assist ance program called Em ergency Assist ance ( EA) .10 Alt hough t he funding for t hese program s w as separat e from AFDC funding, individuals could part icipat e in t he JOBS program only if t hey also part icipat ed in AFDC ( U.S. Depart m ent of Healt h and Hum an Services, 1996) .
AFDC was adm inist ered and superv ised by U.S. St at es but was st rongly regulat ed according t o guidelines issued by t he U.S.F.G. The U.S.F.G. est ablished eligibilit y rules for t he AFDC program , w hile t he individual U.S. St at es set t heir own benefit levels and est ablished incom e and resource lim it s ( U.S. Depart m ent of Healt h and Hum an Services, 2004) . AFDC benefit levels est ablished by U.S. St at es w ere required t o be uniform ly applied t o all fam ilies wit h sim ilar circum st ances w it hin t he St at e ( U.S. Depart m ent of Healt h and Hum an Services, 1996) .
I n 1996, under t he Clint on Adm inist rat ion, t he passage of t he PRWORA cam e wit h t he prom ise t o “ change welfare as w e know it ” ( The Urban I nst it ut e, 2006) . The principal vehicle for achieving t his change was t he int roduct ion of TANF t o replace AFDC. TANF t erm inat ed open- ended welfare funding and inst it ut ed a block grant program providing each U.S. St at e m eet ing cert ain crit eria wit h a fixed sum and increased flexibilit y in policy choice. AFDC was considered open- ended because U.S. St at es were ent it led t o reim bursem ent from t he U.S.F.G. wit hout a funding cap ( U.S. Depart m ent of Healt h and Hum an Services, 2004) . I n cont rast , TANF is adm inist ered as a block grant program in which U.S. St at es are provided wit h a det erm ined am ount of Federal funding but allowed great er discret ion over t he way t he funding is spent . As an ideological m at t er, whereas AFDC focused prim arily on providing fam ilies w it h t he m eans t o surv ive, TANF em phasizes em ploym ent and m akes welfare t em porary in nearly all cases ( Golden, 2005) .
Through TANF U.S. St at es use U.S.F.G. block grant s t o operat e t heir own progr am s. St at es can use TANF dollars in ways designed t o m eet any of t he four policy obj ect ives set out in t he Federal law ( Covin, 2005) , which are t o: ( 1) provide assist ance t o needy fam ilies so t hat children m ay be cared for in t heir own hom es or in t he hom es of relat ives; ( 2) end t he dependence of needy parent s on governm ent benefit s by prom ot ing j ob preparat ion, work , and m arriage; ( 3) prevent and reduce t he incidence of out - of- wedlock pregnancies and
est ablish annual num erical goals for prevent ing and reducing t he incidence of t hese pregnancies; and ( 4) encourage t he form at ion and m aint enance of t wo- parent fam ilies.
The shift from AFDC t o TANF m arked m ore t han a m ove from an open- ended cash- assist ance program t o a t em porary- assist ance program . TANF also int roduced t he pract ice of allowing welfare funding for program s aim ed at influencing t he fam ily st ruct ure, including fam ily planning and t wo- parent - fam ily m aint enance program s. This change reflect s a shift in povert y reduct ion st rat egies in t he Unit ed St at es. Whereas AFDC was designed t o provide needy fam ilies w it h cash t ransfers t hat would supplem ent or replace em ploym ent incom e, TANF focused on t he im port ance of work as well as at t em pt ing t o fost er nuclear fam ilies as a way t o provide fam ily econom ic st abilit y .
4.2 The role of st at e discret ion
PRWORA provided U.S. St at es wit h unprecedent ed discret ion over welfare program m ing and funding. Under TANF, t here are no Federal rules t hat det erm ine t he am ount of TANF cash benefit s t hat m ust be paid t o a part icipat ing fam ily. Addit ionally, t here are no Federal rules t hat require U.S. St at es t o use TANF t o pay fam ilies cash benefit s at all, however, all St at es do ( Falk, 2007) . Benefit am ount s are det erm ined solely by t he U.S. St at es. The discret ion provided t o St at es t hrough TANF has allowed for a great diversit y in t he way t hat welfare program s ar e funded and adm inist ered across t he count r y. Each U.S. St at e has differ ent init ial eligibilit y t hresholds, benefit paym ent am ount s, and fund allocat ions.11
According t o Falk of t he Congressional Research Service ( 2007) , in January of 2005, for t he average cash welfare fam ily ( a fam ily of t hree) , t he m axim um m ont hly benefit in t he m edian st at e was $389, wit h a range from $923 in Alaska t o $170 in Mississippi ( Falk, 2007) . The m axim um m ont hly cash benefit is usually paid t o a fam ily t hat receives no ot her incom e ( no earned or unearned incom e) and who com plies w it h program rules. Fam ilies w it h incom e ot her t han TANF are oft en paid a reduced benefit am ount . The diversit y in program adm inist rat ion also ext ends t o t he init ial eligibilit y t hreshold. I nit ial eligibilit y t hresholds for fam ilies of t hree range from $1,641 in Haw aii t o $269 in Alabam a ( Welfare Rules Dat abase, 2006) .
St at e discret ion has also creat ed significant div ersit y in t he way t hat TANF dollars are spent across t he U.S. St at es part icularly wit h reference t o t he lev el of cash benefit s provided. The variat ion in t he use of TANF funding spent on cash assist ance ranges from 64 percent in Maine t o only 12 percent in I llinois ( Falk, 2007) . Sim ilarly, w hile several U.S. St at es decline t o spend any of t heir TANF dollars on Fam ily Form at ion program s such as encouraging t wo-parent fam ilies and decreasing out - of- wedlock birt hs, New Jersey allocat es 34.8 percent of it s TANF dollars on Fam ily Form at ion ex pendit ures ( Falk, 2007) .
The discret ion provided t o U.S. St at es t hrough t he passage of t he 1996 welfare law allowed for a huge am ount of variet y in program and funds adm inist rat ion, wit h very few Federal guidelines. Subsequent ly, t here are different w elfare program s being adm inist ered in every U.S. St at e. These program s are hav ing m ixed result s in aiding t he fam ilies w ho, current ly or form erly, receive assist ance t hrough TANF and m ake it difficult t o evaluat e w elfare reform s success as a whole.
Several com m ent at ors feared t hat TANF m ight set off a “ race t o t he bot t om ,” where st at es, fearful of at t ract ing low- incom e fam ilies from ot her st at es, m ight low er benefit s, which in t urn would cause ot hers st at es t o lower t heirs. I n fact , t ot al AFDC/ TANF spending on cash benefit s declined from a peak of about $40 billion in 1995 t o about $21 billion in 2006 ( Table 2) , but t his reduct ion is roughly proport ional t o t he w elfare caseload reduct ion ( Scholz et al, 2008, p. 10) .
4.3 Funding
Under TANF, t he funding relat ionship bet ween t he U.S.F.G. and t he individual U.S. St at es changed. The drast ically increased level of St at e discret ion over Federally grant ed funds changed t he ways in which St at es governm ent s were spending welfare dollars and t he degree t o which t he U.S.F.G w as prov iding funding t o t he st at es. By allocat ing block grant funding t o U.S. St at es, TANF rem oved alm ost all Federal eligibilit y and paym ent rules and prov ided U.S. St at es wit h wide discret ion over program m ing, as well as t he right t o deny benefit s t o fam ilies ( Blank, 2002) .
Under AFDC, U.S St at es were ent it led t o unlim it ed Federal funds. The Federal gov ernm ent provided reim bursem ent of benefit paym ent s at " m at ching" rat es t hat were inversely relat ed t o a U.S. St at e‘s per capit a incom e ( U.S. Depart m ent of Healt h and Hum an Services, 2004) . U.S. St at es were required t o provide aid t o all persons who were eligible under t he Federal law and whose incom e and resources were wit hin t he st at e- set lim it s ( U.S. Depart m ent of Healt h and Hum an Serv ices, 1996) .
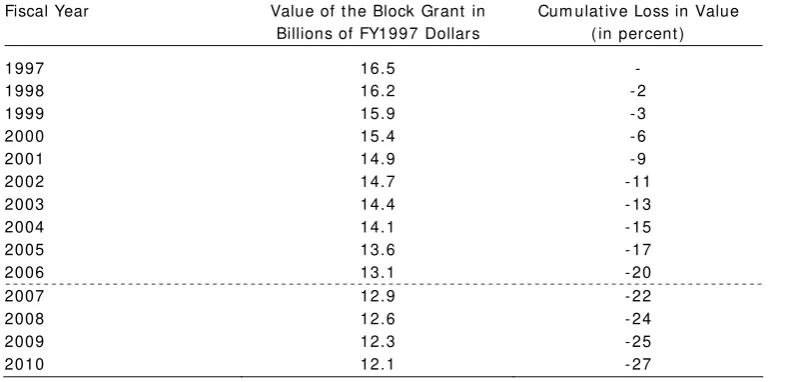
Under TANF, however, t here is no guarant ee of benefit provision. PRWORA sim ply m andat ed a fixed budget am ount t hat t he U.S.F.G would grant t o t he U.S. St at es each y ear ( t he base am ount of t he yearly block grant has been $16.5 billion since 1996) ( Congressional Budget Office, 1996) . U.S. St at es are required t o cont ribut e, from t heir own funds, at least $10.4 billion in t ot al under what is known as a “ m aint enance- of- effort ” ( MOE) requirem ent . The 1996 law also creat ed supplem ent al grant s for cert ain St at es w it h high populat ion grow t h or low block grant allocat ions relat ive t o t heir needy populat ion, as well as a cont ingency fund t o help St at es during a recession ( Cent er on Budget and Policy Priorit ies, 2009) . U.S. St at es t hat need or use m ore t han t he am ount t hat has been grant ed for a part icular year are not ent it led t o Federal reim bursem ent for excess expendit ures. Conversely, St at es t hat do not use all of t heir annual funding are allowed t o carry over unused dollars from one fiscal year t o t he next ( U.S. Depart m ent of Healt h and Hum an Services, 1996) .
The AFDC program was funded specifically and solely t o provide cash assist ance t o needy fam ilies. The corresponding JOBS and EA program s supplem ent ed AFDC by providing vocat ional t raining and short t erm - em ergency program funding, respect ively ( U.S. Depart m ent of Healt h and Hum an Services, 1996) . Under TANF, how ever, St at es m ay direct Federal funding t oward any program t hat is w it hin TANF’s obj ect ives, including program m ing t hat would have form erly been funded t hrough t he JOBS or EA program s. I n t he absence of Federally m andat ed cash assist ance requirem ent s, m any U.S. St at es have opt ed t o spend less on cash assist ance and m ore on t he ot her program m ing t hat falls under t he provisions of TANF such as childcare, or work support program s. Thus, wit h t he t ransit ion from AFDC t o TANF t he num ber of fam ilies receiv ing incom e assist ance fell sharply. I n 2003, m ost TANF funds, m ore t han 60 percent , were spent on areas ot her t han incom e assist ance ( Cent er on Budget and Policy Priorit ies, 2009) . I n fiscal year 2007 t he U.S. spent 30 billion dollars on TANF. ( This num ber includes bot h t he federal expendit ure and t he Maint enance of Effort ( MOE) funding) . Only 30.2 percent of TANF dollars went t oward providing fam ilies wit h cash assist ance ( 28.4 percent t o ot her services; 19.1 percent t o child care; 12.4 percent t o ot her work support and em ploym ent program s; 8.3 percent t o sy st em s and adm inist rat ion; and 1.6 percent t o t ransport at ion) ( Cent er on Budget and Policy Priorit ies, 2009) .
Our Annex C shows t his variet y am ong U.S. St at es in using TANF dollars. As a result , governm ent aid across t he nat ion varies rem arkable; see Annex D. As m illions of people seek aid, t hey are finding a com plex syst em t hat reaches som e and rej ect s ot hers for ‘unpredict able’ reasons. For exam ple, t he share of poor children and parent s ( below 100 percent of t he povert y line) t hat receive cash welfare ranges from 2 percent in I daho and Wyom ing t o over 45 percent in Main, California and Verm ont – U.S. average am ount s 21 percent . See Figure 3.
Figure 3: Share of poor children and parent s t hat receive cash welfare, 2009 0% 10% 20% 30% 40% 50% Id a h o W y o m in g L o u is ia n a G e o rg ia O k la h o m a T e x a s A rk a n s a s F lo ri d a M is s is s ip p i N o rt h C o lo ra d o U ta h Il li n o is S o u th A la b a m a M o n ta n a S o u th N e v a d a W e s t V ir g in ia W is c o n s in K e n tu c k y N e w M e x ic o A ri z o n a V ir g in ia O re g o n D e la w a re N o rt h K a n s a s O h io A la s k a N e b ra s k a H a w a ii M a ry la n d N e w J e rs e y Io w a N e w In d ia n a M is s o u ri T e n n e s s e e C o n n e c ti c u t P e n n s y lv a n ia M ic h ig a n N e w Y o rk W a s h in g to n M in n e s o ta M a s s a c h u s e t R h o d e I s la n d M a in e C a li fo rn ia V e rm o n t
Source: Deparle and Ericson ( 2009)
4.4 Eligibilit y
The 1996 welfare reform also had a significant im pact on eligibilit y for assist ance. Under AFDC, t he U.S.F.G. provided cash assist ance along wit h educat ion and t raining program m ing indefinit ely so long as a fam ily qualified under t he eligibilit y crit eria. One of t he m ost st riking ways t hat TANF lim it ed eligibilit y was t hrough t he im plem ent at ion of t im e lim it s, t his aspect of eligibilit y is discussed in sect ion 4.5. I n addit ion t o est ablishing t im e lim it s, PRWORA t ight ened eligibilit y requirem ent s bot h by providing U.S. St at es wit h t he discret ion t o deny benefit s and by reducing t he base populat ion who were eligible t o receive Federal assist ance.
Prior t o welfare reform , persons m eet ing financial eligibilit y requirem ent s under AFDC w er e provided cash benefit s from t he governm ent . AFDC did not include rest rict ions based on m arit al st at us or cit izenship. Minor, unwed m ot hers as well as persons convict ed of drug-relat ed crim es were provided unrest rict ed benefit s under t he form er welfare program . Legally residing im m igrant s were also eligible for benefit s under AFDC. There were no lim it s on t he size of a fam ily t hat could be eligible for AFDC benefit s, t herefore, when an addit ional child was born, fam ilies were provided wit h addit ional benefit s.
PRWORA im posed new condit ions and rest rict ions t o program part icipat ion. Since t he passage of welfare reform , persons w ho have been convict ed of a drug- relat ed crim e are prohibit ed for life from receiving benefit s under TANF. Unm arried m inor parent s are provided benefit s only if living wit h an adult or if in an adult - supervised set t ing and part icipat ing in educat ion and t raining program s ( U.S. Depart m ent of Healt h and Hum an Services, 1996) . U.S. St at es were given t he discret ion t o exclude bot h legal im m igrant s w ho w ere new applicant s t o w elfare as well as t he right t o exclude even t hose legal im m igrant s already receiv ing assist ance under t he prior w elfare program ( U.S. Depart m ent of Healt h and Hum an Serv ices, 1996) . While t he Federal guidelines under TANF do not lim it eligibilit y based on fam ily size, t he policy does provide individual U.S. St at es wit h t hat discret ion ( U.S. Depart m ent of Healt h and Hum an Services, 2004) .
4.5 Tim e lim it s
em ploym ent adequat e t o provide fam ily st abilit y is not found, at t he end of five cum ulat ive years, fam ilies are rem oved from t he program and can never again part icipat e.
AFDC’s designat ion as an ent it lem ent program ensur ed t hat U.S. St at es would receiv e funding from t he U.S.F.G. as long as t he St at es adhered t o t he Federal requirem ent s. Benefit s were t hen guarant eed t o eligible part icipant s in t he AFDC program ( U.S. Depart m ent of Healt h and Hum an Services, 1996) Moreover, under AFDC, program part icipant s rem ained eligible as long as t hey m et t he program ’s est ablished rules. Because t here were no t im e rest rict ions t o part icipat ion in AFDC, fam ilies rem ained eligible for cash assist ance as long as t hey were below t he init ial eligibilit y t hreshold est ablished by each individual U.S. St at e and cont inued t o m eet t he program requirem ent s issued by t he U.S.F.G. and t he U.S. St at e of residence. The est ablishm ent of t im e lim it s is one of t he m ost consequent ial changes affect ing fam ilies on welfare in t he Unit ed St at es. The U.S. m inim um wage plays a role in t he abilit y of less-skilled work ers t o earn adequat e incom es even if fully em ployed.12 The inabilit y t o find em ploym ent at a living wage and m aint ain it while addressing healt h issues and child care have caused barriers for fam ilies in est ablishing financial securit y, part icularly single- m ot her-headed- households ( Prim us et al, 1999) . I n spit e of t hese difficult ies, welfare does not provide Federal benefit s t o part icipant s once t he t im e lim it has ex pired.13 TANF does not
ensure t hat aft er t he program eligibilit y t im e lim it is t olled, t hat part icipat ing fam ilies hav e secured work t hat will enable t hem t o prov ide basic necessit ies or ev en offset t he cost of childcare or t ransport at ion t hat work requires.
Moreover, r ecipient s who reach t he t im e lim it s or who are sanct ioned for not finding a j ob are being denied cash assist ance even t hough t hey are willing t o w ork, sim ply because t hey cannot find any em ployer t o hire t hem . This labor dem and problem will increase during recessions and will rem ain even in good econom ic t im es because em ployer dem ands for a skilled work force cont inue t o escalat e. Not e t hat t he “ t im e lim it and out ” syst em differs m arkedly from a “ t im e lim it followed by a w ork - for- welfare opport unit y of last resort ” init ially proposed by President Clint on’s advisors, but rej ect ed by Congress ( Danziger, 2002a) .
4.6 Work requirem ent s and act ivit ies
Alt hough educat ion, work part icipat ion and financial securit y were obj ect ives of U.S. welfare policy bot h before and aft er welfare reform , t he 1996 welfare reform placed great er responsibilit y on t he fam ilies receiv ing program benefit s t o find st able and sufficient ly paying work . To enable fam ilies t o achieve t his goal TANF provided addit ional support t arget ed at finding and m aint aining em ploym ent .
Direct ly following w elfare reform , U.S. St at es drast ically alt ered t heir w elfare program m ing t o assist fam ilies in est ablishing em ploym ent ( Golden, 2005) . One such change m ade by U.S. St at es was a shift t oward “ work- first ” welfare syst em s t hat reduced skills developm ent and educat ion program s w hile em phasizing j ob- readiness and em ploym ent search t raining ( Golden, 2005) . U.S. St at es also m oved t oward “ m aking work pay” t hrough incent ivizing work part icipat ion by raising eligibilit y t hresholds or adding earned incom e t ax credit s. Addit ionally , U.S. St at es t oughened sanct ions and t im e lim it s t o enforce t he m essage t hat welfare would provide only t em porary assist ance ( Golden, 2005) .
Under AFDC, in fiscal year 1994, 40 percent of t wo- parent households receiving benefit s were required t o part icipat e in 16 hours of work act ivit y per week in order t o cont inue part icipat ion in AFDC’s cash assist ance program . Before t he passage of PRWORA, t he percent age of households required t o m eet t he 16 hour work requirem ent was scheduled t o increase t o 75 percent in fiscal year 1997 ( U.S. Depart m ent of Healt h and Hum an Services, 1996) . I n addit ion t o t he 16 hour requirem ent im posed on som e part icipant s, all AFDC recipient s were
12 According t o t he U.S. Depar t m ent of Labor, t he Federal m inim um wage is $6.55 per hour effect ive July 24, 2008. The Federal m inim um wage provisions are cont ained in t he Fair Labor St andards Act . Many U.S. St at es also have m inim um w age law s. I n cases w here an em ploy ee is subj ect t o bot h t he St at e and Federal m inim um wage law s, t he em ployee is ent it led t o t he higher of t he t wo m inim um wages.
required t o part icipat e in JOBS unless t hey w ere exem pt from t he program . A recipient would be exem pt from JOBS part icipat ion if he or she eit her worked for 30 hours or m ore per week; at t ended school full- t im e; cared for a very young child or elderly fam ily m em ber; or were under age 16 ( U.S. Depart m ent of Healt h and Hum an Services, 1996) .
I n cont rast , under TANF, work part icipat ion st andards require t hat t he head of household in a single parent fam ily w ork at least 20 hours per week and in t he case of t wo parent fam ilies, parent s are required t o work 30 hours per week in order t o rem ain eligible for cash assist ance. Eligible work includes: subsidized or unsubsidized em ploym ent , on- t he- j ob t raining, educat ion program s, and com m unit y service. Hours spent in vocat ional educat ion can count t owards t he w eekly work requirem ent but only in a m inorit y of U.S. St at es and only for a t ot al of 12 m ont hs. ( U.S. Depart m ent of Healt h and Hum an Services, 1996) .
However, St at es are provided som e flexibilit y in m eet ing t heir work requirem ent s. The TANF st at ut e requires U.S. St at es t o have 50 percent of t heir caseload m eet t he est ablished work part icipat ion st andards. I n addit ion t o t he aforem ent ioned st andards, t here is a separat e part icipat ion st andard t hat applies t o t wo- parent fam ilies, requiring 90 percent of t he St at e’s t wo- parent fam ily part icipant s t o m eet work part icipat ion st andards ( Falk, 2007) . St at es t hat fail t he TANF work part icipat ion st andards are penalized by a reduct ion in t heir Federal block grant am ount s. Howev er, t he st at ut ory work part icipat ion st andards are reduced by a “ caseload reduct ion credit ” .14 The caseload reduct ion credit reduces t he part icipat ion st andard one percent age point for each percent decline in t he caseload ( Falk, 2007) .
Welfare reform and t he im plem ent at ion of TANF cent ered on t he im port ance of work in providing fam ilies wit h econom ic st abilit y . The policy int ended t o prov ide support t hrough program m ing for five years, while part icipant s were able t o gain em ploym ent and econom ic securit y. The program s est ablished t o assist poor fam ilies wit h j ob preparat ion and work- force engagem ent have been t he source of a significant am ount of welfare reform ’s praise. However, because program s vary from one U.S. St at e t o t he next , t he degree t o which t he work relat ed program s assist fam ilies is also varied.
5. EVALUATI NG WELFARE REFORM
Following t he passage of PRWORA U.S. social policy analyst s and econom ist s have surveyed t he im pact of welfare reform on helping needy fam ilies in t he U.S. m ove out of povert y. This is a difficult t ask, due t o t he discret ion provided t o U.S. St at es t hrough TANF and t he result ing diversit y in program m ing and im plem ent at ion. There have been varied opinions about TANF’s success in assist ing t he nat ion’s poorest fam ilies. Research inst it ut ions and universit ies have developed new and div erse proxies for exam ining t he ext ent t o which welfare reform has been successful in m eet ing t he needs of low- incom e fam ilies in t he Unit ed St at es as well as for ident ifying t he reform ’s failures.
Oft en t he reduced num ber of fam ilies receiving cash assist ance t hrough TANF is cit ed as evidence of t he success of t he 1996 welfare reform . Ot her frequent ly cit ed indicat ions of success include t he increase in em ploym ent rat es and t he decrease in child povert y t hat t ook place during t he 1990’s ( Parrot t and Sherm an, 2006) . How ever, t his analysis only provides part of t he inform at ion needed t o evaluat e t he success of w elfare reform in t he Unit ed St at es. The following sect ions provide a review of dat a and lit erat ure evaluat ing welfare reform ’s success in support ing fam ilies m oving from w elfare and int o work , and ensuring em ploym ent and financial securit y for poor fam ilies in t he Unit ed St at es.
5.1 Em ploym ent t rends
Som e of t he em ploym ent t rends observed aft er welfare reform are posit ive. More w elfare recipient s are em ployed w hile receiving w elfare benefit s t han t hey were in t he past ; increasing from 22 percent in 1997 t o 33 percent in 1999. While t hese num bers hav e fallen in recent years, t hey have st ill not dropped t o t he levels t hat t hey were before welfare reform ( Golden, 2005) . Howev er, a num ber of st udies have found t hat even wit h increased work part icipat ion rat es t hat welfare and form er w elfare recipient s are st ruggling t o est ablish financial securit y.
One of t he prim ary goals of welfare reform was for part icipant s t o est ablish “ st able, long- t erm work pat t erns” , under t he assum pt ion t hat regular involvem ent in work will im prove t heir well- being. The j ust ificat ion for est ablishing only t em porary assist ance is t hat t his approach provides support and im pet us for fam ilies t o becom e st ably em ployed w hich w ill be in t he best int erest of t he part icipat ing fam ilies. I ndeed, st udies indicat e t hat em ploym ent am ong form er welfare recipient s has act ually increased since welfare reform was enact ed, and t hat when recipient s leave t he TANF program t heir em ploy m ent rat e is 5 t o 10 percent higher t han when t hey left AFDC ( Danziger et al, 2000) .
I n t he lat e 1990’s, when fam ilies left t he w elfare syst em , t hey w ere m ore likely t o have at least one working adult t han t hey were prior t o t he im plem ent at ion of TANF ( Golden, 2005) . However, in t he t ougher labor m arket of 2002 and 2003, t he proport ion of form er welfare recipient s in t he workforce fell from 63 percent in 1999 t o 57 percent in 2002 ( Golden, 2005) . Evaluat ions of welfare- t o- work t y pically r eport t hat while m ost par t icipant s are able t o secure init ial em ploym ent , a large proport ion, oft en a m aj orit y, lose t hose j obs w it hin a year ( Danziger et al, 2000) . Addit ionally, low wages am ong welfare recipient s rem ain a concern. While recent research suggest s t hat wages of form er w elfare recipient s grow over t im e, t his phenom enon occurs am ong only t he m inorit y of form er recipient s w ho are able t o est ablish regular, st able full- t im e work pat t erns ( Danziger et al, 2000) .
A st udy conduct ed by Danziger et al ( 2000) found t hat t he form er welfare recipient s wit h t he m ost work part icipat ion and experience have higher levels of financial success and subj ect iv e well- being t han t hose w it hout em ploym ent . How ever, t hey also found t hat t here were a large num ber of respondent s who suffered from financial hardship regardless of t heir level of work involvem ent . The st udy concluded t hat em ploym ent is associat ed wit h “ reduct ions in, but not t he elim inat ion of, econom ic vulnerabilit y and m at erial hardships” for welfare and form er welfare recipient s in t he Unit ed St at es.
5.2 The effect of t he econom y
The fact t hat PRWORA was passed during a t im e of rapid and sust ained econom ic grow t h com plicat es effort s t o det erm ine t he ext ent t o which cert ain phenom ena such as increased em ploym ent and decreased povert y levels can properly be at t ribut ed t o welfare policy reform . I n t he Unit ed St at es bet ween 1992 and 2000 t he labor m arket increased by 20 m illion j obs ( Blank, 2000) . The U.S. unem ploym ent rat e fell t o 5 percent in early 1997, and rem ained at or below t hat level unt il Oct ober of 2001 ( Blank, 2002) . Many businesses experienced worker short ages in t he years following t he passage of t he 1996 legislat ion, m aking em ployers increasingly open t o hiring ex- welfare recipient s. Addit ionally, wages am ong less sk illed and less educat ed workers st art ed t o rise in 1995, for t he first t im e since t he lat e 1970s.
During t his t im e, less- educat ed, single m ot hers increasingly j oined t he workforce; w hereas 62 percent of t his populat ion was em ployed in 1995, by 2000, 73 percent w ere working ( Kaushal et al, 2006) . While t his is im pressive growt h, t he ext ent t o which it can be at t ribut ed t o welfare reform rem ains am biguous. Welfare reform policies m ight have increased t he num ber of wom en in t he workforce t hrough j ob t raining and work incent ives, but it is unclear t o w hat degree t he increase was a result of policy, and t o what degree it was t he result of a st rong econom y ( Blank, 2000) .