Munich Personal RePEc Archive
Financial Liberalization and the
Aid-Growth Relationship in India
James, Ang
Monash University
2009
F
INANCIAL
L
IBERALIZATION AND THE
A
ID
-G
ROWTH
R
ELATIONSHIP IN
I
NDIA
Abstract
This paper examines the impact of foreign aid in the process of economic development in
India by controlling for the degree of financial liberalization. A composite index is constructed
using the method of principal component analysis to capture the joint influence of various policies
imposed on the Indian financial system. The results show that while foreign aid exerts a direct
negative influence on output expansion, its indirect effect via financial liberalization is positive.
Therefore, an important implication of the findings in this paper is that greater openness in the
financial system of the host country is a crucial prerequisite to realize the effectiveness of foreign
aid. Our results are robust to a number of control variables and estimation techniques.
Keywords: Aid; financial liberalization; India.
1. Introduction
Although many developing countries have received a substantial amount of foreign aid over
the last few decades, there is no consensus regarding its impact on growth (Morrissey, 2001;
Radelet, 2006). Several recent studies, typified by the work of Burnside and Dollar (2000, 2004)
and Collier and Dollar (2001, 2002), argue that aid assists growth but only in good policy
environments. Others suggest that there is a non-linear effect in the aid-growth relationship due to
diminishing returns to aid (see Dalgaard and Hansen, 2001; Hansen and Tarp, 2001; Lensink and
White, 2001, Gomanee et al., 2003; Dalgaard et al., 2004, among others). Although the current
debate is focused on these two leading views (Alvi et al., 2008), there is also a growing literature
showing that the aid-growth nexus can at best be characterized as fragile and ambiguous (see, e.g.,
Easterly et al., 2004; Clemens et al., 2004; Easterly, 2006).
Amidst animated debate on the effectiveness of aid, the present study seeks to examine a
different but related issue: the role of financial liberalization in the aid-growth relationship. This
issue is examined in the context of India, a large and rapidly growing developing economy that has
undergone significant financial sector reforms. From the 1950s to the 1980s, India was the largest
recipient of foreign aid. However, its economic growth rates were virtually stagnant during this
period (Becker, 2007). The financial sector reforms initiated since the 1990s along with the rapid
economic growth experienced by India since then suggest that there may be a close association
between financial liberalization and the aid-growth nexus. This interesting observation forms the
basis for further analysis.
The early literature initiated by McKinnon (1973) and Shaw (1973) suggests that financial
liberalization encourages investment and therefore exerts a positive effect on long-term growth.
Following the seminal empirical work of King and Levine (1993), the relationship between finance
and growth has been a subject of considerable academic interest and intense policy debate (see, e.g.,
Bell and Rousseau, 2001; Rousseau and Wachtel, 2002; Beck and Levine, 2004; Levine, 2005). The
bulk of cross-country evidence appears to suggest that financial development has a positive impact
on economic growth (see Ang, 2008c, 2009a for a survey of literature), although case studies
indicate that the direction of causality is less unambiguous (see, e.g., Ang and McKibbin, 2007).
These two strands of literature, i.e., the aid-growth and finance-growth links, have recently
been combined under an integrated framework by Nkusu and Sayek (2004). They argue that
financial development may exert an indirect positive effect on the aid-growth relationship through
the conduct interest rate and exchange rate management, where the effectiveness of these policies
depend on the absorptive capacity of the local financial markets. Significant inflows of foreign aid
effectively sterilize these undesirable impacts. In other words, foreign aid functions effectively
when aid flows are better managed in the context of deeper and more efficient financial systems.
Therefore, it appears plausible that one of the underlying reasons that aid is less effective in
spurring development than is expected may be due to the failure of financial systems in ensuring an
efficient allocation of aid resources.
However, in contrast to Nkusu and Sayek (2004), the focus of the present study is on
financial liberalization rather than financial development. We emphasize the former since the depth
of a financial system is directly shaped by financial sector policies. The presence of a more
liberalized financial system also effectively reduces barriers and restrictions on interest rate and
exchange rate controls, providing the monetary authorities with greater flexibility to conduct
monetary and exchange rate management (Caporale and Williams, 2001; Kletzer and Kohli, 2001).
The main contributions of this study include: 1) empirically testing the relationship between aid and
growth by providing further evidence from a large and fast growing developing country. Not only
could this enhance our understanding of the aid-growth relationship, but also fill the gap in the
extant literature, which is dominated by cross-country analysis; 2) contributing to the debate on the
effectiveness of foreign aid on the Indian economy. There are very few studies on the aid-growth
relationship for India, despite her status as one of the largest recipient of foreign assistance; and 3)
complementing the literature on the effectiveness of foreign aid by assessing the impact of financial
liberalization on GDP growth. This policy factor has been neglected somewhat in the analysis of the
aid-growth nexus.
We organize the rest of the paper as follows. Section 2 briefly reviews the financial
repression and liberalization experience of India. A composite index for financial liberalization is
constructed to measure the joint influence of a number of policies implemented in the Indian
financial system. The econometric techniques employed in this study are explained in Section 3.
The results are presented and analyzed in Section 4. The next section provides a sensitivity analysis
of the results by considering alternative estimators and the inclusion of several control variables.
The last section summarizes and concludes the paper.
2. Financial Sector Reforms in India
There was little financial repression imposed on the Indian financial system in the 1950s.
However, the Reserve Bank of India gradually imposed more controls over the financial system by
introducing interest rate controls in the 1960s. The statutory liquidity ratio was raised from 25
percent in 1966 to 38 percent in 1989. The cash reserve rate increased considerably from 3 to 15
percent during the same period. These high liquidity and reserve requirements enabled the Bank to
increased significantly since the nationalization of the fourteen largest private banks in 1969. A
number of priority lending rates were set at levels well below those that would prevail in the free
market. This process culminated in the late 1980s when directed lending was more than 40 percent
of total lending.
The major phase of financial liberalization was undertaken in 1991 as part of the broader
economic reform in response to the balance of payments crisis of 1990-91. The objective was to
provide a greater role for markets in price determination and resource allocation. Consequently,
interest rates were gradually liberalized, and the reserve and liquidity ratios were reduced
significantly. However, despite this liberalization, the Indian financial system has continued to
operate within the context of repressionist policies through the provision of subsidized credit to
certain priority sectors. Liberalization of the directed credit programs is only limited to deregulation
of priority lending rates, whilst significant controls on the volume of directed lending remain in
place. Furthermore, the Bank has tightened supervision and regulation in recent years to ensure that
[image:5.595.53.549.385.708.2]these priority sector requirements are met.
Table 1: Principal component analysis for the financial liberalization index
Principal component
1 2 3 4 5 6 7 8 9
Eigenvalue 4.247 1.943 1.101 0.600 0.463 0.338 0.182 0.089 0.035
% of variance 0.472 0.216 0.122 0.067 0.051 0.038 0.020 0.010 0.004
Cumulative % 0.472 0.688 0.810 0.877 0.928 0.966 0.986 0.996 1.000
Eigenvector Policy
Variable 1 2 3 4 5 6 7 8 9
FDRt 0.397 0.140 0.422 0.165 0.221 0.232 0.084 0.626 0.341
DRCt 0.398 0.223 0.206 0.370 0.234 0.110 0.603 0.033 0.426
DRFt 0.223 0.522 0.195 0.473 0.155 0.187 0.569 0.109 0.148
FLRt 0.172 0.277 0.699 0.218 0.581 0.043 0.118 0.000 0.068
LRCt 0.098 0.577 0.206 0.563 0.257 0.296 0.129 0.357 0.002
LRFt 0.318 0.353 0.345 0.103 0.302 0.621 0.221 0.294 0.180
CRRt 0.356 0.319 0.228 0.163 0.514 0.241 0.435 0.356 0.234
SLRt 0.449 0.146 0.154 0.052 0.296 0.075 0.049 0.394 0.707
DCPt 0.407 0.005 0.129 0.456 0.161 0.600 0.187 0.317 0.297
Notes: FDRt = fixed deposit dummy, DRCt = deposit rate ceiling dummy, DRFt = deposit rate floor dummy, FLRt =
fixed lending dummy, LRCt = lending rate ceiling, LRFt = lending rate floor, CRRt = the cash reserve ratio on time
Measuring the extent of financial liberalization is not an easy task. To do this, we follow the
approach of Demetriades and Luintel (1997) and Ang (2008b, 2009b) by constructing a composite
index. In particular, nine series for these repressionist policies are collected. Six of them are interest
rate controls, including a fixed lending dummy, a minimum lending rate, a maximum lending rate, a
fixed deposit dummy, a minimum deposit rate and a maximum deposit rate. These policy controls
are translated into dummy variables which take the value of 1 if a control is present and 0
otherwise. The remaining three policies are the cash (statutory) reserve ratio, the statutory liquidity
ratio and directed credit programs.
Using these nine policy variables, a summary measure of financial repression, which
represents the joint impact of the various financial policies, is developed using the method of
principal component analysis. In principle, this composite measure is able to capture most of the
information from the original dataset that consists of nine policy variables. Given its conciseness,
this approach sufficiently deals with the problems of multicollinearity and over-parameterization.
The inverse of this measure can be interpreted as the extent of financial liberalization (see, e.g., Ang
and McKibbin, 2007; Ang, 2008d).
Table 1 presents the results for the financial liberalization index obtained from principal
component analysis. The eigenvalues indicate that the first principal component explains about 47.2
percent of the standardized variance, the second principal component explains another 21.6 percent
and so on. The first principal component is computed as a linear combination of the nine policy
[image:6.595.61.549.512.705.2]measures with weights given by the first eigenvector.
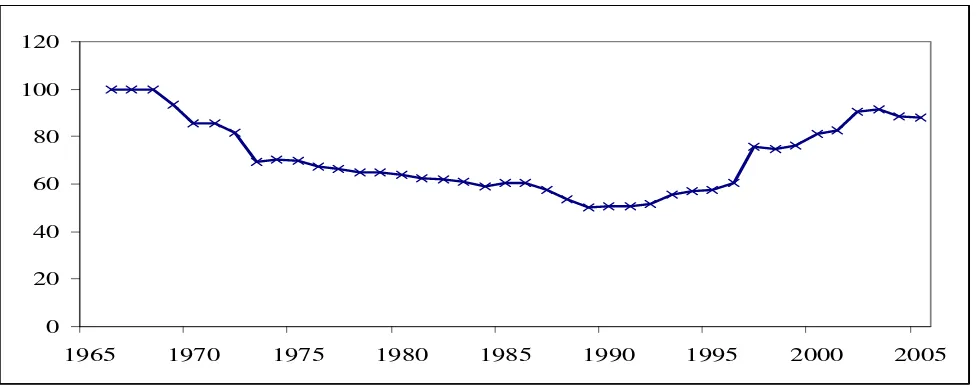
Figure 1: Financial Liberalization Index (1966-2005)
0 20 40 60 80 100 120
1965 1970 1975 1980 1985 1990 1995 2000 2005
The six largest principal components are extracted, and they are able to capture 96.6 percent
of the information from the original data set. The remaining principal components are not
considered since their marginal information content is relatively small. The percentages of variance
are adjusted to make sure that their absolute values sum to one. These adjusted values are then used
as the weights to compute the index. In this connection, the first principal component, which
accounts for 47.2 percent of the total variation of the policy variables, has a weight of 47.2/96.6,
and so on. The resulting index is presented in Figure 1. It is evident that the trend towards financial
repression has been reversed since the early 1990s. The leveling-off observed in the series coincides
with the increase in the extent of directed credit programs in recent years.
3. Empirical Approach
The importance of financial liberalization as a precondition for the growth-enhancing
effects of aid can be illustrated with the AK model of Rebelo (1991) in which total factor
productivity (A) is a function of aid, financial liberalization and their interaction. This simple
endogenous growth setting can be used to guide our empirical formulation so that economic
development (EDt) depends on the capital stock (KAPt), financial liberalization (FLt), foreign aid
(AIDt), and the interaction term between financial liberalization and foreign aid (FLt x AIDt), as
given in Eq. (1).
0 1 2 3 4
lnEDt =β +β lnKAPt +β lnFLt +β lnAIDt+β lnFLtxlnAIDt +εt (1)
In the above equation, β1 is expected to carry a positive sign whereas the signs expected for
β2 and β3 cannot be determined a priori. β4 is expected to be positive due to the hypothesis that the
impact of foreign aid on per capita real GDP is enhanced through the degree of liberalization in the
financial system. The model will be estimated using annual data for India over the period
1966-2005. Data sources and construction of variables are explained in the Appendix.
The main econometric procedure used to test for the existence of the long-run equilibrium
relationship and to provide estimates of this long-run relationship is the ARDL procedure of
Pesaran et al. (2001). The approach has several desirable statistical properties, such as precise
estimates of long-run parameters and valid t-statistics, even in the presence of endogenous
explanatory variables. Pesaran and Shin (1998) have shown that the OLS estimators of the short-run
parameters are consistent and the ARDL based estimators of the long-run coefficients are
super-consistent in small sample sizes. Hence, valid inferences on the long-run parameters can be made
The ARDL procedure involves two stages. In the first stage, the existence of the long-run
relationship between the variables is tested. The ARDL model for the dynamic output equation can
be formulated as:
0 0 1 , 1 0
1 1
,
0 1
ln ln ln ln
ln
p k
t t j j t i t i
j i
p k
ji j t i t i j
ED a b ED b DET c ED
c DET ε
− − −
= =
−
= =
Δ = + + + Δ
+ Δ +
∑
∑
∑∑
(2)
where p is the lag length and DETt is a vector of k determinants of lnEDt. The null hypothesis of no
long-run relationship between lnEDt and its determinants is H0:b0 = = =b1 ... bk =0. We first
estimate Eq. (2) by the OLS estimator and then calculate the F-statistic. The test for cointegration is
provided by two asymptotic critical value bounds when the independent variables are either I(0) or
I(1). The lower bound assumes all the independent variables are I(0), and the upper bound assumes
they are I(1). If the test statistics exceed their respective upper critical values, the null is rejected
and we can conclude that a long-run relationship exists. The second stage of the procedure is to
derive the long-run and short-run estimates using the underlying ARDL model.
4. Empirical Findings
We begin our empirical analysis by assessing the integration properties of the underlying
variables. Two standard unit root tests were used to assess the order of integration of the underlying
variables - the Augmented Dickey-Fuller (ADF) test and Phillips-Perron (PP) test. The results
reported in Table 2 show that all variables appear to be integrated at order one, or I(1), at 1% level
of significance. This allows legitimate use of the ARDL bounds test since the procedure requires all
[image:8.595.53.553.583.743.2]underlying variables to be integrated at an order less than two.
Table 2: Results for unit root tests
ADF PP
Levels 1st-differenced Levels 1st-differenced
lnEDt -1.481 -6.061*** -0.079 -6.105***
lnKAPt 2.381 -2.786* 3.101 -3.021**
lnFLt -0.785 -3.285** -0.774 -4.748***
lnAIDt -2.840 -5.277*** -2.724 -6.164***
lnFLt x lnAIDt -1.641 -6.006*** -1.916 -6.027***
Next, to perform the ARDL bounds test, we estimate Eq. (2) with one and two lags for the
model. We do not consider a lag length greater than two in order to conserve the degrees of
freedom, given the small sample used in this study. Table 3 gives the F-statistics for the ARDL
bounds tests, as well as the Akaike’s and Schwarz’s Bayesian Information Criteria (denoted by AIC
[image:9.595.54.547.221.462.2]and SBC, respectively).
Table 3: ARDL bounds tests
1
p= p=2
I. F-statistic 3.415 7.481***
II. Model section criteria: AIC -4.469 -4.858
SBC -3.822 -3.988
III. Diagnostic checks: χNORMAL2 6.681 **
(0.035)
0.151 (0.927)
χSERIAL2 3.675 *
(0.055)
1.827 (0.176)
χWHITE2 11.858
(0.617)
20.439 (0.368)
χ2ARCH 0.018
(0.892)
1.562 (0.211)
Notes: p is the optimal lag length for the ARDL model. p is the lag length. The test statistics are compared against the critical values reported in Pesaran et al. (2001). For the case with five variables, an intercept and no trend, the 10%, 5% and 1% critical value bounds for the ARDL bounds test are (2.450, 3.520), (2.860, 4.010) and (3.740, 5.060), respectively. χNORMAL2 refers to the Jarque-Bera statistic of the test for normal residuals,
2
SERIAL
χ is the Breusch-Godfrey LM test statistic for no first order serial correlation, 2
WHITE
χ denotes the White’s test statistic to test for homoskedastic errors, and χARCH2 is the Engle’s test statistic for no autoregressive conditional heteroskedasticity. Figures in
parentheses indicate p-values. *, ** and *** indicate 10%, 5%, and 1% levels of significance, respectively.
The test for the presence of a long-run relationship results in an F-statistic of 3.415 when
one lag is chosen. This statistic is lower than the 10 percent upper bound value of 3.520, suggesting
that no evidence of cointegration is found when one lag is considered. However, the results indicate
the null hypothesis that there exists no per capita output equation is rejected at the one percent
significance level for the model when two lags are chosen. The null of no relationship between the
variables cannot be rejected when lnKAPt, lnFLt, lnAIDt or lnFLtxlnAIDt are chosen to be the
dependent variables. Hence, the results suggest these variables can be interpreted as long-run
In line with the results of the bounds test, both AIC and SBC prefer a richer dynamic
specification of two lags. Furthermore, the choice of two lags is not subject to any econometric
problems, based on the results of the diagnostics checks reported in panel III. Thus, we find that
using two lags is more appropriate in this case and have chosen to follow this lag structure in the
[image:10.595.53.549.201.603.2]remaining analyses.
Table 4: ARDL estimates of the long-run relationship and the short-run dynamics
I. The long-run relationship
(Dep. = lnEDt) Coefficient Std. Error p-value
Intercept -14.623** 6.848 0.043
lnKAPt 0.634*** 0.044 0.000
lnFLt 4.145** 1.549 0.013
lnAIDt -2.539** 0.974 0.015
lnFLt x lnAIDt 0.595** 0.231 0.016
II. The short-run dynamics (Dep. = ΔlnEDt)
Coefficient Std. Error p-value
Intercept -0.022 0.020 0.288
ECTt-1 -0.381*** 0.090 0.000
ΔlnKAPt 1.525
***
0.408 0.001
ΔlnFLt 0.631* 0.342 0.076
ΔlnAIDt -0.457
**
0.217 0.045
Δ(lnFLt x lnAIDt) 0.108** 0.050 0.039
ΔlnGDPt-1 -0.276
*
0.155 0.086
ΔlnGDPt-2 -0.098 0.144 0.502
ΔlnAIDt-2 -0.051 0.045 0.268
Δ(lnFLt-2 x lnAIDt-2) 0.014 0.010 0.178
III. Diagnostic checks Test-statistic p-value
2
NORMAL
χ 5.704* 0.058
2
SERIAL
χ 0.011 0.919
2
WHITE
χ 5.627 0.776
2
ARCH
χ 0.046 0.831
Notes: The resulting lag structure chosen using AIC for the underlying ARDL model is (2, 1, 2, 2, 2).
Panel I of Table 4 provides estimates of the long-run relationship whereas panel II gives the
results of the short-run dynamics. Capital stock enters the long-run equation significantly at the one
percent level with the expected positive sign. Specifically, the long-run elasticity of per capita real
output with respect to capital stock is found to be 0.634. The results suggest that capital stock has
played a vital role in the process of economic development in India, a finding consistent with the
Every one percent increase in the composite index of financial liberalization is associated
with a 4.145 percent increase in per capita real GDP. The results imply that liberalization of the
financial system in India has a favorable effect on economic development. The finding of a positive
influence of financial liberalization provides some support for the financial liberalization thesis of
McKinnon (1973) and Shaw (1973), which argues in favor of removing all financial restraints in
order to foster economic growth. Our results are also consistent with the cross-country findings of
Bekaert et al. (2005).
Our model conjectures that foreign aid has both direct and indirect effects on output
expansion. Holding the indirect effect constant, the results show that foreign aid is found to have a
direct negative effect on economic development in India, with a negative long-run elasticity of
2.539. Thus, our results do not lend any support to the view that aid will promote growth. The
results seem to suggest that resources from foreign aid have been misused and misallocated and
therefore were unlikely to exert any positive impact on growth in India. Our results corroborate the
cross-country findings of Knack (2001) and Nkusu and Sayek (2004), who have shown that foreign
aid has a dampening effect on economic growth. However, the results stand in sharp contrast to the
earlier findings of Chenery and Strout (1966) and Papanek (1973). Our finding is also consistent
with the theoretical models developed by Kimbrough (1986) and Gong and Zou (2001), which
predict that both investment and output growth rates will move in opposite directions in response to
an increase in foreign aid receipts.
As regard to the indirect effect, the interaction term is found to be statistically significant
and has the expected sign (positive). Therefore, it can be inferred that the impact of foreign aid on
the Indian economy is strengthened by the level of financial liberalization. This is obvious when we
obtain the derivative of lnEDt with respect to lnAIDt. The results suggest that aid will have a
detrimental effect on growth unless the financial system in India is liberalized beyond a certain
level so that efficient allocation of aid resources can take place. In this case, the threshold from
which the effect of aid on growth becomes beneficial is 71.307 (or 4.267 in natural logarithms), a
level which has been achieved since 1997 (see Figure 1). Hence, both the direct and indirect effects
of financial liberalization on economic development are found to be positive.
Turning to the short-run dynamics, the regression results for the short-run model reported in
panel II of Table 4 show several salient features. In first-differenced form, financial liberalization,
aid and their interaction have signs consistent with those reported in the long-run model, although
these effects are much smaller than their long-run counterparts. The coefficient on ECTt−1, which
measures the speed of adjustment back to the long-run equilibrium value, are statistically significant
has a significant impact on the growth rate of per capita output. The equation adjusts at about 38
percent every year to restore equilibrium when there is a shock to the steady-state relationship. In
order to assess the sensitivity of the results, we subject the estimation to a number of robustness
checks in the next section.
5. Robustness checks
5.1. Diagnostic tests
The results reported in panel III of Table 4 show that the regression specification fits
remarkably well and passes the diagnostic tests against non-normal residuals, serial correlation,
heteroskedasticity and autoregressive conditional heteroskedasticity at the five percent level of
significance. Structural stability of the equations is examined using the cumulative sum (CUSUM)
and CUSUM of squares tests on the recursive residuals. The former is able to detect systematic
changes in the regression coefficients whereas the latter is able to detect sudden changes from the
[image:12.595.70.549.403.583.2]constancy of the regression coefficients.
Figure 2: Plots of CUSUM and CUSUM of squares recursive residuals
-15 -10 -5 0 5 10 15
1985 1990 1995 2000 2005 CUSUM 5% Significance
-0.4 0.0 0.4 0.8 1.2 1.6
1985 1990 1995 2000 2005 CUSUM of Squares 5% Significance
The results in Figure 2 show that the test statistics are within the five percent confidence
interval band, suggesting the estimated model is rather stable over time. The actual and predicted
series of the per capita real GDP series are also compared in Figure 3, which reveals that the
predicted series tracks the actual series very closely over time, providing some support that the
Figure 3: Actual and predicted lnEDt series
8.2 8.4 8.6 8.8 9.0 9.2 9.4 9.6 9.8
1970 1975 1980 1985 1990 1995 2000 2005
A ctu al ln ED Pred icted ln ED
5.2. Alternative estimators
While the ARDL approach is used for the main results of this paper, to provide a sensitivity
check of the results we also consider three other estimators, namely the FM-UECM estimator Inder
(1993), the DOLS procedure of Stock and Watson (1993) and the FM-OLS procedure of Phillips
and Hansen (1990). Since our focus is on the long-run results, the short-run dynamics generated by
each estimator are not reported here for brevity. In general, these approaches give very similar
results compared to those estimated using the ARDL approach. All variables enter the long-run
equation significantly at the conventional levels. The main theme is that the interaction term
continues to be highly significant, highlighting the importance of the complementary role of
financial sector reforms in order to absorb the benefits of foreign aid.
Table 5: Alternative estimators
FM-UECM DOLS FM-OLS
coefficient p-value coefficient p-value coefficient p-value
Intercept -5.897** 0.014 -30.381*** 0.006 -6.303*** 0.007
lnKAPt 0.584*** 0.000 0.679*** 0.000 0.577*** 0.000
lnFLt 2.185*** 0.000 7.783*** 0.004 2.286*** 0.000
lnAIDt -1.293*** 0.000 -4.782*** 0.004 -1.367*** 0.000
[image:13.595.51.549.555.769.2]5.3. Controlling for other effects
Having examined the robustness of the econometric results, we now turn to presenting the
results with additional control variables. We derive the results using the ARDL estimator. Since we
are mainly interested in the long-run relationship, only the long-run results are reported to conserve
space. Specifically, we control for the presence of a non-linear effect (AIDt x AIDt) due to
diminishing returns to aid (Dalgaard and Hansen, 2001; Lensink and White, 2001; Gomanee et al.,
2003), the interaction between aid and other financial or institutional factors, including quality of
institutions (INSt), banking sector development (BANKt), stock market development (STOCKt) and
share market volatility (VOLt). The results are reported as columns (1) – (5) in Table 6. The
construction of these variables is explained in the Appendix.
It is evident that there is no support for the presence of a non-linear effect, implying that a
threshold effect does not exist in the relationship between aid and per capita real GDP for India.
Apart from the measure of stock market volatility, all other control variables and their interaction
terms are found to be statistically insignificant. For instance, the effectiveness of aid on growth in
India does not depend on the presence of a good institutional framework such as strong intellectual
property rights protection – a finding consistent with Easterly et al. (2004) and (Alvi et al., 2008).
Moreover, the measures of financial development are found to have no effect on per capita GDP.
This is probably due to the inclusion of the financial liberalization index in the specification as
studies have shown that financial liberalization is an important determinant of financial
development (e.g., see Ang and McKibbin, 2007; Ang, 2008a).
Importantly, the inclusion of additional controls does not alter our main findings. In other
words, financial liberalization and its interaction with aid continue to have a positive influence
whereas aid continues to have a direct negative effect on output expansion. These effects are found
to be statistically significant at the conventional levels. It should also be highlighted that the
Table 6: Controlling for nonlinear and other interaction effects
Dependent variable: lnEDt
(1) (2) (3) (4) (5)
lnKAPt 0.583
*** (0.000) 0.642*** (0.000) 0.691*** (0.000) 0.491*** (0.000) 0.532*** (0.000)
lnFLt 2.513
** (0.024) 2.623** (0.025) 0.463*** (0.003) 1.057*** (0.000) 1.218*** (0.000)
lnAIDt -1.847
*** (0.006) -1.512** (0.042) -0.272*** (0.004) -0.558*** (0.000) -0.457*** (0.000)
lnFLtx lnAIDt 0.348
** (0.034) 0.351** (0.046) 0.055*** (0.004) 0.131*** (0.000) 0.154*** (0.000)
lnAIDt x lnAIDt -0.025
(0.155)
lnINSt 0.135
(0.918)
lnINSt x lnAIDt 0.036
(0.853)
lnBANKt -0.415
(0.251)
lnBANKt x lnAIDt -0.033
(0.556)
lnSTOCKt 0.018
(0.839)
lnSTOCKt x lnAIDt -0.006
(0.661)
lnVOLt -0.542
*
(0.061)
lnVOLt x lnAIDt -0.087
*
(0.051)
F-statistic
(ARDL bounds test) 6.315*** 4.515*** 5.193*** 5.162*** 4.519***
6. Conclusions
Notwithstanding the growing concern over the importance of foreign aid in India, few
studies have attempted to assess the impact of aid on the country’s growth. The paper empirically
investigates this relationship by focusing on the complementary role of financial sector reforms.
Specifically, we tested the hypothesis that financial liberalization enhances recipient countries’
ability to effectively absorb foreign aid, drawing on the experience of a large and rapidly growing
developing economy.
Using the ARDL bounds test, the empirical evidence shows a significant long-run
relationship between per capita real GDP and all its determinants. The results also reveal that
financial liberalization is an important factor determining output growth for India both in the short
run and long run, indicating the financial liberalization thesis of McKinnon (1973) and Shaw (1973)
is firmly supported by the Indian data. We found that aid inflows per se may retard output
expansion. However, India is able to gain significantly more from aid flows with a more liberalized
financial system. Our empirical results are robust to several sensitivity checks, including model
stability, the use of different estimators, and the inclusion of a number of control variables.
The results have some policy implications. Firstly, any impediments to financial sector
reforms are likely to harm India’s economic prosperity. Secondly, foreign aid has a direct
detrimental effect on the economic performance of India. However, the benefit of aid can be
realized through liberalizing the financial sector. Thus, liberalizing the financial system can enhance
the effectiveness of aid on growth. Thirdly, the presence of a good policy environment in the form
of a stronger intellectual property rights protection framework has no implication on the aid-growth
nexus in India. Finally, there is no evidence to support the presence of a non-linear effect in the
References
Alvi, E.; Mukherjee, D. and Kedir, E.S. (2008). "Aid, Policies, and Growth in Developing Countries: A New Look at the Empirics." Southern Economic Journal 74, pp. 693-706.
Ang, J.B. (2008a). "Are Financial Sector Policies Effective in Deepening the Malaysian Financial System?" Contemporary Economic Policy 62, pp. 623-635.
____ (2008b). "Finance and Inequality: The Case of India." CAMA Working Papers 2008-18.
____ (2008c). "A Survey of Recent Developments in the Literature of Finance and Growth." Journal of Economic Surveys 22, pp. 536-576.
____ (2008d). "What Are the Mechanisms Linking Financial Development and Economic Growth in Malaysia?" Economic Modelling 38, pp. 38-53.
____ (2009a).Financial Development and Economic Growth in Malaysia. London: Routledge.
____ (2009b). "Private Investment and Financial Sector Policies in India and Malaysia." World Development, forthcoming (doi:10.1016/j.worlddev.2008.12.003).
Ang, J.B. and McKibbin, W.J. (2007). "Financial Liberalization, Financial Sector Development and Growth: Evidence from Malaysia." Journal of Development Economics 84, pp. 215-233.
Beck, T.; Demirguc-Kunt, A. and Levine, R. (2000). "A New Database on the Structure and Development of the Financial Sector." World Bank Economic Review 14, pp. 597-605.
Beck, T. and Levine, R. (2004). "Stock Markets, Banks, and Growth: Panel Evidence." Journal of Banking and Finance 28, pp. 423-442.
Becker, G. (2007). "Is There a Case for Foreign Aid?" The Becker-Posner Blog, http://www.becker-posner-blog.com/archives/2007/01/is_there_a_case_1.html.
Bekaert, G.; Harvey, C.R. and Lundblad, C. (2005). "Does Financial Liberalization Spur Growth?" Journal of Financial Economics 77, pp. 3-55.
Bell, C. and Rousseau, P.L. (2001). "Post-Independence India: A Case of Finance-Led Industrialization?" Journal of Development Economics 65, pp. 153-175.
Burnside, C. and Dollar, D. (2000). "Aid, Policies, and Growth " American Economic Review 90, pp. 847-868.
____ (2004). "Aid, Policies, and Growth: Revisiting the Evidence." The World Bank Policy Research Working Paper No. 3251.
Caporale, G.M. and Williams, G. (2001). "Monetary Policy and Financial Liberalization: The Case of United Kingdom Consumption." Journal of Macroeconomics 23, pp. 177-197.
Chenery, H.B. and Strout , A.M. (1966). "Foreign Assistance and Economic Development." American Economic Review 56, pp. 679-733.
Clemens, M.A.; Radelet, S. and Bhavnani, R. (2004). "Counting Chickens When They Hatch: The Short-term Effect of Aid on Growth." Center for Global Development Working Paper No. 44.
____ (2002). "Aid Allocation and Poverty Reduction." European Economic Review 45, pp. 1470-1500.
Dalgaard, C.-J.; Hansen, H. and Tarp, F. (2004). "On The Empirics of Foreign Aid and Growth." Economic Journal 114, pp. F191-F216.
Dalgaard, C. and Hansen, H. (2001). "On Aid, Growth and Good Policies." Journal of Development Studies 37, pp. 17-41.
Demetriades, P.O. and Luintel, K.B. (1997). "The Direct Costs of Financial Repression: Evidence from India." Review of Economics and Statistics 79, pp. 311-320.
Easterly, W. (2006).The White Man’s Burden. New York: The Penguin Press.
Easterly, W.; Levine, R. and Roodman, D. (2004). "Aid, Policies, and Growth: Comment." American Economic Review 94, pp. 774-780.
Ginarte, J. and Park, W. (1997). "Determinants of Patent Rights: A Cross-National Study." Research Policy 26, pp. 283-301.
Gomanee, K.; Girma, S. and Morrissey, O. (2003). "Searching for Aid Threshold Effects." School of Economics, University of Nottingham CREDIT Research Paper No. 03/15.
Gong, L. and Zou, H.-f. (2001). "Foreign Aid Reduces Labor Supply and Capital Accumulation." Review of Development Economics 5, pp. 105-118.
Hansen, H. and Tarp, F. (2001). "Aid and Growth Regressions." Journal of Development Economics 64, pp. 547-570.
Inder, B. (1993). "Estimating Long-Run Relationships in Economics: A Comparison of Different Approaches." Journal of Econometrics 57, pp. 53-68.
Kimbrough, K.P. (1986). "Foreign Aid and Optimal Fiscal Policy." Canadian Journal of Economics 19, pp. 35-61.
King, R.G. and Levine, R. (1993). "Finance and Growth: Schumpeter Might Be Right." Quarterly Journal of Economics 108, pp. 717-737.
Kletzer, K. and Kohli, R. (2001). "Financial Repression and Exchange Rate Management in Developing Countries: Theory and Empirical Evidence for India." International Monetary Fund Working Papers No: 01/103.
Knack, S. (2001). "Aid Dependence and the Quality of Governance: Cross-Country Empirical Tests." Southern Economic Journal 68, pp. 310-329.
Lensink, R. and White, H. (2001). "Are There Negative Returns to Aid?" Journal of Development Studies 37, pp. 42-65.
Levine, R. (2005). "Finance and Growth: Theory and Evidence," Aghion, P. and Durlauf, S. (Ed), In: Handbook of Economic Growth. Netherlands: Elsevier Science, 865-934.
McKinnon, R.I. (1973). Money and Capital in Economic Development. Washington, D.C.: Brookings Institution.
Nkusu, M. and Sayek, S. (2004). "Local Financial Development and the Aid-Growth Relationship." IMF Working Papers No: 04/238.
Papanek, G.F. (1973). "Aid, Foreign Private Investment, Savings, and Growth in Less Developed Countries." Journal of Political Economy 81, pp. 120-130.
Pesaran, M.H. and Shin, Y. (1999). "An Autoregressive Distributed-Lag Modelling Approach to Cointegration Analysis," Strom, S. (Ed), In: Econometrics and Economic Theory in the Twentieth Century: The Ragnar Frisch Centennial Symposium. Cambridge: Cambridge University Press, 371-413.
Pesaran, M.H.; Shin, Y. and Smith, R.J. (2001). "Bounds Testing Approaches to the Analysis of Level Relationships." Journal of Applied Econometrics 16, pp. 289-326.
Phillips, P.C.B. and Hansen, B. (1990). "Statistical Inference in Instrumental Variables Regression with I(1) Processes." Review of Economic Studies 57, pp. 99-125.
Radelet, S. (2006). "A Primer on Foreign Aid." Center for Global Development Working Paper No. 92.
Rebelo, S. (1991). "Long-Run Policy Analysis and Long-Run Growth." Journal of Political Economy 99, pp. 500-521.
Rousseau, P.L. and Wachtel, P. (2002). "Inflation Thresholds and the Finance-Growth Nexus." Journal of International Money and Finance 21, pp. 777-793.
Shaw, E.S. (1973).Financial Deepening in Economic Development. New York: Oxford University Press.
Appendix: Construction of variables and data sources
Variable Description Sources
EDt Economic development is measured per capita GDP at 1993
constant prices.
National Accounts Statistics, Government of India.
KAPt The initial capital stock is computed by taking the initial gross
capital formation at constant prices divided by the sum of depreciation rate (assumed to be 10 percent) and the average growth rate of gross capital formation at constant prices over the period 1966-2005. Capital stocks are then computed using the standard perpetual inventory model.
National Accounts Statistics, Government of India.
AIDt Foreign aid is measured by the ratio of utilization of external
assistance to nominal GDP.
National Accounts Statistics, Government of India.
FLt The composite index of financial liberalization consists of six
interest rate control dummies, cash reserve ratio, statutory liquidity ratio and directed credit programs. The reserve and liquidity ratios are direct measures expressed in percentages. The extent of directed credit program is measured by 0, 1, 2 and 3 when the programs cover zero, up to 20 percent, 21 to 40 percent, and more than 40 percent, respectively, of total bank loan. The index is constructed using the method of principal component analysis, following the approach of Demetriades and Luintel (1997). Details of index construction are described in Section 2.
Annual Reports and Report on Currency and Finance, Reserve Bank of India.
INSt Quality of institutions in this study is measured by the protection
of intellectual property rights. The intellectual property rights index covers five dimensions: 1) patentability of various kinds of inventions, 2) membership in international patent arrangements, 3) provisions for loss protection, 4) enforcement mechanisms, and 5) duration of the patent term. Each dimension is assigned a value ranging from zero to one. The unweighted sum of these five values provides an indication of the overall level of intellectual property rights protection, with higher values reflecting greater level of protection. Missing years are interpolated.
Ginarte and Park (1997).
BANKt Following the established practice, banking sector development
is measured by bank credit to commercial sector divided by nominal GDP.
Annual Reports and Report on Currency and Finance, Reserve Bank of India.
STOCKt Stock market development is measured by the ratio of share
market capitalization to nominal GDP. Data for stock market capitalization before 1976 are constructed using the share price index.
International Financial Statistics CD Rom and Beck et al. (2000).
VOLt Stock market volatility is measured by the 5-year rolling
standard deviation of the growth rate of share price index.
International Financial Statistics CD Rom.