1. INTRODUCTION
Conventional foundation design is achieved using traditional bearing capacity approaches to calculate the ultimate bearing capacity (qult) of the foundation:
qult = 0.5 B N S + cNc + DNq Sq (Eq 1)
Where:
= Unit Weight of Soil B = Foundation Width c = cohesive strength D = foundation depth S Sq are shape factors
And N , NC ,Nq are bearing capacity factors which depend on the friction angle ( ) of the soil.
In uncemented sands, the second part of Equation 1 reduces to zero, and the non geometrical variables are the bearing capacity factors. As noted by Randolph et. al. (2003), the accuracy with which bearing capacity factors for a given soil can be determined has increased substantially in recent years (See Martin 2003), and the main uncertainty in the implementation of equation 1, lies in the choice of an appropriate friction angle. The primary
complication being the difficulty in sampling cohesionless soils to allow strength testing on representative samples, and the stress-dependent effects on choice of friction angle.
To overcome some of these problems greater reliance is being placed on in-situ tests such as the Cone Penetration Test (CPT) to derive engineering parameters such as the friction angle, or through the use of empirical formulae to estimate the bearing capacity of the soil. Randolph et al. (2003) summarise the results of tests performed on shallow foundations, and buried piles in the laboratory and field, and reported ratios of the bearing pressure (q) at displacements of 5 and 10% of the foundation diameter, normalized by the CPT end resistance (qc). The data suggest q/qc ratios of 0.09–0.16 at displacements of 5% of the foundation diameter, increasing to 0.13-0.21 at 10%.
Due to the relatively large ultimate bearing resistance of sand, actual foundations are usually remote from failure and the designer is primarily concerned with estimating the settle-ment of the footing under working stress condi-tions. This is typically achieved by assuming that in this stress range, the foundation response can be assumed to be linear-elastic. Once again the key difficulty for the designer is the choice ABSTRACT:
Given the problems associated with sampling cohesionless soils there is movement towards the use of high quality in-situ tests either to derive soil parameters for use in conventional design me-thods or through the use of empirical design correlations. This paper describes a field test of a model vertically loaded footing tested at a dense sand test site. The ultimate capacity and load-displacement response at working stresses are shown to be predicted reasonably accurately using simple tech-niques which use the Cone Penetration Test (CPT) cone resistance qc as an input parameter.
Use of the Cone Penetration Test to derive parameters for shallow
foundation design
Ken Gavin
1, Brendan O’Kelly
2, Abidemi Adekunte
1Bernard Casey
3& Shane Donohue
11
Civil Engineering Department, University College Dublin Dublin 2 , Ireland
2
Department of Civil, Structural and Environmental Engineering, Trinity College Dublin , Ireland 3 ESB International, Stephens Court, St. Stephens Green, Dublin 2
Cite this article as follows:
of an appropriate youngs modulus (E) and a myriad of recommendations are available in the literature to assist in the choice of parameters.
With such uncertainties in mind a field ex-periment which examined the load-settlement response of a model footing was performed at the University College Dublin (UCD) dense sand test bed site.
2. FIELD WORK
2.1.Ground conditions
The fieldwork was carried out at the base of a sand quarry on the outskirts of Blessington, a small village located 25km to the southwest of Dublin.. The material is a horizontally bedded uniformly graded sand deposited at the bed of a glacial lake. The particle grading between beds varies from silty sand to coarser sand depending on the lake level at the time of deposition. The material can be classified as very silty sand (with fines content 30%), to slightly silty Sand, with the mean particles size (D50) decreasing from 0.32mm in the coarse sand to 0.1mm in the silty sand.
Periodic minor advances of the ice sheet, varying water table levels in the lake and the recent removal by quarrying of the upper 15m of sand/gravel have resulted in over-consolidation of the underlying material, with odeometer test results suggesting a past maximum vertical effective stress of between 700 to 800 kPa. A total of nine Cone Penetration Tests (CPT) were performed in the area, with one being performed adjacent to the foundation experiment. All CPT end resistance (qc) values were remarkably consistent below a depth of 0.5m below ground level (bgl). The variability in near ground conditions is unsur-prising due to the tracking of heavy quarrying equipment. Typical CPT profiles are shown in Figure 1 and qc values typically in the range 12 – 20 MPa.
The water table level in the area was about 5m below the test level, however, the natural water content of samples above the water table level were 11-12%. Sand replacement tests, in addition to maximum and minimum void ratio determinations, indicated that the in-situ sand is at a relative density of close to 100%, has a bulk
[image:2.595.317.523.168.437.2]unit weight of 20.3 kN/m3 and a degree of saturation of 71%. Direct shear box tests reveal peak friction angles ( p) varying from 36-39 .
Figure 1 CPT qc profiles at test site
2.2.Experimental Procedure
The test foundation was a 0.25m square, steel plate which was founded at a depth of 0.5 bgl to avoid the variable upper layer of sand. The footing was loaded using a 20 tonne cone truck as reaction, and displacements were measured by two Linear Variable Displacement Transducers (LVDTs) located at each side of the foundation which were supported on a 4m long reference beam. The applied load was measured using a 200kN load cell, which was attached (along with the LVDTs) to a datalogger which recorded load and displacement at 1sec interval throughout the test. Load was applied in increments of approximately 25 kN, and unload-reload loops were performed at load levels of 85, 125 and 180 kN.
0
0.5
1
1.5
2
2.5
3
3.5
4
0 5 10 15 20 25 30
qc (MPa)
3. EXPERIMENTAL RESULTS
3.1.Ultimate Bearing Resistance
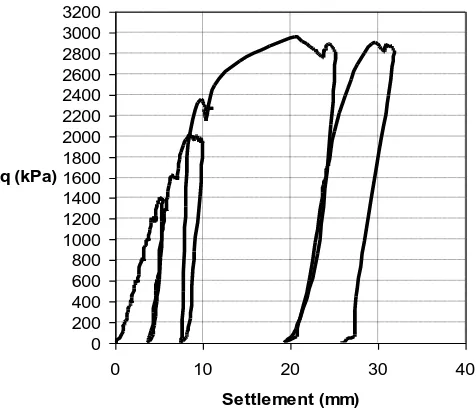
The mobilization of the bearing pressure re-sistance (q) under the footing, with settlement (s) is shown in Fig. 2. The footing tilted slightly from the initial stages of the test, and the set-tlement shown is the mean value of the two LVDT readings. After an initial bedding error of approximately 1mm, due mainly to the densification of the loose sand bed placed beneath the footing, it appears that the load– settlement response was approximately linear-elastic for bearing pressures of up to 1000kPa, with creep settlements recorded between the load increments becoming increasingly signifi-cant at higher stress levels. A permanent plastic deformation of approximately 3mm had oc-curred at the end of the first unload stage from a bearing pressure of 1400kPa. The reload re-sponse of the footing was approximately linear-elastic for bearing pressures up to the new pre-consolidation pressure of 1400kPa. Significant yielding occurred at a settlement of approx-imately 10mm, and the ultimate bearing capaci-ty (qult) of 2950kPa was reached at approx-imately 21mm settlement.
Figure 3, shows the average pressure normalized by the CPT qc value against normalized displacement (s/D). Ratios of q/qc at 5 and 10% of the plate diameter are 0.175 and 0.2 respectively. Whilst the value at s/D = 10% is in keeping with the lab and field test data reported by Randolph et al. (2003), the value at s/D=5% is higher than those reported. The graph suggests that the stiffness response at this strain level may have been affected by the unloading-reloading sequences. These would not affect the ratio at the higher ratio of s/D as ultimate conditions were achieved at s/D =8%. The figure confirms that q/qc=0.2 provided a good estimate of ultimate resistance at this site.
Figure 2 Development of bearing pressure during load test
Figure 3 Normalised bearing pressure q/qc, versus normalized settlement s/D.
0 200 400 600 800 1000 1200 1400 1600 1800 2000 2200 2400 2600 2800 3000 3200
0 10 20 30 40
Settlement (mm)
q(kPa)
0 0.02 0.04 0.06 0.08 0.1 0.12 0.14 0.16 0.18 0.2 0.22
0 1 2 3 4 5 6 7 8 9 10 11 12 13 14
[image:3.595.306.544.125.330.2] [image:3.595.309.533.418.617.2]3.2.Load-Displacement Response
By far the greatest uncertainty associated with the behaviour of vertically loaded shallow foundations is to attempt to describe their load displacement response. Sophisticated models to attempt to predict this response have been developed, however, these typically require a large number of input parameters and require the designer to make subjective assumptions regarding yield surface shape etc. (See Lehane and Fahey 2002). The Elastic Modulus E is routinely used to estimate settlement of a footing using equation 2:
s = [ q D (1- 2)] / ( 4E ) (Eqn 2)
where q is the applied pressure, s is the foot-ing settlement, (poisons ratio) is typically 0.2 in a drained material and E’ is the youngs modulus. This expression was used to derive the E response of the footing during the test using the measured pressure and settlement. The response shown in Figure 4 (the unload-reload loops are removed for clarity), shows E reduc-ing rapidly with increasreduc-ing strain level from a maximum measured (given the resolution of the test) of 54MPa at s/D = 1.7% to 18MPa at s/D=12%. The choice of an appropriate E’ value for design is a matter of great debate. Lunne & Christoferson (1985) suggest that during the initial loading of shallow footings the footing response can be modeled using a constant E’ value given by:
E’ = qc (Eqn 3)
Where = 5 for over-consolidated soil with qc < 50,000 kPa. This results in an Edesign value of 75 MPa. This modulus is assumed (Tomlinson 2001) to correspond to E25, i.e. the modulus at a mobilised stress ratio of 25%, where the mobilised stress ratio is defined as (mobilised stress/ultimate stress). From Figure 2, the displacement at a mobilised stress ratio of 25% (3000/4=750 kPa) was approximately 1.2mm or 0.5% strain. The Edesign value of 75 MPa is seen from Figure 4 to be reasonable. However, it is also clear that the modulus drops below this value at relatively low strain levels.
Hyperbolic models have been widely used to describe the degradation of stiffness with strain level in soils. These models retain the
simplicity of linear-elastic models, whilst attempting to describe the materials response to loading up to yield. Mayne (2000) suggests the settlement of a shallow footing can be estimated using the approach shown in Equation 4, which involves the estimation of two unknowns, Qult and Eo.
= Q . Ihrv (Eqn 4) D.E0 [1-(Q/Qu)0.3]
Where Qult is the ultimate load which the footing can support (= qult . Footing area), Ihrv is a displacement influence factor from elastic theory (See Poulos and Davis 1974), and E0 = 2G0(1+ ).
Figure 4 Degradation of E’ with increasing strain level during loading
As shown in section 2.1. the qult value could be estimated with reasonable accuracy using the qc approach. Therefore Go needs to be estimated or measured. Sampling induced strains make the estimation of Go from laboratory tests difficult, this leaves two possibilities (i) Correlation with in-situ test measurements of (ii) In-situ Go measurement using geophysical methods.
Schnaid et al (2004) present a comprehen-sive review of CPT based methods to estimate Go including work by Robertson (1997) who suggests :
0 10 20 30 40 50 60 70 80
0 5 10
[image:4.595.317.515.318.509.2]Go = ³√qc vpa (Eqn 5)
Where varies from 140 for unaged sand to 280 for aged sand, v is the in-situ vertical effective stress and pa is atmospheric pressure.
Shear wave velocity profiles were obtained in the field using the Multi Channel Analysis of Surface Waves (MASW) method (Park et al. 1999, Donohue et al. 2003) at the test site. Two MASW survey lines were performed to test the repeatability of the survey. The lines were perpendicular to each other and crossed at the centre geophone.
The field set up for each of the survey lines consisted of 24 receivers (10 Hz geophones) at 1m intervals collinear with the source location. A number of different source locations were chosen for each profile, at source receiver offsets of 1, 6, 13 and 25m. This was necessary to determine the optimum acquisition parameters thereby minimising the influence of near field and far offset effects (Park et al., 2002). The software Surfseis developed by the Kansas Geological Survey was used to perform the inversion procedure to produce shear wave velocity – depth profiles which may then be converted into corresponding Gmax profiles using equation 6 below:
Gmax = .Vs2 (Eqn 6)
Where Vs = shear wave velocity (m/s) and = density (kg/m3).
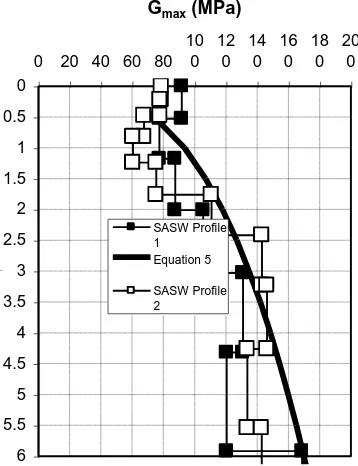
Predictions made using equation 5 (with = 280) are compared in Figure 5 to profiles of Go measured in MASW tests performed at the test site. It is clear that equation 5 produces a good approximation of the in-situ Go profile.
3.3.Comparison of load-displacement response estimated by linear-elastic and hyperbolic methods
Linear elastic methods remain popular in design practice because of their simplicity. It is clear from Figure 4 that it is difficult to choose a representative E value for the footing response. Implementing the constant Edesign value of 75Mpa in Equation 2 to estimate the footing response results in the prediction of the initial footing behaviour shown in Figure 6. The method over-predicts bearing pressure
Figure 5 Comparison of predicted Go profiles with MASW measured profiles
mobilisation for the initial loading phase, with the over-prediction worsening as displacement increases (allowing for the 1mm bedding in of the footing). In contrast the reload stiffness is significantly underestimated.
The two MASW and CPT derived were shown to provide consistent estimate of Go and an average value at 0.5m bgl of 82 Mpa was determined for use in Equation 4. qult was assumed to be equal 0.2qc. The predicted footing response shown in Figure 6 is more encouraging. Equation 4 allows degradation of the stiffness as the bearing resistance is mobi-lised and settlement occurs. Although the method over-predicts the total settlement required to mobilise qult, this is at least in part due to the un-load re-load loops performed, as one of the drawbacks of the hyperbolic model is that it cannot account for changes in the stress path direction. The model can be seen to pro-vide good estimates of settlement under work-ing stresses. Assumwork-ing a factor of safety of 3, the allowable stress on the footing is 1000 kPa, with the predicted settlement of 4mm at the stress level being very close to the measured value.
0
0.5
1
1.5
2
2.5
3
3.5
4
4.5
5
5.5
6
0 20 40 60 80
10 0
12 0
14 0
16 0
18 0
20 0
Gmax (MPa)
z (m)
SASW Profile 1 Equation 5
[image:5.595.307.486.83.316.2]Figure 6 Prediction of load settlement response using two methods.
4. CONCLUSION
CPT based design methods were shown to provide good estimates of both the ultimate capacity and displacement under working load of a shallow footing on sand. It should be noted however, that the load displacement response was shown to be strongly stress path dependent and therefore the accuracy of the settlement prediction may have been somewhat fortuitous.
Independent measurements of G0 using two standard, relatively inexpensive and quick in-situ test techniques (MASW & CPT) produced compatible profiles of Go. High quality inde-pendent measurements such as these provide the designer with useful insights of the stress history of the deposit and highlight the rele-vance of these techniques in similar materials.
5. ACKNOWLEDGEMENTS
The authors wish to thank the technical staff at University College Dublin and Trinity College Dublin for assistance in performing the field-work, and Roadstone Ltd. for use of the test site. The third author is supported by funding provided by Sustainable Energy Ireland and Aertech Ltd, and also by a Geotechnical Re-search Award from the Geotechnical Society of Ireland.
6. REFERENCES
B.M. Lehane & M.Fahey (2002) “A simplified nonlinear settlement prediction model for foundations on sand” Canadian Geotechni-cal Journal, No.39 pp293-303.
C.B. Park, Miller, D.M., and Xia, J. 1999. Multichannel Analysis of surface waves.
Geophysics, Vol. 64, No.3: 800-808.
C.B. Park, Miller, R.D., and Miura, H., 2002, Optimum field parameters of an MASW survey [Exp. Abs.]: SEG-J, Tokyo, May 22-23, 2002.
C. Martin (2003) “New software for rigorous bearing capacity calculations” Proc. Int. Conf. On Foundations, Dundee pp 581-592. F. Schaid , B.M.Lehane & M.Fahey (2004) “In-situ test characterisation of unusual geoma-terials” Proceedings ISC-2 pp 49-74. Porto H.G. Poulos and E.H.Davis (1974), Elastic
solutions for soil and rock mechanics” Wiley & Sons, New York
M.F.Randolph., M.B.Jamiolkowski, & L.Zdravkovic . (2004) “Load carrying ca-pacity of foundations”, Advances in Geo-technical Engineering- The Skempton Con-ference, Vol 1. pp 207-241.
M.J.Tomlinson (2001) “Foundation design and construction” 7th
Edition. Publ. Prentice Hall P. Mayne (2000) “Enhanced geotechnical site characterisation by seismic piezocone pene-tration tests” Proceeding 4th International Geotechnical Conference, Cairo, pp 95-120. S. Donohue., K.Gavin., M. Long and P.
O’Connor. (2003) “Determination of the shear stiffness of Dublin boulder clay using geophysical techniques” Proc. 13th ECSMGEVol 3, pp 515-520. Prague T.Lunne & H.P.Christoferson (1985)
“Interpre-tation of Cone Penetrometer Data for Off-shore Sands” Norweigan Geotechnical Insti-tute Publication No. 156, pp1-12.
0 500 1000 1500 2000 2500 3000
0 2 4 6 8 10 12 14 16 18 20
Settlement (mm) q (kPa)
E = 5qc