Sand Dune Species Distribution and Size Variations in Two
Areas Inside a Natural Protected Area Subjected to
Different Human Disturbance
Loretta Gratani, Maria Fiore Crescente, Laura Varone, Emanuela Gini, Carlo Ricotta, Andrea Bonito Department of Environmental Biology, Sapienza University of Rome, Rome, Italy.
Email: loretta.gratani@uniroma1.it
Received June 28th, 2013; revised July 30th, 2013; accepted August 15th, 2013
Copyright © 2013 Loretta Gratani et al. This is an open access article distributed under the Creative Commons Attribution License, which permits unrestricted use, distribution, and reproduction in any medium, provided the original work is properly cited.
ABSTRACT
Sand dune species were analyzed across two areas included in the “Roman Coastal State Nature Reserve” (Italy): Ostia (O) and Marina di Palidoro (P). Significant variations in species distribution, dry mass and size over the gradient from the water-edge toward the inland between O and Pwere observed. Species colonize O, on an average, at 79 m from the water-edge extended along the gradient toward the inland over a length of 26 m. PD is 40.8 ± 9.9 plants·m−2.
Ononis variegata and Elymus farctus have the highest PD (15.4 ± 1.3 plants·m−2), followed by Silene colorata and Sporobulus pungens (4.3 ± 3.9 plants·m−2), by Cakile maritima, Echinophora spinosa, Eryngium maritimum, Ammophila arenaria, Anthemis maritima, Cyperus capitatus, Medicago marina and Calystegia soldanella (<0.5 plants·m−2), with C. soldanella having the lowest PD (0.02 plants·m−2). On an average, in P, the species colonize the dune at 17 m from the water-edge for a length of 46 m toward the inland, PD is on an average 21.5 ± 16.1 plants·m−2.
S. pungens, E. farctus and O. variegata have the highest PD (6.0 ± 2.4 plants·m−2), followed by C. capitatus (2.1 ± 4.7 plants·m−2), by S. col-orata and A. maritima (0.4 ± 0.1 plants·m−2) and by E. spinosa, E. maritimum, M. marina, Pancratium maritimum and C. soldanella (0.2 plants·m−2). The results underline a larger species presence along the gradient from the water-edge to- ward the inland in P site compared to O site where, on the contrary, plants exclusively colonize the inner dune area due to the strong human disturbance which causes the foredune to become flat. Nevertheless, the presence of the most im- portant autoctonous sand dune species (on an average, 15.3 ± 0.5 species) can provide information for restoring the perturbed dune areas when preparing management strategies considering that the maintenance of coastal areas depends on the maintenance of native species.
Keywords: Dune Vegetation; Human Disturbance; Plant Density; Organic Soil Matter
1. Introduction
Some critical factors affect the survival and distribution of coastal sand dune species which grow on a physiologi- cally dried substrate characterised by a low mineral con- tent [1-4]. A factor which contributes to select dune spe- cies is the climatic effect on sand movements [5,6] such as wind-speed entrainment thresholds for sand particles and salt burial [7,8]. With regard to species assemblage, dune-builder plants may grow on fore-dunes, burial-tol- erant plants on inter-dunes and shrubs on stabilized dunes [9]. Morphological and physiological plant adapta- tions are important especially on fore-dunes [10-12] where few species are capable of withstanding the stress factors imposed by limited environmental resources and recurrent disturbance. On older dunes, where salt spray,
nutrient and water are no longer exclusive limiting fac- tors, competition for space and light may affect species richness [13-15]. Plant species presence is also related to organic matter which varies from water-edge toward the inland [11,13].
Most common environmental stress factors are drought and soil nutrient deficiency [21]. Among human distur- bance, infrastructure development is widespread on coasts in Europe. Furthermore, landscape fragmentation disrupts large scale geo-morphological processes [22] and mechanical damages through trampling reduce or even destroy vegetation [13]. Increased knowledge of plant species response to stress factors (i.e. climate, soil, anthropogenic interference) aims at the long-term land use planning to ensure sustainability of coastal resources while providing management flexibility for the future [23].
The main objective of this research was to compare the species presence in two areas included in a natural pro- tected area developing along the Tyrrhenian coast near Rome and subjected to a different human disturbance. Considering the importance of biological diversity main- tenance [24-27], we analyzed variations in sand dune species presence, dry mass and size over the gradient from the water-edge toward the inland.
2. Methods
2.1. The Study Area
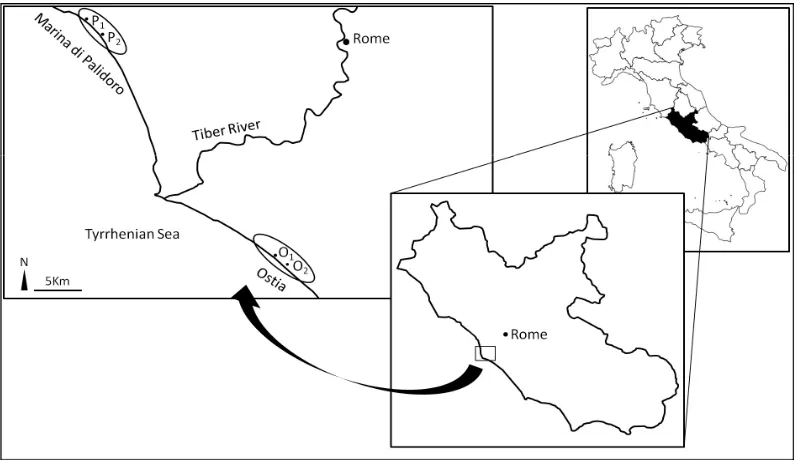
The study was carried out in the year 2012 in the Roman Coastal State Nature Reserve (Italian decree of 1996) which extended for ca 43 Km along the Tyrrhenian coast near Rome (Italy). Two areas were selected: Ostia (41˚41'00"N 12˚22'39"E) and Marina di Palidoro (41˚54'43"N 12˚08'47"E) (Figure 1). Despite the two areas being under protection, in recent years they were
subjected to human disturbance. In particular, Ostia (O) was a small populated city (85,301 people/km2, data
from Rome Municipality for the year 2010) where nu- merous buildings and bathing establishments were built in the last 50 years. Two sub-areas were selected for measurements: O1 (41˚40'58"N, 12˚22'40"E) near a gully,
extending along the coast line for ca 200 m, and O2
(41˚40'37"N, 12˚23'14"E) near a bathing establishment, extending along the coastline for ca 400 m. At both O1
andO2 the sand dune appeared flat up to 70 - 80 m from
the water-edge, followed by a mobile dune area charac- terised by a moderate slope of ca 6%, which finished with the fixed dune colonized by Mediterranean shrubs. The distance from the water-edge to the shrubby layer was 109 m and 100 m in O1 and O2, respectively. Dune
species were present at 85 and 73 m from the water-edge in O1 andO2, respectively.
Marina di Palidoro (P) was characterized by a lower human disturbance than O because of few buildings and bathing establishments. Two sub-areas were selected in P for measurements: P1 (41˚55'06"N, 12˚08'17"E) near the
hospital Bambino Gesù, extending along the coast line for ca 1600 m, and P2 (41˚54'43"N, 12˚08'46"E) near a
block of flats, extending along the coast line for ca 700 m. In P1 and P2 the drift line and the foredune extended
along the gradient from the water-edge toward the inland for ca 33 m and 41 m, respectively, was characterized by a moderate slope (ca 2%). Then it was followed by a mobile dune area extending for ca 20 m and 32 m in P1
and P2, respectively, and by the fixed dune with Medi-
[image:2.595.99.498.478.708.2]terranean shrubs. The distance from the water-edge to the
Figure 1. The two studied areas along the Thyrrenian coast near Rome, Ostia (O, 41˚41'00"N, 12˚22'39"E) and Marina di alidoro (P, 41˚54'43"N, 12˚08'47"E), and the considered sub-areas (O1, O2, P1 and P2) are indicated.
P
shrubby layer was 53 m and 73 m for P1 andP2, respec-
tively. Species were present at 20 and 15 m from the wa- ter-edge, in P1 and P2 respectively.
A transect oriented from the water-edge toward the inland was established in each of the selected sub-areas (O1, O2, P1, P2) for vegetation sampling. Along each
transect, plots (10 × 10 m each) were established, 3 m apart, starting from the water-edge to the inland (i.e. Mediterranean shrubby). Plot numbers were established in relation to the extension in length of the dune from water edge toward the inland and to species presence. In each sub-area the first plot was established where the first species presence occurred. In particular, two plots were established in O1 (O1a, and O1b at 85 and 98 m from
the water edge, respectively), O2 (O2a, O2b at 73 m and 86
m from the water edge, respectively), and in P1 (P1a and
P1b at 20 and 33 m from the water-edge, respectively),
and fourplots in P2 (P2a, P2b, P2c and P2d at 15, 28, 41 and
54 m from the water-edge, respectively).
2.2. Climate and Microclimate
The selected areas were characterised by a Mediterranean
type of climate. At O, the total annual rainfall was 589 mm, the mean minimum air temperature of the coldest months (January and February) was 4.8˚C and the mean maximum air temperature of the warmest months (July and August) was 29.1˚C (data from the Meteorological Station of Pratica di Mare, for the years 2000-2012) (Figure 2).At P, the total annual rainfall was 556 mm, the mean minimum air temperature of the coldest months (January and February) was 3.2˚C and the mean maxi- mum air temperature of the warmest months (July and August) was 29.6˚C (data from the Meteorological Sta- tion of Fiumicino, for the years 2000-2012) (Figure 2). The dominant windswere from W and the others from S and SE. The mean yearly winds speed was 16.6 knots and 18.7 knots at O and P, respectively [28].
Microclimate was measured in the considered sub-ar- eas at 20, 40, 60, 80, 100 m from the water-edge toward the inland, periodically (twice a month) during the study period. In each sampling occasion, air temperature (T,
˚C), relative air humidity (RH, %), total irradiance (I,
μmol photon m−2·s−1) and wind speed (W, m/s) were re-
[image:3.595.147.448.389.700.2]corded at 50 cm from the sand level. On each sampling occasion, measurements were carried out at 12:00 a.m.
Figure 2. Climate diagrams of Ostia (O) and Marina di Palidoro (P) (data from the Meteorological Station of Pratica di Mare and of Fiumicino, respectively, for the period 2000-2011). Total monthly rainfall (R, mm, columns), mean monthly air
tem-erature (T, ˚C, lines), annual mean temperature (Tann.mean) and total annual rainfall (Rtot) are shown.
Air temperature and air humidity were measured by a thermo-hygrometer (HD8901, Delta Ohm, I), total ir- radiance by a radiometer (LI-185B with a 190SB Quan- tum Sensor, LI-COR, USA) and wind speed by an ane- mometer (LUTRON AM-4201).
2.3. Sand Characterization
Triplicate sand samples were collected in the considered sub-areas at 20, 40, 60, 80, 100 m from the water-edge, for determination of sand water content (SWC, %), pH, soil organic matter (SOM, %) content and total nitrogen (N, %) content. All sand samples were collected at the end of May (at least 5 days after the last rainfall) at a depth of 40 cm by a drill. Sand samples were transported immediately to the laboratory. Sand samples were air dried at room temperature and then passed through 2 mm sieve. SWC was determined on sand samples (500 g each) as fresh sand minus dry sand divided by dry sand percent, calculated after oven-dried at 90˚C to a constant mass. The pH was measured with a glass electrode in a suspension of sand in deionized water. SOM was determined col- orimetrically with potassium dichromate, according to [29] and the N content by Kjeldahl method, according to [30].
2.4. Plant Species Presence and Plant Traits
Species presence was recorded in the considered plots from May to June, corresponding to the maximum plant biomass [31,32]. The number of plants per species was counted in each plot to calculate plant density (PD, indi- viduals·m–2).
Measurements of plant traits were carried out on rep- resentative plant species (5 plants per species in each plot) at the beginning of June. It included plant height (H, m), total plant volume per plot (V, cm3·m–2), total plant area
per unit of covered area at sand level (PA, cm2·m–2) and
total aboveground plant biomass (TPB, g·m–2). Plant
material was harvested, oven dried and then weighed to obtain dry mass (DM, g), according to [33]. TPB per species was calculated by multiplying DM and PD. H was defined as the maximum vertical distance from the sand level to the highest point of the plant. V was calcu- lated by the volume of a cylinder, according to [34].
2.5. Statistical Analysis
The main gradients in species composition were ex- tracted by ordination (principal coordinate analysis, PcoA) which was performed on the plot-to-plot dissimi- larity matrix and calculated with the Jaccard coefficient for species presence and absence data.
Differences of the means for the considered traits were tested by one-way ANOVA, and Tukey test for multiple comparisons. Kolmogorov-Smirnov and Levene tests
were used to verify the assumption of normality and ho- mogeneity of variances, respectively.
All statistical tests were performed by using Statistica 6.0 (Statsoft, USA). All data were shown as mean ± S.D.
3. Results
3.1. Microclimate and Sand Characterization
The microclimate of the considered sub-areas (P1 and P2
and O1 and O2) is shown in Figure 3. In all the consid-
ered sub-areas, T increased by 15% from water-edge to the inland, while RH and I decreased by 13%, 6% re- spectively (mean of P1, P2, O1 and O2). The wind (W)
action decreased, on an average, 56% from water-edge toward the inland, both in O and P sub-areas.
The O and P sand characterization is shown in Figure 4. In the considered sub-areas, SWC and pH decreased on an average, 18% and 11% from the water-edge toward the inland, respectively, while SOM and N content in- creased more than 100% and 113%, respectively (mean of O and P).
3.2. Plant Traits
Data on species presence, PD, H, V, PA and TPB in the considered plots are shown in Table 1. The number of species was larger in P (15.5 ± 0.5, mean of P1 and P2
plots) than in O (14.5 ± 0.5, mean of O1 and O2 plots). A
larger PD was monitored in P1b, and P2c, (37.7 ± 3.1
plants·m–2, mean value) and in O
1b and O2b (48.8 ± 0.15
plants·m–2, mean value) than in the other plots (22.1 ±
14.3 plants·m–2, mean value).
Crucianella maritima (PD = 0.53 plants·m–2, mean value) was monitored only in P
2d.
The plots farer from the water-edge had a higher H than those closer to it. In particular, H was on an average 59% higher in O1b than in O1a and 70% higher in O2b than in
O2a. H was 41% higher in P1b than in P1a, and 74% higher
in P2c and P2d than in P2a and P2b. On an average, PA was
82% larger in O1b than in O1a and 94% larger in O2b than
in O2a. PA was 266% larger in P1b than in P1a, and 577%
larger in P2c and P2d than in P2a and P2b.TPB ranged from
1145.8 g·m–2 (in O) to 1413.0 g·m–2 (in P) and it was the
highest in O2b (304.9 g·m–2) among O plots, and in P2d
(394.4 g·m–2) among P plots.
As regards to the species, E. farctus had the highest TPB and V (141.6 ± 62.2 g·m–2 and 19837 ± 8885
cm3·m–2 respectively, mean of the considered P and O
plots) and Chamaesyce peplis the lowest one (0.008 ± 0.010 g·m–2 and 1.9 ± 2.1 cm3·m–2 respectively, mean of
the considered P and O plots).
3.3. Principal Coordinate Analysis
Figure 3. Air temperature (T, ˚C), relative air humidity (RH, %), total irradiance (I, μmol photons m–2·s–1) and wind speed
(W, m·s–1) measured at 50 cm from the sand level, at 12:00 a.m., in the considered sub-areas at Ostia (O
1, O2) andat Marina
di Palidoro (P1 and P2). Measurements were carried out at 20, 40, 60, 80, 100 m from water-edge. Mean values ± standard
Figure 4. Sand water content (SWC, %), pH, soil organic matter (SOM, %) and total nitrogen content (N, %) collected in the considered sub-areas in Ostia (O1, O2) and Marina di Palidoro (P1 and P2) at 20, 40, 60, 80, 100 m from water-edge. Mean
Table 1. Data on species presence, plant density, plant height, plant area, plant volume and total plant biomass of the considered plots used in this study. For each species different letters indicate significant differences among the plots.
Distance (m) 85 - 95 98 - 108 73 - 83 86 - 96 20 - 30 33 - 43 15 - 25 28 - 38 41 - 51 54 - 64
Plot
Species O1a O1b O2a O2b P1a P1b P2a P2b P2c P2d
PD (plant·m−2) PD (plant·m−2) PD (plant·m−2) PD (plant·m−2)
Cakile maritima Scop. 0.01 a - - 0.01 a 0.02 a - 0.88 b - 0.02 a -
Echinophora spinosa L. 0.05 a 0.12 b 0.07 a 0.11 b 0.02 a 0.07 a - 0.02 a 0.16 c 0.25 d
Eryngium maritimum L. - 0.01 a - 0.10 b 0.07 ab 0.03 a - 0.15 c - 0.15 c
Elymus farctus (Viv.) Runemark
ex Melderis 18.60 a 12.09 b 20.70 a 14.00 b 11.85 b 5.15 c - 9.00 d 13.15 b 5.04 c
Ammophila arenaria (L.) Link - 1.16 a - 0.80 ac - 0.14 b - - 0.54 c -
Anthemis maritimaL. 0.26 a 0.39 b 0.14 a 0.58 b 0.05 c 1.36 d - - 0.18 a 0.59 b
Cyperus capitatus Vand. - 0.59 ab - 0.31 a - 0.79 b - - - 11.75 c
Ononis variegataL. 0.14 a 28.3 b - 29.40 b - 13.25 c - - - 6.02 d
Medicago marinaL. - 0.15 a 0.02 b 0.02 b - 0.04 b - - - 0.12 a
Crucianella maritimaL. - - - - - - - 0.53
Calystegia soldanella(L.) R. Br. 0.02a - - - - 0.03 a - - - 0.06 b
Sporobolus pungens(Schreb.) Kunth 16.55a 2.85 b 7.85 c 1.20 d - 13.00 e - 0.15 f 25.75 g 5.50 c
Silene colorataPoir. 0.71a 3.10 b 0.04 c 2.45 b - 0.92 d - - - 1.43 e
Pancratium maritimumL. - 0.01a - 0.01 a 0.03 ac 0.71 b - - 0.01 a 0.05 c
Salsola kaliL. 0.12a - 0.01 b - 0.02 b - 0.07 c 0.12 a 0.04 bc -
Chamaesyce peplis (L.) Prokh. 0.01a - 0.01 a - 0.01 a - - - 0.08 b -
Total 17.54 48.76 28.82 48.96 12.04 35.46 0.07 9.43 39.91 31.46
H (cm) H (cm) H (cm) H (cm)
Cakile maritima Scop. 22.0 a - - 35.0 b 11.5 c - 16.5 d - 19.3 d -
Echinophora spinosa L. 40.6 a 36.5 a 29.5 b 29.1 b 10.8 c 21.0 d - 28.5 b 26.6 b 17.2 e
Eryngium maritimum L. - 22.5 a - 26.4 b 21.8 ac 19.3 c - 12.3 d - 24.9 ab
Elymus farctus (Viv.) Runemark
ex Melderis 43.0 a 43.0 a 40.5 a 64.8 b 43.7 a 43.5 a - 53.7 c 44.0 a 41.0 a
Ammophila arenaria (L.) Link - 92.5 a - 105.0 b - 28.0 c - - 108.1 b -
Anthemis maritimaL. 16.3 a 16.9 ab 19.5 b 14.6 a 13.1 a 17.4 ab - - 20.2 b 13.3 a
Cyperus capitatus Vand. - 39.0 a - 37.8 a - 36.0 a - - - 44.5 b
Ononis variegataL. 10.1 a 11.5 a - 9.5 a - 9.5 a - - - 11.5 a
Medicago marinaL. - 12.4 a 7.8 b 9.3 b - 12.6 a - - - 15.6 a
Crucianella maritimaL. - - - - - - - 18.2
Calystegia soldanella(L.) R. Br. 3.5 a - - - - 3.5 a - - - 6.5 b
Sporobolus pungens(Schreb.) Kunth 19.0 ac 19.0 ac 17.0 a 16.0 a - 10.5 b - 10.1 b 11.0 b 21.5 c
Silene colorataPoir. 14.0 a 15.5 a 20.0 b 14.5 a - 14.0 a - - - 20.0 b
Pancratium maritimumL. - 15.5 a - 17.0 a 10.6 b 28.5 c - - 38.0 d 41.7 d
Salsola kaliL. 10.4 a - 9.8 a - 2.3 b - 2.0 b 2.3 b 2.4 b -
Chamaesyce peplis (L.) Prokh. 4.0 a - 4.5 a - 2.0 b - - - 2.4 b -
Mean 18.3 29.5 18.6 31.6 14.5 20.3 9.3 21.4 30.2 23.0
PA (cm2·m−2) PA (cm2·m−2) PA (cm2·m−2) PA (cm2·m−2)
Cakile maritima Scop. 15.00 a - - 13.35 a 4.00 b - 352.00 c - 81.63 d -
Echinophora spinosa L. 136.45 a 321.71 b 99.63 c 158.77 d 3.14 e 22.02 f - 4.50 e 232.55 g 109.86 c
Eryngium maritimum L. - 4.02 a - 231.43 b 22.79 c 10.59 c - 49.28 d - 104.26 e
Elymus farctus (Viv.) Runemark
ex Melderis 672.00 a 423.15 b 724.50 a 490.00 b 414.75 b 180.25 c - 315.00 d 460.25 b 176.40 c
Ammophila arenaria (L.) Link - 29.05 a - 20.00 a - 3.38 b - - 181.03 c -
Anthemis maritimaL. 413.90 a 524.19 b 358.68 a 654.05 c 187.08 d 1415.94 e - - 626.01 c 887.86 f
Continued
Ononis variegataL. 41.99 a 707.50 b - 735.00 b - 331.25 c - - - 138.00 d
Medicago marinaL. - 507.74 a 12.56 b 97.50 c - 104.8 c - - - 495.73 a
Crucianella maritimaL. - - - - - - - - - 498.45
Calystegia soldanella(L.) R. Br. 0.29 a - - - - 1.05 a - - - 11.00 b
Sporobolus pungens(Schreb.) Kunth 136.80 a 22.80 b 62.80 c 9.60 d - 104.00 e - 1.20 f 206.00 g 44.00 c
Silene colorataPoir. 4.26 a 18.60 b 0.21 c 14.70 b - 5.49 a - - - 8.55 d
Pancratium maritimumL. - 1.63 a - 2.72 a 1.47 a 101.52 b - - 14.23 c 65.89 d
Salsola kaliL. 0.82 a - 0.08 b - 0.10 b - 1.48 c 0.96 a 0.38 d -
Chamaesyce peplis (L.) Prokh. 0.16 a - 0.29 a - 0.28 a - - - 2.12 b -
Total 1421.66 2588.46 1258.76 2441.75 633.61 2317.96 353.48 370.94 1804.20 3104.01
V (cm3·m−2) V (cm3·m−2) V (cm3·m−2) V (cm3·m−2)
Cakile maritima Scop. 330.0 a - - 467.1 b 46.0 c - 5808.0 d - 1571.3 e -
Echinophora spinosa L. 5543.3 a 11742.2 b 2941.2 c 4626.5 d 33.8 e 461.5 f - 128.3 g 6194.0 h 1892.8 i
Eryngium maritimum L. - 90.5 a - 6114.4 b 495.8 c 204.8 d - 606.9 e - 2598.5 f
Elymus farctus (Viv.) Runemark
ex Melderis 28896.0 a 18195.5 b 29342.3 a 31752.0 a 18106.8 b 7840.9 c - 16915.5 b 20251.0 b 7232.4 c
Ammophila arenaria (L.) Link - 2686.7 a - 2100.0 a - 94.5 b - - 19576.7 c -
Anthemis maritimaL. 6736.7 a 8862.5 b 7008.6 a 9569.7 b 2447.6 c 24605.4 d - - 12629.8 e 11801.1 e
Cyperus capitatus Vand. - 1095.1 ab - 552.7 b - 1356.5 a - - - 25098.0 c
Ononis variegataL. 425.6 a 8136.3 b - 6982.5 b - 3146.9 c - - - 1587.0 d
Medicago marinaL. - 6315.7 a 97.3 b 901.9 c - 1320.4 d - - - 7736.9 a
Crucianella maritimaL. - - - - - - - - - 9090.7
Calystegia soldanella(L.) R. Br. 1.0 a - - - - 3.7 a - - - 71.5 b
Sporobolus pungens(Schreb.) Kunth 2599.2 a 433.2 b 1067.6 c 153.6 d - 1092.0 c - 12.1 e 2266.0 f 946.0 c
Silene colorataPoir. 59.6 a 288.3 b 4.2 c 213.2 b - 76.9 a - - - 171.0 d
Pancratium maritimumL. - 25.2 a - 46.2 a 15.6 a 2893.3 b - - 540.7 c 2747.5 b
Salsola kaliL. 8.6 a - 0.8 b - 0.2 b - 3.0 c 2.3 c 0.9 b -
Chamaesyce peplis (L.) Prokh. 0.6 a - 1.3 a - 0.6 a - - - 5.1 b -
Total 44600.6 57871.1 40463.2 63479.7 21146.4 43096.7 5811.0 17665.0 63035.3 70973.5
TPB (g·m−2) TPB (g·m−2) TPB (g·m−2) TPB (g·m−2)
Cakile maritima Scop. 0.250 a - - 0.222 a 0.067 b - 5.870 c - 1.361 d -
Echinophora spinosa L. 4.107 a 9.683 b 2.999 c 4.779 a 0.120 e 0.662 f - 0.120 e 7.000 g 3.307 c
Eryngium maritimum L. - 0.257 a - 14.808 b 1.460 c 0.678 ac - 3.155 d - 6.671 e
Elymus farctus (Viv.) Runemark
ex Melderis 216.318 a 140.607 b 240.741 a 162.820 b 137.816 b 59.895 c - 104.67 d 152.935 b 58.615 c
Ammophila arenaria (L.) Link - 20.308 a - 13.984 a - 2.360 c - - 126.574 d -
Anthemis maritimaL. 27.417 a 34.724 b 23.760 a 43.325 c 12.393 d 93.795 e - - 41.468 c 58.814 f
Cyperus capitatus Vand. - 3.463 ab - 1.806 a - 4.647 b - - - 69.560 c
Ononis variegataL. 2.872 a 48.393 b - 50.274 b - 22.658 c - - 10.294 d
Medicago marinaL. - 34.770 a 0.860 b 6.677 c - 7.177 c - - - 33.947 a
Crucianella maritimaL. - - - - - - - - - 41.335
Calystegia soldanella(L.) R. Br. 0.007 a - - - - 0.025 a - - - 0.262 b
Sporobolus pungens(Schreb.) Kunth 15.391 a 2.651 b 7.301 c 1.116 d - 12.090 e - 0.140 f 23.948 g 5.115 bc
Silene colorataPoir. 0.234 a 1.023 b 0.012 c 0.809 bd - 0.630 de - - - 0.470 ae
Pancratium maritimumL. - 2.614 a - 4.375 b 2.316 a 163.306 c - - 22.888 d 105.987 e
Salsola kaliL. 0.047 cd - 0.006 a - 0.006 a - 0.084 b 0.063 bc 0.022 d -
Chamaesyce peplis (L.) Prokh. 0.002 a - 0.003 a - 0.003 a - - - 0.023 b -
Our results on the whole show significant variations of species presence and density between Ostia and Marina di Palidoro in response to the different human distur- bance. The strong human disturbance at Ostia is the re- sult of the large presence of beach establishments, nu- merous buildings, the intense use of mechanical means to clean the area and a strong human trampling all year long, which have largely altered the sand dune, and in particu- lar the foredune. In response to these factors, species colonize the dune area, on an average, at 79 m from the water-edge (mean of O1 and O2) extending along the gra-
dient toward the inland over a length of 26 m (mean value). PD is 40.8 ± 9.9 plants·m–2 (mean of all the con-
sidered O plots). In particular, O. variegata and E. farc- tus have the highest PD (15.4 ± 1.3 plants·m–2 mean value), followed by S. colorata and S. pugens (4.3 ± 3.9 plants·m–2, mean value), by
Ca. maritima, E. spinosa, E. maritimum, A. arenaria, A. maritima, C. capitatus, M. marina and C. soldanella (lower than 0.5 plants·m–2). C. soldanella is a prostrate plant with long rhizomes that survives seawater inundation better than many other spe- cies [40] which causes the aerial parts to die but the bur- ied rhizome may survive. This species co-occurs with E. farctus in many other foredune areas in Europe [41]. H and TPB vary from 18.3 m to 31.6 m and from 266.7 g·m–2 to 305.0 g·m–2, respectively.
total variance. Factor 1 and 2 accounted for 34.80% and 18.53% of the total variance, respectively. The first fac- tor reflected the turnover of the vegetation along the sea-inland vegetation zonation, with higher scores of the factor indicating species closer to the water-edge. Varia- tion in species composition among plots was greater in the longer and less disturbed transect of P (P2) as under-
lined by a greater dispersion of the plots in this sub-area along the second ordination axis (Figure 5).
4. Discussion
The natural vegetation of the Tyrrhenian coast which includes “The Roman Coast State Nature Reserve” until the years 1970-1980 was characterised by different vegetation bands. In particular, after the aphytoic dune area, the first community on the strandline was charac- terized by Ca. maritima, E. peplis and Salsola kali, fol- lowed by a second community on the foredune with E. farctus, S. pungens, and C. capitatus. The third commu- nity which contributed to dune consolidation was char- acterized by A. arenaria, E. spinosa, O. variegata, E. maritimum and M. marina and the inner community by Cr. maritima and P. maritimum, followed by the Medi- terranean maquis [9,35].
In stressful environments, species are patchily distrib- uted [36-38], however, spatial species aggregation may also be caused by within-community environmental hetero- geneity and preference for common micro-habitats [39].
[image:9.595.154.439.456.703.2]The lower human disturbance at P in respect to O, de- termines the species presence, on an average, at 14.5 m from the water-edge extending along the gradient toward
Figure 5. Ordination diagram of the considered plots for Ostia (sub-areas O1 and O2) and Marina di Palidoro (sub-areas P1
nd P2). The variance associated to the first two axes of the principal coordinate analysis is 34.80% and 18.53%, respectively.
a
the inland for a lengthof 61 m (mean value) and PD is 21.5 ± 16.1 plants·m–2 (mean of all the considered P
plots). In particular, S. pungens, E. farctus and O. varie- gata have the highest PD (6.0 ± 2.4 plants·m–2, mean value), followed by C. capitatus (2.1 ± 4.7 plants·m–2, mean value), by S. colorata and A. maritima (0.4 ± 0.1 plants·m–2, mean value) and by
E. spinosa, E. maritimum, M. marina, P. maritimum and C. soldanella (lower than 0.2 plants·m–2).
E. farctus and A. arenaria are rhizoma- tous species, with this last being the most important sand-fixing species with positive effects on sand stability [18,34,42] and the mycorrhizal symbiosis playing an im- portant role in the growth [43,44].
The results underline the larger species presence along the gradient from the water-edgetoward the inland in P compared to O where, on the contrary, plants exclusively colonize the inner areas due to the strong human distur- bance which causes the fore-dune to become flat. More- over, P2, characterised by a relatively lower disturbance
than P1, has a 72% higher PD and a species distribution
over a longer strip from water-edge toward the inland (53 and 73 m in P1 and P2, respectively). The study under-
lines the ability of the considered sand dune species to colonize the inner patch where microclimate and soil conditions are more favourable (by a 56% lower wind action and 12% higher SOM content, mean of the con- sidered O and P plots) than the areas closer to the water- edge. In response to the more favourable conditions, H increases by 62% in the plots further from the water- edge.
5. Conclusion
An increase in human impact in the near future, along with global change, could act on sand dune species changing their tolerance to stress factors. A management plan needs to restore the most damaged dune areas and actively prevent further environmental impacts. This could be accomplished by developing and implementing strategies which reconcile demands for human recreation with conservation that is within the ecological carrying capacity of coastal dunes [45]. Vegetation is an important controlling factor for dune morphology [46]. An efficient conservative management would consist of a temporary protection of already degraded areas [2]. A combination of a large variety of driving forces might suggest an un- surmountable complexity. In fact every dune site has its own history and management policy which should in-corporate this [22]. Moreover, the maintenance of coastal areas depends on the maintenance of native species [47]. Our results give information on the biodiversity of the Tyrrhenian coast including a natural protected area. The presence of the most important autoctonous sand dune species (on an average, 15, 15, 15 and 16 autoctonous
species grow at O1, O2, P1 and P2, respectively) can pro-
vide information for restoring the perturbed dune areas when preparing management strategies. In particular, A. arenaria could have a positive effect on sand dune stabi- lization by contributing to plant colonization under fa- vourable conditions [48]. It must be emphasized that species diversity and recovery capacity depend mostly on the undisturbed sand deposits in the foredunes by the limitation of human trampling and use of mechanical means and infrastructure development. This could favor sand deposits and consequently the species shift from the inland toward the water-edge, thus maintaining the coastal areas and their ecosystem services.
REFERENCES
[1] G. M. da Silva, P. Hesp, J. Peixoto and S. R. Dillenburg, “Foredune Vegetation Patterns and Alongshore Environ- mental Gradients: Mocambique Beach, Santa Catarina Is- land, Brazil,” Earth Surface Processes and Landforms, Vol. 33, No. 10, 2008, pp. 1557-1573.
http://dx.doi.org/10.1002/esp.1633
[2] A. Debez, K. B. Hamed, C. Grignon and C. Abdelly, “Salinity Effect on Germination, Growth, and Seed Pro- duction of the Halophyte Cakile maritime,” Plant and Soil, Vol. 262, No. 1-2, 2004, pp. 179-189.
http://dx.doi.org/10.1023/B:PLSO.0000037034.47247.67 [3] F. A. Donnelly and N. W. Pammenter, “Vegetation Zona-
tion on a Natal Coastal Sand-Dune System in Relation to Salt Spray and Soil Salinity,” South African Journal of Botany, Vol. 2, No. 1, 1983, pp. 46-51.
[4] M. Gilbert, N. Parameter and B. Ripley, “The Growth Responses of Coastal Dune Species Are Determined by Nutrient Limitation and Sand Burial,” Oecologia, Vol. 156, No. 1, 2008, pp. 169-178.
http://dx.doi.org/10.1007/s00442-008-0968-3
[5] A. M. Avis and R. A. Lubke, “The Effect of Wind Borne Sand and Salt Spray on the Growth of Scirpus nodosus in a Mobile Dune System,” South African Journal of Botany, Vol. 1, No. 2, 1985, pp. 100-110.
[6] H. Yura and A. Ogura, “Sandblasting as a Possible Factor Controlling the Distribution of Plants on a Coastal Dune System,” Plant Ecology, Vol. 185, No. 2, 2006, pp. 199- 208. http://dx.doi.org/10.1007/s11258-005-9095-y [7] K. Pye and H. Tsoar, “Aeolian Sand and Sand Dunes,”
Springer, Berlin, 2009.
http://dx.doi.org/10.1007/978-3-540-85910-9
[8] J. A. Stallins and A. J. Parker, “The Influence of Complex Systems Interactions on Barrier Island Dune Vegetation Pattern and Process,” Annals of the Association of American Geographers, Vol. 93, No. 1, 2003, pp. 13-29. http://dx.doi.org/10.1111/1467-8306.93102
[9] L. Gratani, L. Varone and M. F. Crescente, “Photosyn- thetic Activity and Water Use Efficiency of Dune Species: The Influence of Temperature on Functioning,” Photo- synthetica, Vol. 47, No. 4, 2009, pp. 575-585.
[10] M. G. Barbour, “Life at the Leading Edge: The Beach Plant Syndrome,” In: V. Seeliger, Ed., Coastal Plant Communities of America, Academic Press, New York, 1992, pp. 291-307.
[11] L. Gratani and G. Capannesi, “Cambiamenti in Vigore di Ammophila littoralis in Relazione Alla Sua Posizione Sulle Dune,” Collana dei Rapporti Tecnici dell’ENEA, ENEA-RT/PAS/84/18, 1984, pp. 3-12.
[12] B. S. Ripley and N. W. Pammenter, “Do Low Standing Biomass and Leaf Area Index of Sub-Tropical Coastal Dunes Ensure that Plants Have an Adequate Supply of Water?” Oecologia, Vol. 139, No. 4, 2004, pp. 535-544. http://dx.doi.org/10.1007/s00442-004-1535-1
[13] R. Grunewald and H. Schubert, “The Definition of a New Plant Diversity Index ‘H’dune’ for Assessing Human Damage on Coastal Dunes—Derived from the Shannon index of Entropy H’,” Ecological Indicators, Vol. 7, No. 1, 2007, pp. 1-21.
http://dx.doi.org/10.1016/j.ecolind.2005.09.003
[14] C. Hobohm, “Plant Species Diversity and Endemism on Islands and Archipelagos, with Special Reference to the Macaronesian Islands,” Flora, Vol. 195, No. 1, 2000, pp. 9-24.
[15] D. Tilman, P. Reich, J. Knops, D. Wedin, T. Mielke and C. Lehman, “Diversity and Productivity in a Long-Term Grassland Experiment,” Science, Vol. 294, No. 5543, 2001, pp. 843-845.
http://dx.doi.org/10.1126/science.1060391
[16] N. M. Voronkova, E. V. Burkovskaya, T. A. Bezdeleva and O. L. Burundukova, “Morphological and Biological Features of Plants Related to Their Adaptation to Coastal Habitats,” Russian Journal of Ecology, Vol. 39, No. 1, 2008, pp. 1-7.
http://dx.doi.org/10.1134/S1067413608010013
[17] G. Baeyens and M. L. Martínez, “Animal Life on Coastal Dunes: From Exploitation and Prosecution to Protection and Monitoring,” In: M. L. Martínez and N. P. Psuty, Eds., Coastal Dunes, Ecology and Conservation, Eco- logical Studies, Springer-Verlag, Berlin, 2004, pp. 279- 296. http://dx.doi.org/10.1007/978-3-540-74002-5_17 [18] S. Rodríguez-Echeverría and H. Freitas, “Diversity of
AMF Associated to Ammophila arenaria ssp. arundina- cea in Portuguese Sand Dunes,” Mycorrhiza, Vol. 16, No. 8, 2006, pp. 543-552.
http://dx.doi.org/10.1007/s00572-006-0070-9
[19] E. Van der Maarel, “Some Remarks on the Functions of European Coastal Ecosystems,” Phytocoenologia, Vol. 33, No. 2-3,2003, pp. 187-202.
http://dx.doi.org/10.1127/0340-269X/2003/0033-0187 [20] E. Forey, B. Chapelet, Y. Vitasse, M. Tilquin, B. Touzard
and R. Michalet, “The Relative Importance of Distur- bance and Environmental Stress at Local and Regional Scales in French Coastal Sand Dunes,” Journal of Vege- tation Science, Vol. 19, No. 4, 2008, pp. 493-502. http://dx.doi.org/10.3170/2008-8-18392
[21] J. P. Grime, “Plant Strategies and Vegetation Processes,” John Wiley and Sons, Chichester, 1979, 222p.
[22] S., Provoost, M. L. M. Jones and S. E. Edmondson,
“Changes in Landscape and Vegetation of Coastal Dunes in Northwest Europe: A Review,” Journal of Coastal Conservation,Vol. 15, No. 1, 2011, pp. 207-226. http://dx.doi.org/10.1007/s11852-009-0068-5
[23] R. C. Kay and J. Alder, “Coastal Planning and Manage- ment,” E&F Spon, London, 2005.
[24] J. H. Connell, “Diversity in Tropical Rain Forests and Coral Reefs,” Science, Vol. 199, No. 4335, 1978, pp. 1302-1310.
http://dx.doi.org/10.1126/science.199.4335.1302
[25] J. P. Grime, “Control of Species Diversity in Herbaceous Vegetation,” Journal of Environmental Management, Vol. 1, No. 1, 1973, pp. 151-167.
[26] C. J. Lortie, R. W. Brooker, P. Choler, Z. Kikvidze, R. Michalet, F. I. Pugnaire and R. M. Callaway, “Rethinking plant community theory,” Oikos,Vol. 107, No. 2, 2004, 433-438.
http://dx.doi.org/10.1111/j.0030-1299.2004.13250.x [27] R. H. MacArthur and E. O. Wilson, “The Theory of Is-
land Biogeography,” Princeton University Press, Princeton, 1967.
[28] C. Caputo, “Il Litorale Laziale da Capo Linaro ad Anzio: Caratteristiche Fisiografiche e Variazioni Recenti Della Linea di Riva,” 19 Forum La Fascia Costiera Tosco- Ligure-Laziale, Forte dei Marmi, Italy, 1989, pp. 31-38. [29] J. R. Sims and V. A. Haby, “Simplified Colorimetric
Determination of Soil Organic Matter,” Soil Science, Vol. 112, No. 2, 1971, pp. 137-141.
http://dx.doi.org/10.1097/00010694-197108000-00007 [30] A. Walkley, “A Critical Examination of a Rapid Method
for Determining Organic Carbon in Soils: Effects of Variations in Digestion Conditions and of Inorganic Soils Constituents,” Soil Science, Vol. 63, No. 4, 1947, pp. 251-264.
http://dx.doi.org/10.1097/00010694-194704000-00001 [31] L. Gratani, M. Amadori, C. Marinucci and M. Moriconi,
“Study of the Relations between Biomass and Specific Cover in Psammophile Vegetation (Circeo National Park, Italy),” Annali di Botanica, Vol. 40, No. 1, 1982, pp. 97- 106.
[32] C. Marinucci and L. Gratani, “Cartografia Della Vege- tazione e Della Biomassa,” Annali di Botanica, Vol. 41, No. 1, 1983, pp. 113-131.
[33] J. S. Singh, W. K. Lauenroth and R. K. Sernhorst, “Re- view and Assessment of Various Techniques for Esti- mating Net Aerial Primary Production in Grasslands from Harvest Data,” Botanical Review, Vol. 41, No. 2, 1975, pp. 181-232. http://dx.doi.org/10.1007/BF02860829 [34] E. Forey, C. J. Lortie and R. Michalet, “Spatial Patterns
of Association at Local and Regional Scales in Coastal Sand Dune Communities,” Journal of Vegetation Science, Vol. 20, No. 5, 2009, pp. 916-925.
http://dx.doi.org/10.1111/j.1654-1103.2009.01095.x [35] L. Gratani, M. Amadori and L. Veri, “A Preliminary
[36] P. Haase, F. L. Pugnaire, S. C. Clark and L. D. Incoll, “Spatial Patterns in a Two-Tiered Semi-Arid Shrubland in Southeastern Spain,” Journal of Vegetation Science,Vol. 7, No. 4, 1996, pp. 527-534.
http://dx.doi.org/10.2307/3236301
[37] S. Kefi, M. Rietkerk, C. L. Alados, Y. Pueyo, V. P. Pa- panastasis, A. ElAich and P. C. de Ruiter, “Spatial Vege- tation Patterns and Imminent Desertification in Mediter- ranean Arid Ecosystems,” Nature, Vol. 449, No. 7159, 2007, pp. 213-217. http://dx.doi.org/10.1038/nature06111 [38] D. Malkinson, R. Kadmon and D. Cohen, “Pattern
Analysis in Successional Communities—An Approach for Studying Shifts in Ecological Interactions,” Journal of Vegetation Science, Vol. 14, No. 2, 2003, pp. 213-222. [39] R. Michalet, “Is Facilitation in Arid Environments the
Result of Direct or Complex Interactions?” New Phytolo- gist, Vol. 169, No. 1, 2006, pp. 3-6.
http://dx.doi.org/10.1111/j.1468-8137.2006.01617.x [40] M. G. Barbour and T. De Jong, “Response of West Coast
Beach Taxa to Salt Spray, Seawater Inundation and Soil Salinity,” Bulletin of the Torrey Botanical Club, Vol. 104, No. 1, 1977, pp. 29-34.
http://dx.doi.org/10.2307/2484662
[41] D. Harris and A. J. Davy, “The Regenerative Potential of Elymus farctus from Rhizome Fragments and Seeds,” Journal of Ecology, Vol. 74, No. 1, 1986, pp. 1057-1067. http://dx.doi.org/10.2307/2260233
[42] A. H. L. Huiskes, “Biological Flora of the British Isles: Ammophila arenaria (L.) Link,” Journal of Ecology, Vol. 67, No. 1, 1979, pp. 363-382.
http://dx.doi.org/10.2307/2259356
[43] L. Gratani, “A Critical Approach to the Problem of the Vigour of Ammophila littoralis (Beauv.) Rothm.,” Ecolo-gia Mediterranea, Vol. 13, No. 1-2, 1987, pp. 53-60. [44] J. V. Perumal and M. A. Maun, “The Role of Mycorrhizal
Fungi in Growth Enhancement of Dune Plants Following Burial in Sand,” Functional Ecology, Vol. 13, No. 4, 1999, pp. 560-566.
http://dx.doi.org/10.1046/j.1365-2435.1999.00348.x [45] L. M. C. Thompson and T. A. Schlacher, “Physical
Damage to Coastal Dunes and Ecological Impacts Caused by Vehicle Tracks Associated with Beach Camping on Sandy Shores: A Case Study from Fraser Island, Austra- lia,” Journal of Coastal Conservation, Vol. 12, No. 2, 2008, pp. 67-82.
http://dx.doi.org/10.1007/s11852-008-0032-9
[46] S. A. Wolfe and W. G. Nickling, “The Protective Role of Sparse Vegetation in Wind Erosion,” Progress in Physi- cal Geography, Vol. 17, No. 1, 1993, pp. 50-68. http://dx.doi.org/10.1177/030913339301700104
[47] M. W. Schwartz, C. A. Brigham, J. D. Hoeksema, K. G. Lyons, M. H. Mills and P. J. van Mantgem, “Linking Bio- diversity to Ecosystem Function: Implications for Con- servation Ecology,” Oecologia, Vol. 122, No. 3, 2000, pp. 297-305. http://dx.doi.org/10.1007/s004420050035 [48] K. F. Nordstrom, N. L. Jackson, J. M. Hartman and M.
Wong, “Aeolian Sediment Transport on a Human-Altered Foredune,” Earth Surface Processes and Landforms, Vol. 32, No. 1, 2007, pp. 102-115.