Munich Personal RePEc Archive
Are small groups expected utility?
Morone, Andrea and Morone, Piergiuseppe
University of Bari, University of Foggia, University Jaume of
Castellón
2012
Online at
https://mpra.ub.uni-muenchen.de/38198/
Are small groups Expected Utility?
♣
A. Moronea and P. Moroneb
This version: 08/03/2012
Abstract: In this paper we analyse the empirical performance of several preference functionals using individual
and group data. Our investigation aims to address two fundamental questions that have, until now, not been
addressed in literature. Specifically, we intend to assess if there exists a risky choice theory that statistically fits
group decisions significantly better than alternative theories, and if there are significant differences between
individual and group choices. Experimental findings reported in this paper provide answers to both questions
showing that when risky choices are undertaken by small groups (dyads in our case), disappointment aversion
outperforms several alternative preference functionals, including expected utility. Since expected utility typically
emerged as the dominant model in individual risky choices, this finding suggests that differences between
individual and group choices exist, showing that the preference aggregation process drives out EU.
Keywords: group decision, expected utility, risk and uncertainty.
JEL codes: C91, C92, D81, D70
♣ The experiment was conducted at the ESSE laboratory at the University of Bari and financed by the same
University. The paper was written up while Piergiuseppe Morone was visiting the University Jaume I of Castellón, for whose hospitality and financial support he is grateful
a University of Bari - Italy, Department of Economics and University Jaume of Castellón - Spain, Department of
Economics. Email: [email protected]
b University of Foggia - Italy, Department of Economics and University Jaume I of Castellón - Spain,
1. Introduction
Since its axiomatization by von Neumann and Morgenstern (1944), the expected utility theory
(EUT) has been the dominant framework for analysing individual decision problems under
risk and uncertainty. Starting with the well-known paradox of Allais (1953), however, a large
body of experimental evidence, indicating that individuals systematically tend to violate the
assumptions underlying EUT, was produced. This experimental evidence motivated
researchers to develop alternative theories of choice under risk and uncertainty that were able
to accommodate the observed patterns of behaviour. Nowadays a large number of alternative
theories exist (e.g. regret theory, disappoint aversion, prospect theory, rank-dependent theory,
etc.).1 Naturally, the question arises: Which theory can best explain observed choice behaviours? To address this question many experimentalists studied and compared the
empirical performance of single alternatives. Most notable, this line of research was
significantly advanced by Harless and Camerer (1994) and Hey and Orme (1994).
All of the existing studies, we are aware of, use individual choice data in order to evaluate the
alternatives.2
However, decision processes are not always individual, there are many
circumstances where individuals make their decisions in groups. It is striking that neither the
validity of expected utility3 nor the comparative performances of the single alternative theories of choice under risk and uncertainty have been systematically investigated with group
decision. This paper therefore aims to fill this gap, presenting results of an experiment
designed to address the following research questions: Is there a risky choice theory fits group
decisions significantly better (in a statistical sense)? And, are there significant differences (in
an economic sense) between individual and group choices?
The remainder of the paper proceeds as follows: Section 2 briefly presents the relevant
literature on group decision and risk. Experimental design is discussed in section 3. Section 4
explains the estimation procedure. Section 5 presents our experimental results and section 6
concludes.
1 See Starmer, 2000; Sugden, 2004 and Schmidt, 2004 for a comprehensive survey.
2 See, among others, Carbone and Hey (1994, 1995), Morone (2008), Hey et al. (2009).
3
2. Risk and group decisions
Recently, growing experimental literature has explored differences between individuals and
groups (or between groups of different size) in various decision contexts involving strategic
behaviours.4
However, experimental investigations on non-strategic group risky choices are more scant. In
fact, there is only limited evidence of group, as opposed to individual, behaviour. Earlier
studies by Bone (1998) and Bone et al. (1999) provided some interesting results, suggesting
that the common effects observed in the literature regarding EUT (the common ratio and
preference reversal effects) are observable also in groups.
More recently, Bateman and Munro (2005) provided results of an experiment designed to
investigate to what extent decisions made by couples and decisions made separately by
individuals (who are part of a couple) conform to EUT. The authors used established couples
and presented them individually and jointly with decisions involving monetary payoffs,
finding that joint choices are more risk averse than those made by individuals. Moreover,
experimental findings showed that couples display the same anomalous patterns in their risky
choices as are regularly recorded in individual choice experiments.
Along this line of investigation, Shupp and Williams (2008) evaluate risk aversion using price
data elicited by a willingness to pay mechanism for risky prospects. They find that the
variance of risk preferences is generally smaller for groups than individuals and the average
group is more risk averse than the average individual in high-risk situations, but groups tend
to exhibit lower risk aversion than individuals in low-risk situations.
Subsequently, commenting on the paper by Charness et al. (2007) that shows how salient
group membership has a strong effect on individual decisions in coordination and prisoner’s
dilemma games, Sutter (2009) demonstrated that their findings also apply to non-strategic
decisions. By performing an investment experiment the author showed that individual
decisions with salient group membership are largely the same as team decisions; a finding that
helps bridge the literature on team decision-making and on group membership effects.
Finally, Masclet et al. (2009) conducted a field experiment (recruiting salaried and
self-employed workers) and explored individual and group decisions under risk and uncertainty.
The authors found that groups are more likely than individuals to choose safe lotteries and
4 Beauty-contest games (Kocher and Sutter, 2005; Kocher et al., 2007; Sutter, 2005), centipede games (Bornstein
that individuals risk attitude is correlated with the socio-demographic characteristics of the
participant to the experiment (namely, the type and the sector of employment).
Although very relevant, none of these studies attempts to compare EU and non-EU theories of
risky choices. In fact, the field of risky choice has extensively investigated individual decision
processes under risk and uncertainty, expending much effort to scrutinize EUT and proposing
many alternatives that should, in principle better accommodate individual choice anomalies
typically observed in empirical assessments. However, as mentioned in the introduction, there
is a void in the literature in assessing alternative theories when it comes to group choices.
Moving on from this, we report hereafter on the first economic experiment that attempts to fit
EU preference functional and a number of its generalizations to group decisions and compare
their relative performance.
3. Experimental Design
The experiment presented here closely follows that of Hey and Orme’s (1994). We recruited
students from the University of Bari via a mailing-list system. They were presented with a set of
pairwise choice questions; each pairwise choice is composed of two lotteries, labelled
“Lottery A” and “Lottery B”, of the kind depicted in Figure 1. Each subject has to report
[image:5.595.92.505.481.720.2]his/her preference between the two lotteries.5
Figure 1: The Presentation of Lotteries
Lottery A Lottery B
5
Note that we are deliberately not allowing subjects to express indifference between lotteries. This simplifies our data analysis since, if subjects are given the opportunity to express indifference and take advantage of this opportunity, it is not obvious how one should treat such responses (see Hey, 2001). Moreover, this choice does not affect the value of the experiment to the subjects, since if subjects are truly indifferent it does not matter how they respond, given the adopted incentive mechanism.
12.5%& 175€&
87.5%& 125€&
12.5%& 75€&
The experiment was conducted at the ESSE laboratory of experimental economics at the
University of Bari in November 2008 with 38 participants. Each participant attended two
separate and subsequent sessions: in Session 1 subjects played individually, in Session 2 they
played in randomly created groups of two6
.
In each session participants were presented with the same 100 pairwise choice lotteries (reported
in Table A1, in Appendix 1). The time taken to complete each session varied between the two
sessions and also across subjects, since participants were explicitly encouraged to proceed at
their own pace.7
The incentive mechanism was that the chosen lottery would be played for
real. Specifically, whenever a group completed Session 2, one question was randomly selected
for each subject (from both sessions) and played out for real. The average payment made to the
38 subjects over these two sessions was €97.50; the maximum payment to any subject was
€175 and the minimum €25. Consequently, the average payment was around €83.6 per hour
spent doing the experiments. This is considerably above the marginal wage rate of the subjects
performing the experiment.
4. Estimation procedure and preference functionals
As mentioned earlier, our study closely follows that of Hey and Orme’s (1994), whose analysis
is grounded on two fundamental observations. First, there is not necessarily one best preference
functional for all subjects, but the behaviour of different subjects may be explained best by
different functionals. Second, subjects make errors from time to time in their responses, which
demand a stochastic specification of preference functionals for our empirical test. To take into
account the first observation, we estimated each model subject by subject. To take into account
the second observation, we added an error term to each preference functional assuming that
errors are identically and independently distributed among subjects and questions.
4.1 Some notes on estimation techniques
Let’s indicate the two lotteries in the pairwise choice by A and B; then, assuming that there is no
noise or error in the subject’s responses, she/he will report a preference for A, if and only if
EU(A) > EU(B) – that is, if and only if E[u(A) - u(B)] > 0. However, as we know from the
existing literature, subjects’ responses are typically affected by noise. If we denote this noise or
6 We are aware that there are many factors that can affect group decisions (e.g. gender, age, placement of group
members). Additionally, the social interaction between a man and a woman can be quite different than between two men or two women. For instance, "beauty" and other stereotypes can have huge impact on the outcomes of group decisions (Andreoni and Petrie, 2008). To minimise the impact of such problems, we kept the pairs identity confidential so that each group member maintained anonymity with subjects communicating through the computer interface.
7
measurement error by 𝜖, then the subject will report a preference for A if, and only if, E[u(A) -
u(B)] + 𝜖 > 0, that is, if and only if 𝜖 > E[u(B) - u(A)]. Following this line of reasoning, we can
now write the probability that the subject reports a preference for A as: Prob{𝜖 > E[u(B) -
u(A)]}.8
Having determined the actual reported preferences, we then proceed to the estimation of the
parameters using maximum likelihood methods. To do so, we need to specify the distribution of
the measurement error, which we shall assume to be normally distributed with mean 0 and
variance s. As noted by Hey and Orme (1994), the magnitude of s measures the noisiness of the
subject’s responses: if s = 0, then the subject makes no mistakes. As s increases, the noise also
increases. As s approaches infinity, there is no information content in the subject’s responses.
Note that when estimating an utility function from an experiment, there are two usual
approaches: (a) to assume a particular functional form and estimate the parameters of that form;
(b) to estimate the utility at the various outcome values used in the experiment. In our estimation
we follow the latter technique.
4.2 The preference functionals
In the experiment reported here there were four outcome values (€25, €75, €125, and €175),
which we denote by x1, x2, x3 and x4. 9
Let x = {x1, x2, x3, x4} be the vector of outcomes. Since we
used a pairwise choice gamble to derive preference statements, our data involved two lotteries
represented by two probability vectors denoted by p = {p1, p2, p3, p4} and q = {q1, q2, q3, q4}. Let
W denote the subject’s preference functional and V(p, q) = W(p)-W(q) the relative evaluation or
net preference functional. All those subjects who exhibit a positive net preference functional (i.e.
V(p, q) > 0) strictly prefer lottery A over lottery B. Conversely, all those subjects who exhibit a
negative net preference functional (i.e. V(p, q) < 0) strictly prefer lottery B over lottery A.
Finally, if V(p, q) = 0, then subjects are indifferent between the two lotteries.
As mentioned earlier, subjects state their preferences with some error; hence have: 𝑉∗ 𝒑,𝒒 =
𝑉 𝒑,𝒒 +𝜖, where 𝜖 is the error term. As mentioned above, 𝜖 is normally distributed with mean
0 and variance s; introducing a further normalization we can put s = 1 hence obtaining
𝜖 is 𝑁(0,𝑠).10
8 Note that the probability that the subject reports a preference for B can be derived accordingly. 9
Note that for the estimation of parameters we follow Hey and Orme (1994). The theoretical foundation of the employed estimation technique can be found in Orme (1995).
10 As observed by Hey and Orme (1994: 1301), an alternative procedure would be, in addition to u(x
1) = 0, to put
u(x4) = 1 and then specify the error variance to be 𝜎!; in this case one should estimate 𝜎 in addition to u(x2) and
u(x3). Choosing instead to put the error variance equal to unity we will estimate u(x2), u(x3), and u(x4). The two
The first model we estimate is risk neutrality, given by 𝐑𝐍: 𝑉∗ 𝒑,𝒒 =𝑘 !! 𝑝! −𝑞! 𝑥! +𝜖
!! .
In this model we have to estimate only the parameter k, which is the relative magnitude of
subjects’ errors.
The second model we estimate is expected utility, given by 𝐄𝐔: 𝑉∗ 𝒑,𝒒 = !!!! 𝑝! −
𝑞! 𝑢 𝑥! +𝜖. We normalized u(x1) to zero, and the variance of the error term to unity. We did
the same also for the alternative theories presented below.
The third model is the theory of disappointment aversion introduced by Gul (1991). The main
psychological motivation of this theory is the hypothesis that choice behaviour tries to avoid the
disappointment that would result if the actual outcome of the lottery were lower than the
certainty equivalent. In our framework, disappointment aversion is characterized as follows
D𝐀: 𝑉∗ 𝐩,𝐪 = 𝑚𝑖𝑛
!!!! !!! !!! !! ! ! !!! !! !!!!! !!! !!! !!! !!!!! !!! − ! !! !!!!! ! ! !!! !! !!!!! !!! !!! !!! !!!!! !!!
+𝜖.
Note that β is an additional parameter, which determines the degree of disappointment aversion.
If β = 0, then DA reduces to EU. Our characterization initially appears different from that of Hey
and Orme’s (1994), but it can be shown that they are identical (see Appendix 2).
The fourth model is rank-dependent expected utility theory, which is nowadays the most
prominent alternative to EU. We estimate two variants of rank-dependent utility, one with a
power weighting function and one with the weighting function proposed by Quiggin (1982).
For rank-dependence with power function the weighting function w is given by w(r) = rγ and we
have 𝐑𝐏: 𝑉∗ 𝐩,𝐪 = 𝑢 𝑥! !! 𝑝! !!
!
− !!!!!!𝑝!
!
𝑞!
! !!!
!
− !!!!!!𝑞! !
!
!!! +
ϵ. Note that if γ = 1, then RP reduces to EU.
For rank-dependence with “Quiggin” weighting function (Quiggin, 1982), the weighting
function is given by w(r) = rγ / [rγ + (1 – r)γ]1/γ, which yields
𝐑𝐐: 𝑉∗ 𝐩,𝐪 = 𝑢 𝑥! !!
! !!! ! !! ! !!! ! ! !! ! !! !!! !! !− !! ! !!!!! ! !! ! !!!!! ! ! !! ! !! !!!!! ! ! ! − ! !!! !! ! !!! ! !! ! !!! ! ! !! ! !! !!! !! !− !! ! !!!!! ! !! ! !!!!! ! ! !! ! !! !!!!!
!! ! +ϵ. Note that RQ reduces to EU if
γ = 1.11
and u(x4), while a subject who makes relatively large errors will have relatively small values for u(x2), u(x3), and
u(x4). Under the alternative procedure, the relatively careful subject would have a relatively small value for 𝜎.
11 We also estimated Prospective Reference Theory and Weighted Utility Theory. Consistent with existing
5. Results
As we stated in the introduction, what we are trying to understand here is if there is a theory
of risky choice that fits group decisions significantly better than the alternatives, and if there
are significant differences among individual and group choice. In order to address the first of
these two questions, we used the Akaike information criterion to provide a ranking of the
various functionals.
Following Hey and Orme (1994), and provided that we always have the same number of
observations across all models, the corrected-log-likelihood Akaike information criterion
(CAIC) can be written as 𝐶𝐴𝐼𝐶 =𝑙𝑜𝑔𝐿 𝛼 −𝑘; where 𝐿 𝛼 is the maximized likelihood for a
particular estimated preference functional and k is the number of estimated parameters in that
functional. The smaller CAIC is, the better the model will be.
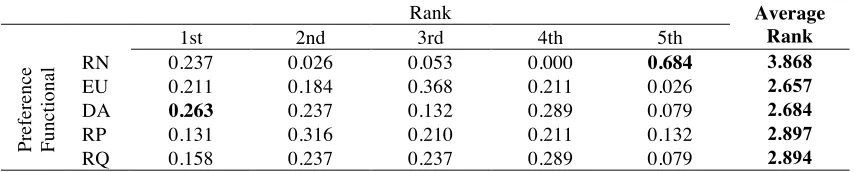
We report rankings for individual and group treatments in Table 1 and Table 2, respectively.
In the last column of these two tables we also report the average rankings, averaged over all
[image:9.595.85.512.405.491.2]subjects (of course, the smaller this value is, the better the model will be).
Table 1: Performance (%) of the five preference functionals based on individual data
Rank Average
Rank
1st 2nd 3rd 4th 5th
Pr
ef
er
en
ce
Fu
n
ct
io
n
al RN 0.237 0.026 0.053 0.000 0.684 3.868
EU 0.211 0.184 0.368 0.211 0.026 2.657
DA 0.263 0.237 0.132 0.289 0.079 2.684
RP 0.131 0.316 0.210 0.211 0.132 2.897
RQ 0.158 0.237 0.237 0.289 0.079 2.894
Table 1 suggests that EU is, overall, the best performing model on this criterion and that DA is a
reasonably close second best. Moreover, rank-dependent models (both with the Quiggin
weighting function and with the power weighting function) do fairly well; conversely, RN is the
worst performing model. The reader should be cautioned that average values hide a considerable
variation across subjects,12 which can be partially unveiled by looking at the percentage values of each rank position. Specifically, we can observe that DA ranks first with 26.3% of the cases and
either first or second in half of the cases. This makes DA the winner on this criterion. Consistent
with earlier findings obtained by Hey and Orme (1994), we can conclude that, when looking at
risky choices undertaken individually, expected utility theory also emerges “fairly intact” in our
analysis.
12
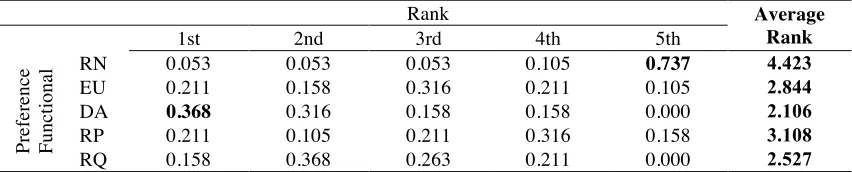
When looking at group data (see Table 2), the emerging picture is partially different. Now, the
best performing model is disappointment aversion, RQ ranks second and expected utility ranks
only third. Decomposing the average rank as we did above, we can observe that DA ranks first
with 36.8% of the cases and either first or second in almost 70% of the cases. This makes DA the
absolute winner in the group treatment. This finding answers our first question: Disappointment
[image:10.595.85.511.237.323.2]aversion fits group data significantly better than any other theory, including expected utility.
Table 2: Performance (%) of the five preference functionals based on group data
Rank Average
Rank
1st 2nd 3rd 4th 5th
Pr
ef
er
en
ce
Fu
n
ct
io
n
al RN 0.053 0.053 0.053 0.105 0.737 4.423
EU 0.211 0.158 0.316 0.211 0.105 2.844
DA 0.368 0.316 0.158 0.158 0.000 2.106
RP 0.211 0.105 0.211 0.316 0.158 3.108
RQ 0.158 0.368 0.263 0.211 0.000 2.527
Hence, when it comes to group decisions, DA outperforms EU; a result that did not occur with
individual decision data. Consequently, this also contributes towards answering our second
question, suggesting that there are significant differences between individual and group choice.
To further validate these finding, we shall perform two other tests. First, we will compare the
performance of alternative models with EU (Table 3) using again the CAIC; then we will
[image:10.595.191.404.514.597.2]perform a likelihood ratio test to test the superiority of alternatives with respect to EU (Table 4).
Table 3: Performance (%) of alternative models w.r.t. the EU model
Individuals Groups
EU vs. DA 0.500 0.260
EU vs. RP 0.550 0.530
EU vs. RQ 0.550 0.470
Table 3 reports pair comparisons and shows that EU outperforms alternative models in half or
more of the cases when referring to individuals’ treatment. This percentage is quite stable when
comparing EU with RP and RQ in groups’ treatment, but it drops to 26% when we compare EU
with DA. This result corroborates our earlier finding regarding the superiority of the DA model
when it comes to group risky decisions.
Recall now that DA, RP and RQ are all generalizations of EU, in the sense that the latter is a
compared to EU. Moving down from higher levels to lower levels involves parameter
restrictions. In the context of this experiment, going from DA, RP and RQ to EU always
involves one parameter restriction. Accordingly, we can use standard likelihood ratio tests to
investigate whether the higher level functionals fit significantly better than the lower level
functionals, by which we mean that the parameter restrictions that reduce the higher-level
[image:11.595.157.439.253.344.2]functional to the lower-level functional are rejected at the appropriate significance level.
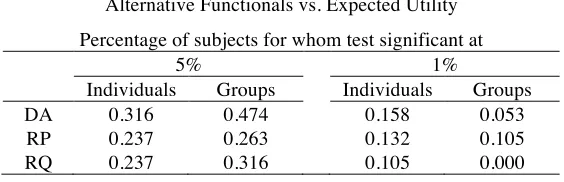
Table 4: Likelihood ratio tests for the superiority of higher-level models
Alternative Functionals vs. Expected Utility
Percentage of subjects for whom test significant at
5% 1%
Individuals Groups Individuals Groups
DA 0.316 0.474 0.158 0.053
RP 0.237 0.263 0.132 0.105
RQ 0.237 0.316 0.105 0.000
Table 4 reports the results of carrying out such tests at two levels of significance (i.e. 5% and
1%). Most notably, this test shows that, at the 5% level, EU is rejected in favour of DA for
considerably more subjects on the group treatment than on individual treatment. Moreover, the
percentage of times EU is rejected in favour of one of the alternatives always grows as we move
from individuals to groups. This suggests that the preference aggregation process drives out
EU.13
6. Conclusions
In this paper we analysed the empirical performance of several preference functionals using
individual and group data. Our investigation aimed at addressing two fundamental questions
never addressed before in the literature. Specifically, we intended to assess if there exists a risky
choice theory fits group decisions significantly better (in a statistical sense) than alternative
theories, and if there are significant differences (in an economic sense) between individual and
group choices. As we believe, we succeeded to provide answers to both questions showing that
when risky choices are undertaken by small groups (dyads in our case), disappointment aversion
outperformed several alternative preference functionals. Most notably, this handful of
alternatives included expected utility, which typically emerged as the dominant model in
individual risky choices. This latter finding suggests that differences exist between individual
13
and group choices, showing that the preference aggregation process drives out EU. Hence, we
can conclude that even if subjects are EU, small groups are not.
As a concluding remark, we would like to caution the reader on a critical point: Although
relevant, these aggregate findings hide a considerable variation across subjects as well as groups,
suggesting that groups are different as much as people are different. Therefore it is hard to find a
preference functional that clearly wins all alternatives. More likely, we can find (as we indeed
found) a functional that better fits group data, always bearing in mind the underlying
References
Allais, M. (1953), “Le Comportement de l'Homme Rationnel devant le Risque, Critique des
Postulates et Axiomes de l'Ecole Américaine”, Econometrica 21, 503-546.
Andreoni, J., and Petrie, R., (2008). “Beauty, gender and stereotypes: Evidence from
laboratory experiments”, Journal of Economic Psychology, Elsevier, vol. 29(1), pages
73-93.
Bateman, I., and Munro, A. (2005), “An Experiment on Risky Choice Amongst Households”,
Economic Journal, Royal Economic Society, vol. 115(502), pages 176-189.
Blinder, A. S., and Morgan, J. (2005) "Are Two Heads Better than One? Monetary Policy by
Committee," Journal of Money, Credit and Banking, Blackwell Publishing, vol. 37(5),
pages 789-811.
Bone, J, (1998), “Risk-sharing CARA individuals are collectively EU”, Economics Letters,
Elsevier, vol. 58(3), pages 311-317.
Bone, J., Hey J. D. and Suckling J. (1999), “Are Groups More (or Less) Consistent Than
Individuals?”, Journal of Risk and Uncertainty, Springer, vol. 18(1), pages 63-81, April.
Bornstein, G., and Yaniv, I. (1998), "Individual and Group Behavior in the Ultimatum Game:
Are Groups More “Rational” Players?" Experimental Economics, Springer, vol. 1(1),
pages 101-108.
Bornstein, G., Kugler, T., and Ziegelmeyer, A. (2004). "Individual and Group Decisions in
the Centipede Game: Are Groups More “Rational” Players?," Journal of Experimental
Social Psychology, Volume 40, Issue 5, September 2004, Pages 599–605
Carbone, E. and Hey J. D. (1994) “Estimation of Expected Utility and Non-Expected Utility
Preference Functionals Using Complete Ranking Data”, In B. Munier and M.J. Machina
(eds.), Models and Experiments on Risk and Rationality, Kluwer, Boston, 119-39.
Carbone, E. and Hey J. D. (1995) “A Comparison of the Estimates of EU and non-EU
Preference Functionals Using Data from Pairwise Choice and Complete Ranking
Experiments”, Geneva Papers on Risk and Insurance Theory 20, 111-133.
Cason, T. N. & Mui, V. (1997), "A Laboratory Study of Group Polarisation in the Team
Dictator Game", Economic Journal, Royal Economic Society, vol. 107(444), pages
1465-83.
Charness, G., Rigotti L., and Rustichini A. (2007), “Individual Behavior and Group
Membership” American Economic Review, American Economic Association, vol.
Hayne, S. and Cox, J. (2006), “Barking Up the Right Tree: Are Small Groups Rational
Agents?”, Experimental Economics, 9:209–222
Cooper, D. J., and Kagel, J. H. (2005), "Are Two Heads Better Than One? Team versus
Individual Play in Signaling Games," American Economic Review, American Economic
Association, vol. 95(3), pages 477-509, June.
Gul, F. (1991), “A Theory of Disappointment Aversion”, Econometrica 59, 667-686.
Harless, D.W. and Camerer, C.F. (1994), “The Predictive Utility of Generalized Expected
Utility Theories”, Econometrica 62, 1251-1289.
Hey, J.D., and Orme, C. (1994), Investigating Generalizations of Expected Utility Theory
Using Experimental Data, Econometrica 62, 1291-1326.
Hey, J.D. (2001), "Does Repetition Improve Consistency?," Experimental Economics,
Springer, vol. 4(1), pages 5-54.
Hey, J.D., Morone A. Schmidt, U. (2009), “Noise and Bias in Eliciting Preferences”, Journal
of Risk and Uncertainty, Springer, vol. 39(3), pages 213-235.
Kocher, M. G., and Sutter, M. (2005), "The Decision Maker Matters: Individual Versus
Group Behaviour in Experimental Beauty-Contest Games," Economic Journal, Royal
Economic Society, vol. 115(500), pages 200-223, 01.
Kocher, M. G., and Sutter, M. (2007), "Individual versus group behavior and the role of the
decision making procedure in gift-exchange experiments," Empirica, Springer, vol.
34(1), pages 63-88, March.Masclet, D., Colombier, N., Denant-Boemont, L., and
Lohéac, Y. (2009). "Group and individual risk preferences: A lottery-choice experiment
with self-employed and salaried workers," Journal of Economic Behavior &
Organization, Elsevier, vol. 70(3), pages 470-484.
Morone, A. (2008), “Comparison of Mean-Variance Theory and Expected-Utility Theory
through a Laboratory Experiment”, Economics Bulletin, AccessEcon, vol. 3(40), pages
1-7.
Orme, C. (1995), "On the Use of Artificial Regressions in Certain Microeconometric
Models," Econometric Theory, Cambridge University Press, vol. 11(02), pages
290-305.
Quiggin, J. (1982), “A Theory of Anticipated Utility”, Journal of Economic Behavior and
Organization, 3, 323-343.
Schmidt, U. (2004), “Alternatives to Expected Utility: Some Formal Theories”, in: P.J.
Hammond, S. Barberá, and C. Seidl (eds.), Handbook of Utility Theory Vol. II, Kluwer,
Shupp, R., and Williams A. W. (2008), “Risk preference differentials of small groups and
individuals”, Economic Journal, Royal Economic Society, vol. 118(525), pages
258-283, 01.
Starmer, C. (2000), “Developments in Non-Expected Utility Theory : The Hunt for a
Descriptive Theory of Choice under Risk”, Journal of Economic Literature 38,
332-382.
Sugden, R. (2004), “Alternatives to Expected Utility: Foundations”, in: P.J. Hammond, S.
Barberá, and C. Seidl (eds.), Handbook of Utility Theory Vol. II, Kluwer, Boston.
Sutter, M. (2005), "Are four heads better than two? An experimental beauty-contest game
with teams of different size," Economics Letters, Elsevier, vol. 88(1), pages 41-46, July.
Sutter, M. (2009), “Individual Behavior and Group Membership: Comment”, American
Economic Review, American Economic Association, vol. 99(5), pages 2247-57.
Sutter, M., Kocher, M. G., and Strauss, S. (2009), "Individuals and teams in auctions," Oxford
Economic Papers, Oxford University Press, vol. 61(2), pages 380-394, April.
von Neumann, J. and Morgenstern, O. (1944), Theory of Games and Economic Behavior,
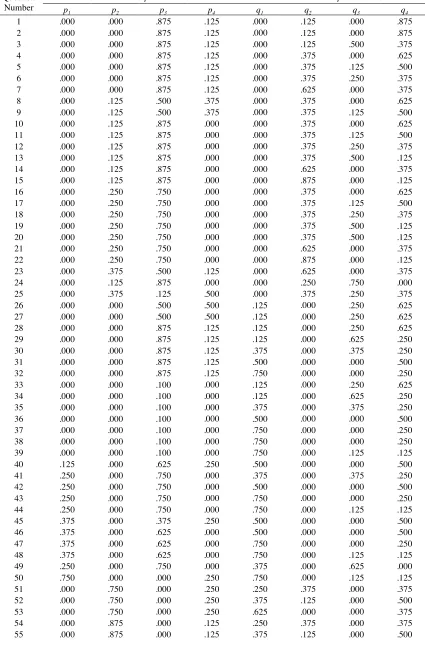
Appendix 1
Table A1: The 100 Pairwise Choice Questions
Question Number
Lottery A Lottery B
p1 p2 p3 p4 q1 q2 q3 q4
Appendix 2
Derivation of Disappoint Aversion specification.
Let start with our formulation of Disappointment Aversion Theory, as reported in the paper
DA: 𝑉∗ 𝐩,𝐪
= 𝑚𝑖𝑛 !!!!
1+𝛽 𝑝!𝑢 𝑥! + !! 𝑝!𝑢 𝑥! !!!! !!!
!!!
1+𝛽 !!!𝑝!
!!!
− 1
+𝛽 𝑞!𝑢 𝑥! + !! 𝑞!𝑢 𝑥!
!!!! !!!
!!!
1+𝛽 !!!!!𝑞!
!!!
+𝜖
if 𝑗 =0 ⇒𝑉∗ 𝐩,𝐪 = !!! !!! !! !!! !
!!! !!! ! !!
!!! −
!!! !!! !! !!
! !
!!!
!!! ! !! !!!
+𝜖
if 𝑗 =1 ⇒𝑉∗ 𝐩,𝐪 = !!!!!! !!!!!!!!! !!! ! !!
!!! −
!!!!
!! !!!!!!! !! !!! ! !!
!!!
+𝜖
If 𝑗 = 2 ⇒𝑉∗ 𝐩,𝐪 = 𝑝! 𝑢 𝑥! !
!!!
1+𝛽𝑝
!
− 𝑞!
𝑢 𝑥! !
!!!
1+𝛽𝑞 !
+𝜖
Now, taking the minimum we obtain exactly the same formulation proposed by Hey and