Munich Personal RePEc Archive
A Study on Regional Disparity of
Devolution of Rural Infrastructure
Development Fund - Evidence for India
Sen, S K and Guha, S and Chakraborty, N
Tripura University
16 November 2011
Online at
https://mpra.ub.uni-muenchen.de/39117/
- 1 -
A Study on Regional Disparity of Devolution of Rural Infrastructure
Development Fund - Evidence for India
By
S. K. Sen¥, S. Guha & N. Chakraborty
Abstract: The present paper attempts to examine the normative criteria of RIDF devolution by NABARD in reducing inter and intra state disparity in terms of sanction of per capita RIDF over the study period 1996 to 2010. Following Spiezia (2002), Adjusted Geographic Concentration index has been used to test the nature and sources of concentration of per capita sanction of RIDF. The empirical findings support a relatively high degree of concentrations in devolution of such fund among the states. The study also identifies the sources of such concentration. The underlying reasons behind such inter and intra state disparity in per capita sanction of RIDF is mainly the matching grant scheme applied to all the states and the twenty percentages reward formula under such devolution criteria. This study strongly recommended the review of the normative criteria for devolution of RIDF set by the NABARD by removing the matching grant scheme and restricting the twenty percentage reward formula, for the less developed states including the states in the north eastern region only for achieving the goal of balanced regional development of rural infrastructure.
Key Words: Rural Infrastructure, Regional Disparity, Geographic Concentration, Matching Grant Scheme, Reward Formula
JEL Classifications: G18, H53, R58.
1. Introduction:Balanced regional growth has always been a significant objective of the Indian national plans. Starting from the First Plan, to achieve the goal of balanced regional development, the Finance Commission and the Planning Commission always determines the funds devolution to state governments by assigning a significantly high weight on relative backwardness of the states. The contemporary literature on balanced vis-à-vis unbalanced growth doctrine differs significantly in this devolution formula of transfer of funds from the central government to the different state governments. The proponents of the unbalanced growth doctrine argued for selection of investment projects purely on the basis of larger total linkage effects which is the sum of backward linkage effect and forward linkage effect. The benefits arising out of such investment projects are expected to trickle down to the other sector. If it is established that national growth will lead to convergence in regional incomes then growth in richer states will trickle down to poorer states in due course of time. In that case, emphasis should be on economic growth rather than regional backwardness while distributing resources to the state governments. This policy of deliberate unbalanced growth strategy is likely to be useful for any economy which is yet to ‘take off’ or just reached the take off stage. The convergence theorem as propounded by Barro (1991) postulates that when the growth rate of an economy accelerates, initially some regions with better resources would grow faster than others. But after
¥
- 2 - sometime, when the law of diminishing marginal returns set in, first growth rates would converge, due to differential marginal productivity of capital (higher in poorer regions and lower in richer regions), and this in turn would bridge the gaps in the levels of income across regions over time. Though, the cross country empirical results are some time controversial, the reduction in the level of regional disparity in China after economic reform supports this proposition.
On the other hand, the alternate hypothesis advocated for achieving balanced regional growth and proposed in favour of sacrificing some growth if divergence in regional incomes has stronger ground. Needless to mention that in India, different regions with different resource bases and endowments level would have a dissimilar growth path over time. One of the reasons why centralized planning was advocated earlier on the expectation that it could restrain the regional disparity. In spite of planning, however, the regional disparity remained a serious problem in India. In India, the growth rate of gross domestic product (GDP) accelerated since 1980s. The average annual GDP growth rate in the first three decades (1950s to 1980s) was only 3.6 percentages. During the 1980s, the GDP growth rate accelerated to 5.6 percent, and after economic reforms in the 1990s, it has further accelerated to 6.0 percentages or even expected up to 8.5 percentages. The pattern of sectoral composition of GDP growth in India is predominantly service led growth coupled with a declining trend in its contribution from the primary sector which becomes a serious concern among the development planner and policy makers.
During the Budget speech of 1995-96, the then finance minister of Government of India expressed the consciousness over the declining trend in public investment in agriculture and rural infrastructure mainly due to severe resource crunch experienced by the different state governments on the one hand and the inability of the Commercial Banks to channelize 18 percentages of their total lending to agriculture as required under priority sector guidelines due to inadequate infrastructural base in rural and agricultural sector. Against this backdrop, the Government of India announced a scheme for setting up of Rural Infrastructure Development Fund (RIDF) with NABARD as the nodal agency towards financing of, at that point of time, the ongoing rural infrastructure projects in irrigation sector. Subsequently, RIDF was made available for new projects as well and its ambit was broadened to cover almost all important aspects of rural infrastructure.
During the launch of RIDF schemes by NABARD, the devolution of state wise allocation of this fund was decided to be made available in accordance with the normative criteria which include geographical area, population, inverse of infrastructure index, inverse of rural CD ratio and the previous performance under RIDF sanctions and disbursements. Clearly, this was a move towards performance based programme budgeting system to achieve the twin goal of generating infrastructural base for rural economy and reducing the intra and inter rural disparity among the different states and or region of India.
Against this backdrop, the objective of this paper is to investigate the nature of disparity of per capita availability of such RIDF sanction across the different states and evaluate its actual performance against the expected standard. For this, we consider the Adjusted Geographic concentration (AGC) index over the period of study and analyse the trend of disparity of per capita devolution to understand the nature and extent of such spatial concentration of sanction of per capita RIDF for the different states.
To pursue the aforesaid objective, the present paper has been divided into five sections. Including the present Introductory one, the remaining paper is organized as follows: Section 2
- 3 - in devolution of per capita RIDF fund across the states. Results are discussed in Section 4. Finally, this paper concludes in Section 5.
2. Related Studies: Since the balanced regional growth is one of the principal objectives of the developing world, the major precondition for attaining such goal, however, is the availability and flow of required quantum of infrastructure in the economy. Since, the deficiency of infrastructure will definitely slow down the growth process. In most of the developing countries including India, the status of actual availability of infrastructure, particularly the in rural sector, is quite low against its actual requirement by the respective countries. The demand for infrastructure is growing at a much faster rate for the last three decades where as the supply is more or less stagnant mostly due to structural reasons. The rapid pace of urbanization and globalization across the world further aggravates the demand supply gap of infrastructure day by day. Lewis (1955) pointed out that the development of infrastructure in rural sector is anticipated to stimulate economic growth, create jobs, diversify economy and improve the quality of life in the country In a nutshell, it has long been assumed that the balanced government investment paved the way for further investment from the private sectors. But, it is a fact that the nature of investment in the infrastructural sector never attained any significant attention from the private investors in a large scale. Even the classical economists, who identified the private sector as the ‘main’ engine of growth of an economy through efficient utilization of resources of any country or region also admitted this particular fact and advocated for larger state intervention. They also believed that the state should take utmost care to provide the required infrastructural facility for proper functioning of the private sector. This particular aspect of market failure in infrastructural sector was raised by Hirschman (1958). Since, infrastructural base is necessary and may not be sufficient for the proper functioning of private sector organisations.
In a country like India, where the major proportions of the population lives in rural areas, the rural infrastructure is crucial for overall economic development of the country as a whole and development of the rural areas, in particular. As mentioned earlier, the infrastructure projects, particularly in the rural sector, involve huge initial investments, long gestation periods, high incremental capital output ratio, high risk and a very low rate of returns on investment. This simply creates a barrier for inducement to invest into infrastructure by the private player. Investment in infrastructure in rural sector is necessary for increasing the productivity and efficiency of agriculture in the form of improving the credit absorbing capacity, enhancing the productivity of crops and livestock, generating employment and increasing farmers’ income etc. which ultimately directly reduce the incidence of rural poverty (Rostow: 1960)
However, the micro aspect of need for rural infrastructure was first raised by Wharton (1967) who classified the agricultural infrastructure into three distinct categories. It may be of capital intensive type or of capital extensive type or transport related infrastructure. He further pointed out that these infrastructures will generate positive externalities at the micro level since infrastructural base in the rural sector will pave the way for inducement to investment potential in rural sector by the local producers. Following the same line, the World Development Report of 1994 (World Bank, 1994) broadly defined the term infrastructure as following:
(i) Public utilities-power, telecommunications, piped water supply, sanitation and sewerage, solid waste collection and disposal and piped gas.
- 4 - (iii)Other transport sectors-urban and inter-urban railways, urban transport, ports and
waterways, and airports.
2.1 Infrastructure for Rural Economy: The models of development which focuses on agriculture also bring about the role that infrastructure play in agricultural development in particular. The spread of technology in agriculture depends critically on both physical and institutional infrastructure. Rural infrastructure leads to agricultural expansion by increasing yields, farmers’ access to markets and availability of institutional finance. World Bank (1994) identified that rural infrastructure plays a key role in reaching the large mass of rural poor. When rural infrastructure has deteriorated or is nonexistent, the cost of marketing farm produce will be prohibitive for poor farmers. Poor rural infrastructure also limits the ability of traders to travel to and communicate with remote farming areas, limiting market access from these areas and eliminating competition for their produce. Construction of rural roads almost inevitably leads to increase in agricultural production and productivity by bringing in new land into cultivation or by intensifying existing land use to take advantage of expanded market opportunities. Later, World Bank (1997) estimated that 15 percentages of crop produce is lost between the farm gate and the consumer due to inefficient and inappropriate storage facilities, thereby adversely influencing the income of farmers. Previously, Mellor (1976) pointed out that strengthening rural infrastructure can help to lower production costs which can further augment agricultural output and income for rural farmers. It is also indicated that infrastructure plays a strategic role in generating multiplier effects in the economy with agricultural growth. Since, the kind of infrastructure put in place also determines whether growth does all that it can to reduce poverty. Most of the poor are in rural areas, and the growth of farm productivity and non-farm rural employment is linked interdependently to infrastructural provision. In the same line, Ahmed (1996) observed that development of transport and communication infrastructure enhances the mobility of people and information through reduction in cost and time. The resulting increase in interaction contributes to changes in attitudes and human capital development.
- 5 - From this brief survey of literature, it is clear that the importance of infrastructure in agriculture and rural development is well documented. However, the existing literature is mainly concentrates on the effect of rural infrastructure in reducing poverty and change in TFP. But in a federal structural like India, how far the nature of devolution of rural infrastructure fund attributes towards balanced regional development has not yet been tested considering capita sanction of such funds across the states. In this sense, this paper shall attempt to fill that caveat in the existing literature.
3. Data & Methodology
3.1 Data: In order to investigate the regional disparity of sanction of RIDF in India, secondary data regarding state wise disbursement figure as on March 31, 2010 have been collected. For this, state wise disbursement of RIDF in different tranches (I to XV) has been compiled for all the states except the data for the Union Territories. For ambiguity in using interpolations and extrapolations methods to calculate year wise rural population in three newly constituted states, their data are combined with their mother states from where they were bifurcated (the data for Jharkhand, Uttaranchal and Chhattisgarh are combined with the data for Bihar, Uttar Pradesh and Madhya Pradesh, respectively). The year wise rural populations figure are extrapolated from the Census of 1991, 2001 and 2011. The data regarding state wise disbursement of RIDF are prepared on the basis of various reports of NABARD where as area share of the states are approximated from the various reports published by the Registrar General of India, Government of India, New Delhi. Due to non availability of data on rural area of any state for the study period, we use actual area figure off all the states accepting the downward bias in aggregation. The present study consider the period 1995-96 to 2009-10 as per the annual reports of the NABARD are concerned where as the actual rural population for that period is approximated by the year end figure for the respective states.
3.2 Methodology: The study has utilised the Adjusted Geographic Concentration index (AGC) proposed by Spiezia, (2002) to through light on the RIDF disbursement procedures of NABARD. The per capita disbursement of RIDF in different states in each period with their corresponding ranges at all India levels as well are also considered for participating states in different years.
We start with the common measure of concentration is the Herfindahl index (H), may be defined as:
Equation (1)
where yi is the RIDF disbursement share for State i and N stands for the number of States. The index lies between 1/N (all states have the same disbursement of RIDF share, i.e. there is no concentration) and 1 (all sanction of RIDF is concentrated in one state, i.e. maximum concentration). In general, however, states have different areas so that a correct measure of geographic concentration has to compare the sanction of RIDF share of each state with its share in the national territory.
N
i
i
y H
- 6 -
3.2.1 The Adjusted Geographic Concentration (AGC) index: In order to cope up with this type of regional differences, Ellison and Glaeser (1997) proposed:
Equation (2)
where ai is the area of state i as a percentage of the country area. If the disbursement of RIDF share of each state equals its relative area, then there is no concentration (EG equals 0) and larger value of EG indicates higher geographic concentration. However, the major drawback of the EG index is that it is very sensitive to the level of aggregation of regional data. This feature is due to the fact that the differences between the disbursement of RIDF share and relative area of each state are squared.
To correct this bias related to aggregation, Spiezia (2002) reformulated the EG index further to correct this bias due to aggregation into the following index of Geographic Concentration (GC):
Equation (3)
where ││ indicates the absolute value. Obviously, the aggregation bias would be smaller for the GC index than for the EG index.
The maximum value of the GC index is the equal to:
Equation (4)
where amin denotes the relative area of the smallest state under study.
The GC index, therefore, is not regionally comparable if the size of regions (states) differs systematically within the country. A natural correction for this second aggregation bias is provided by the adjusted geographic concentration index (AGC), which may be defined as
MAX GC GC
AGC / ; AGC € [0,1] Equation (5)
3.2.2 Decomposition of the AGC index: The AGC index can further be decomposed into two
components: geographic concentration of population and territorial disparity. In the case of per capita sanction of RIDF across the states can be considered as:
Equation (6)
where pi is the population share of state i.
Therefore, the AGC index for per capita sanction of RIDF across the states can be rewritten as
Equation (7)
N i i i a y EG 1 2 ) (
N i i i a y GC 1
min
min min min 1 2 2 1 1
1 a a a
a GC
i i
MAX
i i
i i
i
i a y p p a
y
N i N i i i i i i i i i i i ii y a
- 7 - The first term on the right-hand measures the effect of territorial disparity in sanction of RIDF per capita and the second term the effect of geographic concentration of population. Obviously, the AGC index lies between 0, indicating no concentration and 1, implying maximum concentration for all states.
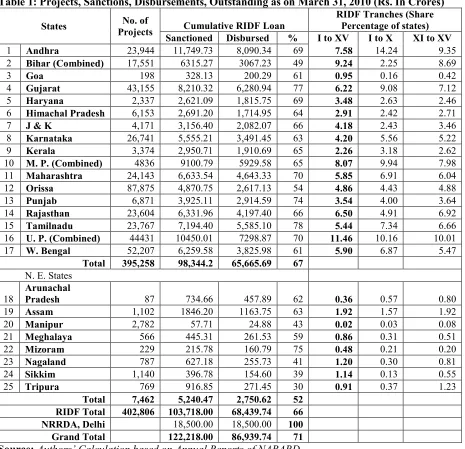
[image:8.612.74.539.197.646.2]4. Results and Discussions: The empirical results are summarised in Table 1. For analytical purpose, we divide the states in two broad categories viz. Major states and the states in the north eastern region.
Table 1: Projects, Sanctions, Disbursements, Outstanding as on March 31, 2010 (Rs. In Crores)
States No. of
Projects Cumulative RIDF Loan
RIDF Tranches (Share Percentage of states) Sanctioned Disbursed % I to XV I to X XI to XV
1 Andhra 23,944 11,749.73 8,090.34 69 7.58 14.24 9.35 2 Bihar (Combined) 17,551 6315.27 3067.23 49 9.24 2.25 8.69 3 Goa 198 328.13 200.29 61 0.95 0.16 0.42 4 Gujarat 43,155 8,210.32 6,280.94 77 6.22 9.08 7.12 5 Haryana 2,337 2,621.09 1,815.75 69 3.48 2.63 2.46 6 Himachal Pradesh 6,153 2,691.20 1,714.95 64 2.91 2.42 2.71 7 J & K 4,171 3,156.40 2,082.07 66 4.18 2.43 3.46 8 Karnataka 26,741 5,555.21 3,491.45 63 4.20 5.56 5.22
9 Kerala 3,374 2,950.71 1,910.69 65 2.26 3.18 2.62
10 M. P. (Combined) 4836 9100.79 5929.58 65 8.07 9.94 7.98 11 Maharashtra 24,143 6,633.54 4,643.33 70 5.85 6.91 6.04 12 Orissa 87,875 4,870.75 2,617.13 54 4.86 4.43 4.88
13 Punjab 6,871 3,925.11 2,914.59 74 3.54 4.00 3.64
14 Rajasthan 23,604 6,331.96 4,197.40 66 6.50 4.91 6.92 15 Tamilnadu 23,767 7,194.40 5,585.10 78 5.44 7.34 6.66 16 U. P. (Combined) 44431 10450.01 7298.87 70 11.46 10.16 10.01 17 W. Bengal 52,207 6,259.58 3,825.98 61 5.90 6.87 5.47
Total 395,258 98,344.2 65,665.69 67
N. E. States
18
Arunachal
Pradesh 87 734.66 457.89 62 0.36 0.57 0.80
19 Assam 1,102 1846.20 1163.75 63 1.92 1.57 1.92
20 Manipur 2,782 57.71 24.88 43 0.02 0.03 0.08
21 Meghalaya 566 445.31 261.53 59 0.86 0.31 0.51
22 Mizoram 229 215.78 160.79 75 0.48 0.21 0.20
23 Nagaland 787 627.18 255.73 41 1.20 0.30 0.81
24 Sikkim 1,140 396.78 154.60 39 1.14 0.13 0.55
25 Tripura 769 916.85 271.45 30 0.91 0.37 1.23
Total 7,462 5,240.47 2,750.62 52 RIDF Total 402,806 103,718.00 68,439.74 66 NRRDA, Delhi 18,500.00 18,500.00 100 Grand Total 122,218.00 86,939.74 71
Source:Authors’ Calculation based on Annual Reports of NABARD
Note:
1. 'Tranche': RIDF loans sanctioned during a financial year are covered under that tranche.
2. 'Disbursement': After the sanction, disbursements take place during the following 4-5 years, as per progress of the implementation of projects.
- 8 - The above table clearly shows that as on March 31, 2010 the states in the north eastern region jointly receive only 7462 number of projects which is only 1.853 percentages of the total projects under RIDF scheme over the study period. Again, actual disbursement figure against the sanctioned amount for different project shows that it is 52 percentages for the states in the north eastern region but the averages for the major state is near about 67 percentages. This figure goes up to a maximum of 77 percentages for Gujarat and the minimum figure is only 30 percentages with Tripura. The planner also realised this fact. It is evident from the fact that the disbursement pattern of RIDF tranches in terms of share percentages of different states revealed that during the first ten Tranches of RIDF, the share of the states in the north eastern region received only 3.50 percentages but it reached the level of 6.11 percentages during the next five RIDF tranches. This clearly implies that the level of regional convergence of disbursement of RIDF in different tranches hardly realised the objective of balanced regional disbursement of such fund, at least at the state level. Moreover, the pattern of disbursement of such fund also revealed that among the major states, Bihar (Combined) is lagging from the other major states with a significantly low percentage of disbursement of RIDF. Perhaps, due to the criteria of matching grant scheme of RIDF. The same argument is applicable to the north eastern states, too. This matching grant scheme renders the deficit pronged states to apply for such schemes avoiding the actual need of their respective backwardness in rural infrastructure on the one hand and it also gives an opportunity to the relatively larger states with greater financial strength to increase their share in RIDF schemes in the current tranches on the basis of their performance in earlier tranches. Ultimately, it creates a double liability for the planner as it simply widens the gap between the relatively richer states with the states suffering from huge infrastructural backlog, particularly in their rural sector.
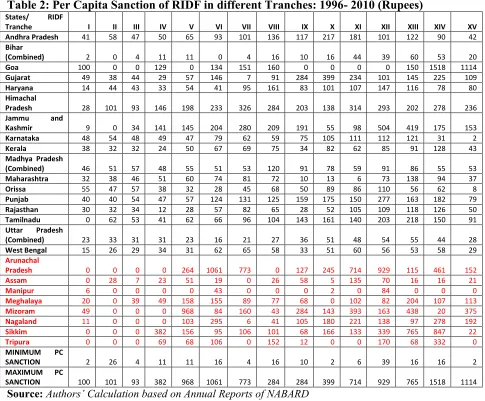
Further, the per capita sanction of RIDF for the different states over the study period is also not satisfactory. The minimum per capita RIDF actually sanctioned ranges from Rupees 2.00 in 1996, 2005 and 2010 for Bihar (Combined), Manipur and Karnataka, respectively. The maximum per capita sanction of RIDF for the same period is Rupees100.00, Rupees 399.00 and Rupees 1114.00 for Goa, Gujarat and again Goa, respectively. The same macro trend of regional concentration of sanction of state level RIDF, discussed above is maintained in per capita sanction of RIDF for the states, too. The minimum figure for Karnataka in 2010 is little bit surprising when the state is continuously receiving a good average of such fund. It is perhaps due to some administrative reason that it has not applied for the fund in a mass scale following previous trend.
Among the states in the north eastern region, performance of the per capita sanction of RIDF is not satisfactory, again. Manipur has been sanctioned RIDF only four time. Tripura has not participated in RIDF scheme for seven years. Starting from the fifth tranche of RIDF, Arunachal Pradesh continuously is getting relatively higher per capita sanction of RIDF. Arunachal Pradesh receives the four digit per capita sanction of RIDF in sixth tranches which is highest per capita sanction of RIDF for the states in the north eastern region till the end of fifteenth tranche of RIDF introduced by the NABARD.
These are summarised in Table 2 (See Appendix-A)
- 9 - under RIDF scheme by the NABARD emphasized more on the relative size of the rural population than that of the area figure of any state. For the remaining tranches, we observe just the opposite result. The effect of territorial disparity on per capita sanction of RIDF as a source of concentration reaches its maximum in sixth tranche and reaches its minimum in twelfth tranche with values 54 percentages and only one percentage, respectively. The relative contribution of the effect of geographic concentration of rural population on per capita sanction of RIDF as a source of concentration has the same minimum value of one percentage in eighth tranche where as it reaches its maximum of 47 percentages in eleventh tranche.
Table 3: Decomposition of AGC Index of Per Capita Sanction of RIDF during the Study Period 1996-2010
Sources of Concentration
RIDF Tranches
Effect of Territorial Disparity on PC Sanction
of RIDF
Effect of Geographic Concentration of Rural
Population on PC Sanction of RIDF
AGC Index
I 0.31 0.26 0.57
II 0.21 0.37 0.58
II 0.19 0.32 0.51
IV 0.20 0.31 0.51
V 0.15 0.33 0.48
VI 0.54 0.04 0.58
VII 0.43 0.14 0.57
VIII 0.47 0.01 0.48
IX 0.31 0.34 0.65
X 0.46 0.31 0.77 XI 0.11 0.47 0.58
XII 0.14 0.39 0.53
XII 0.01 0.39 0.40
XIV 0.07 0.45 0.52
XV 0.10 0.45 0.55
Source:Authors’ Calculation based on various Annual Reports of NABARD
- 10 -
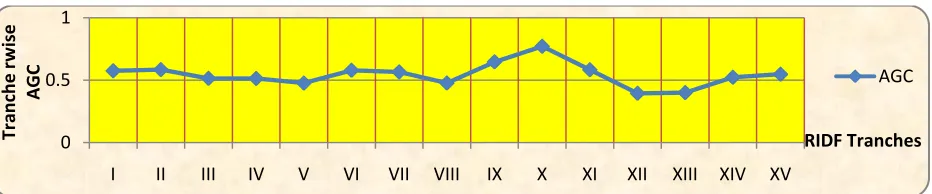
Figure 1: Trend of AGC over the different RIDF Tranches
Source:Authors’ Calculation based on various Annual Reports of NABARD
The tendency of AGC index towards a larger value clearly indicates that the sanction and disbursement of per capita RIDF among the states raises some question about the objective of balanced regional development of rural infrastructure across the country so far as its normative devolution criteria is concerned. When the national planners at all levels are trying to emphasize a more balanced regional development, the present criteria of sanction of RIDF across the states is mainly boosting the relatively developed states to utilise the fund in desired direction at the cost of the relatively financially deficit pronged states or the special category states like the states in the north eastern region. The matching grant scheme for participating in this scheme further render the relatively deficit pronged states to apply for fund according to their actual requirement. Consequently, the excess fund that could have been utilised by these states ultimately goes to the major states on the basis of the 20 percentages reward formula as prescribed by NABARD.
5. Conclusions: The present paper reveals that the criteria of fund devolution of RIDF Schemes as prescribed by NABARD should undergo a massive change towards reducing the wide spread disparity of sanction of per capita RIDF which can promote inter and intra rural disparity among the states. Firstly, the matching grant scheme may be withdrawn, particularly for all those states which are predominantly backward. Secondly, the 20 percentages reward formula of RIDF disbursement should be extended only to the identified backward states and not to the others in order to maintain a progressive structure of the fund devaluation among the different states. Thirdly, the RIDF Schemes should be tagged with other central and state initiatives of integrated rural development programme; and last but not the least, the initiatives taken by the central government and the respective state governments should be complementary in nature and not the substitutes for effective use of this fund towards reducing inter and intra state disparity in rural infrastructure.
References:
[1] Barro, R. J. (1991). Economic Growth in a Cross section of Countries. The Quarterly Journal of
Economics, 106 (2), 407-443.
[2] Binswanger, H. P., Khandker, S. R., & Rosenzweig, M. R. (1993). How Infrastructure and Financial Institutions Affect Agricultural Output and Investment in India. Journal Of
Development Economics, 41, 337-366.
0 0.5 1
I II III IV V VI VII VIII IX X XI XII XIII XIV XV
Tr
an
ch
e
r
wi
se
A
GC
- 11 - [3] Ellison, G., and E. L. Glaeser. (1997). Geographic concentration in U.S. manufacturing
industries: A dartboard approach. Journal of Political Economy, 105, 889-927.
[4] Fan, S., Hazell, P., & Haque, T. (2000). Targeting public investments by agro-ecological zone to achieve growth and poverty alleviation goals in rural India. Food Policy, 25 (4), 411-428.
[5] Fan, S., Hazell, P., & Thorat, S. (2000). Government spending, growth and poverty in rural India.
American Journal of Agricultural Economics, 82 (4), 1038-1051.
[6] Government of India. (1995). Budget Speech of the Union Finance Minister. Ministry of Finance. New Delhi: Government of India.
[7] Hirschman, A. O. (1958). The Strategy of Economic Development. New Haven, CT: Yale University Press.
[8] Jha, R. (2002). Rural Poverty in India: Structure, determinants and suggestions for policy reform.
Australia South Asia Research Centre: ASARC Working Papers 2002-07, Australian National University.
[9] Krugman, P. (1991). Geography and Trade. Cambridge, MA: The MIT Press. [10] Lewis, A. W. (1955). The Theory of Economic Growth. London: Allen Unwin.
[11] Mellor, J. W. (1976). The New Economics of Growth: A Strategy for India and the Developing
World. Ithaca, New York: Cornell University Press.
[12] NABARD. (2009). Annual Reports. Mumbai: National Bank for Agriculture and Rural Development.
[13] NABARD. (2010). Infrastructure for Agriculture and Rural Development-An Impact Assessment
of Investments in Rural Roads and Bridges under RIDF. Mumbai: National Bank for Agriculture
and Rural Development.
[14] Planning Commission. (2007). Eleventh Five Year Plan. New Delhi: Government of India. [15] Rajeev, M. (2008). A Critical Analysis of RIDF. Economic and Political Weekly , XLIII (7),
27-31.
[16] Spiezia, V. (2002). Geographic Concentration of Production and Unemployment in OECD countries. International Statistical Institute Journal, December 2002.
[17] Wharton, C. (1967). The Infraestructure for Agricultural Growth. New York: Southworth and Johnston.
[18] World Bank. (1994). World Development Report: Infrastructure for Development. New York: Oxford University Press.
[19] World Bank. (1997). World Development Report: Rural Development: Vision to Action: A Sector
Strategy. Washington DC: Oxford University Press.
- 12 -
[image:13.612.65.550.102.503.2]APPENDIX-A
Table 2: Per Capita Sanction of RIDF in different Tranches: 1996- 2010 (Rupees)
States/ RIDF
Tranche I II III IV V VI VII VIII IX X XI XII XIII XIV XV Andhra Pradesh 41 58 47 50 65 93 101 136 117 217 181 101 122 90 42
Bihar
(Combined) 2 0 4 11 11 0 4 16 10 16 44 39 60 53 20
Goa 100 0 0 129 0 134 151 160 0 0 0 0 150 1518 1114
Gujarat 49 38 44 29 57 146 7 91 284 399 234 101 145 225 109
Haryana 14 44 43 33 54 41 95 161 83 101 107 147 116 78 80
Himachal
Pradesh 28 101 93 146 198 233 326 284 203 138 314 293 202 278 236
Jammu and
Kashmir 9 0 34 141 145 204 280 209 191 55 98 504 419 175 153
Karnataka 48 54 48 49 47 79 62 59 75 105 111 112 121 31 2
Kerala 38 32 32 24 50 67 69 75 34 82 62 85 91 128 43
Madhya Pradesh
(Combined) 46 51 57 48 55 51 53 120 91 78 59 91 86 55 53
Maharashtra 32 38 46 51 60 74 81 72 10 13 6 73 138 94 37
Orissa 55 47 57 38 32 28 45 68 50 89 86 110 56 62 8
Punjab 40 40 54 47 57 124 131 125 159 175 150 277 163 182 79
Rajasthan 30 32 34 12 28 57 82 65 28 52 105 109 118 126 50
Tamilnadu 0 62 53 41 62 66 96 104 143 161 140 203 218 150 91
Uttar Pradesh
(Combined) 23 33 31 31 23 16 21 27 36 51 48 54 55 44 28
West Bengal 15 26 29 34 31 62 65 58 33 51 60 56 53 58 29
Arunachal
Pradesh 0 0 0 0 264 1061 773 0 127 245 714 929 115 461 152
Assam 0 28 7 23 51 19 0 26 58 5 135 70 16 16 21
Manipur 6 0 0 0 0 43 0 0 0 2 0 84 0 0 0
Meghalaya 20 0 39 49 158 155 89 77 68 0 102 82 204 107 113
Mizoram 49 0 0 0 968 84 160 43 284 143 393 163 438 20 375
Nagaland 11 0 0 0 103 295 6 41 105 180 221 138 97 278 192
Sikkim 0 0 0 382 156 95 106 101 68 166 133 339 765 847 22
Tripura 0 0 0 69 68 106 0 152 12 0 0 170 68 332 0
MINIMUM PC
SANCTION 2 26 4 11 11 16 4 16 10 2 6 39 16 16 2
MAXIMUM PC
SANCTION 100 101 93 382 968 1061 773 284 284 399 714 929 765 1518 1114
Source:Authors’ Calculation based on Annual Reports of NABARD