Munich Personal RePEc Archive
curb your premium! evaluating state
intervention in medical malpractice
insurance
Sofia, AmaralGarcia and Veronica, Grembi
ETH Zürich, Catholic University of Milan
July 2012
Online at
https://mpra.ub.uni-muenchen.de/40718/
Curb Your Premium:
The Impact of Monitoring Malpractice Claims
∗Sofia Amaral-Garcia
ETH Zurich
Veronica Grembi
Catholic University of Milan
This version: August 2012.
Abstract
We study a policy aimed at reducing the insurance costs paid by local public healthcare providers. The policy is based on enhanced monitoring of medical malpractice claims by the regional gov-ernment that rules local providers. In particular, we implement a Difference-in-Differences strategy using Italian data at the provider level from 2001 to 2008 to evaluate the impact of monitoring on medical liability expenditures, measured as insurance premiums and legal ex-penditures. Our results show that this information-enhancing policy reduces paid premiums. This reduced-form effect might arise by both the higher bargaining power of the demand side or by increased competition on the supply side of the insurance market. Empirical evidence on the post-treatment period supports the competition-channel hypothesis, as the policy reduces the Herfindahl-Hirschman index at the insurance company level by about 30%. Validity tests show that our findings are not driven by differential pre-policy trends between treated and control providers.
JEL codes: I18, G22, K32.
Keywords: Medical Malpractice Premium, Legal Expenditures, Public Healthcare System, Difference in Differences.
∗We are grateful to Eugenio Anessi Pessina, Daniele Fabbri, Rosa Ferrer, Nuno Garoupa, Gianandrea Majone, Tommaso Nannicini,
1
Introduction
The last decades’ skyrocketing increase of medical liability insurance premiums has moved several
Governments to deal with the policy challenge related to medical malpractice expenditures. The
majority of the adopted policies is mainly targeted to lower malpractice premiums and to reduce
physicians’ or hospitals’ potentially distorted behaviors in medical practice triggered by the threat
of being sued (i.e., negative or positive defensive medicine, (Danzon (2000))). Plenty of works have analyzed the impact of liability reforms on paid premiums in the U.S., a mainly private healthcare
system.1
We evaluate a policy aimed at curbing medical malpractice expenditures, defined both in terms
of paid premiums and of legal expenditures, in a public healthcare system. In particular, we
imple-ment a Difference-in-Differences (DD) strategy using Italian data at the public provider level from
2001 to 2008 to assess the impact of a State-level (Regions) monitoring on medical malpractice
claims. In this setting, public healthcare providers typically pay a private insurance.2
The monitoring policy - hereafterClaims- implements a regional monitoring system that col-lects data on both the number of compensation claims and any legal action related to medical
mal-practice litigation. This monitoring system allows Regions to collect information on civil and
crim-inal claims against public healthcare providers operating in their jurisdictions. The information is
collected from the stage of filing a suit until the end of the process, which can be a settlement, a
trial, or a drop of the claim. In order to collect such information, Regions set special grids with
a list of fields that need to be filled out by their providers. Each provider has access to the
com-mon dataset and can com-monitor its own data, whereas checking the performance of another healthcare
provider belonging to the same system is not allowed. Only the regional administration can access
the entire database. These data are not generally released to the public although in a few cases
Regions publish reports, which can be either public or classified. Classified reports are prepared for
meetings with the insurance companies or for purposes internal to the regional administration (such
as for policy planning with the involved structures). Regions can use the collected data to recall the
structures outliers in terms of claims and expenditures for malpractice. Overall, Claimsdoes not
1
Exploiting the variety in interventions across U.S. States, several studies estimate the impact of legal reforms on
malpractice premiums, malpractice claims frequency, award payments, or defensive medicine, to name the main outcomes
of interest. See, among others, Sloan (1985); Williams and Mello (2006); Mello and Kachalia (2010); Danzon et al.
(2004); Thorpe (2004); Kilgore et al. (2006); Viscusi and Born (2005). For a review of this literature see, for instance,
Mello (2006b) and Kessler (2011). For the assessment of the link between malpractice pressure and treatment decisions,
with specific reference to the costs of defensive medicine, see Kessler and McClellan (1996) and Kessler and McClellan
(2002), but also Sloan and Shadle (2009). See Avraham (2011) for an updated list of tort reforms related to medical
malpractice in U.S. States. 2
Regions are an administrative level equivalent to States. For a matter of simplicity, in this paper we useRegionsand
represent a pure risk management system, since it does not monitor errors or near misses, but only
claims (which do not always turn out to be based on iatrogenic injuries).
The policy adopted by the Italian Regions is consistent with the fact that, in public systems,
the problems related to medical malpractice increasing costs are compounded with those connected
to the public management of the healthcare services. In particular, there is an interplay of multiple
agency problems when medical malpractice liability insurance is acquired by a public agent from the
private market. The public agency in charge of the bargaining with the private insurance company
is one layer of government (generally the provider of the healthcare services), which might not
have adequate incentives to fully internalize the bargaining and contract costs. Hence, it could lack
incentives to acquire information on its own risks exposure, both in terms of claims’ frequency
and awarded compensations, or it may fail to implement serious programs of risk management,
among other things. The reason is simply that another layer of government (typically a higher level)
will pay the final bill, as an insurer of last resort. This moral hazard behavior is defined in public
economics as a problem of soft budget constraint.
The insurer of last resort might try to cope with this framework by increasing the available
infor-mation on medical malpractice cases involving its healthcare providers. This approach, which could
be linked to a process of budget hardening, should work as an incentive on the basis of a
I-know-that-you-know-that-I-know-that-you-knowgame between the State and the healthcare providers on the one hand, and the State and private insurers on the other hand. Its rationale lays in making
both the State and its counterparts more informed, which could lead, for instance, to more efficient
contracts and policies. This is particularly important when liability insurance contracts need to
fol-low the procedure of public procurement auctions, as often the case when the public sector buys
services on the private market. Within a system where each public provider can contract out its risk
to the private sector, an increase in available information on malpractice could, for instance, have
a positive impact on the public procurement procedure by reducing the contractual power of the
incumbent insurer.
The policy adopted by Italian Regions is just an example out of the set of adoptable measures to
cope with malpractice premiums in public systems. Yet, the special feature of the Italian case,
be-sides the within-country variation, is that, differently from other public systems, a higher control of
the State over medical liability issues did not come together with a shift in the malpractice liability
system. For instance, starting in the Nineties, the UK opted for a model in which a kind of
pub-lic insurance scheme with the National Health Service Litigation Authority (NHSLA), that pools
malpractice risks through the Clinical Negligence Scheme for Trusts (CNST), has been associated
to an enterprise fault liability system (Fenn et al. (2010)).3 Also under such a different scheme the importance of monitoring the providers, acquiring information from them, and setting appropriate
incentives to them in order to reduce their risk exposure have been among the main policy priorities
(Towse and Danzon (1999); Fenn et al. (2004) ).
All in all, the monitoring policy might be a good tool to curb medical malpractice
expendi-tures through two channels. First, the monitored healthcare providers might be able to define more
competitive public auctions and might increase their contracting power by using the collected
infor-mation. There is some evidence that insurance companies in Italy tend to make an overvaluation of
medical accidents, which leads them to set aside higher amounts of reserves than they need (Taroni
et al. (2008)).4 If healthcare providers become aware of their real risk exposure, that information can be used in case insurance companies try to inflate insurance premiums in order to set a high
level of reserves. We can try to assess indirectly the value of this first channel evaluating the impact
of the policy on the amount of paid premiums.5 The richness of our data allows us to shed more light on these channels. We have information for a set of auctions of medical malpractice
insur-ance contracts from 2008 to 2011, through which we recovered data on the use of open calls and
on a Herfindahl-Hirschman index of the reference market. Unfortunately, these insurance market
data are only available in the post-treatment period that is why we cannot investigate the channels
of the policy by means of our baseline DD strategy. However, we can compare treated vs control
units in the post-treatment period in order to evaluate whether enhanced monitoring and information
also lead to lower market concentration. Second, although the purpose of monitoring is not to detect
medical errors, it can provide incentives for healthcare providers to present higher standards of care.
To a certain extent, better healthcare structures should receive less medical claims. Nevertheless,
this might be a weak argument in case higher standard practitioners are more targeted by claims
for the very reason they perform a higher number of treatments or are presented more serious and
complicated cases. An indirect way to control for this second channel is to evaluate the impact
of the monitoring system on legal expenditures, which provides an approximation for requests of
compensation.
Our main results from the DD estimators show that the monitoring policy has a robust impact
on paid premiums. As for legal expenditures, the impact is lower and not robust for different
spec-ifications. Providers operating in Regions adopting a monitoring policy on malpractice claims paid
overall around 20% less than providers operating in Regions that did not adopt such a policy. The
4
As described by Baker (2005b), "the insurer must set "reserves" which are equal to the amount needed to pay future
claims under any policies it sells and then must set aside assets to offset those reserves". While analyzing the case
of Texas, Black et al. (2008) found that medical malpractice insurers made an undervaluation of their initial expense
reserves, even though costs were rising during the analyzed period.
5It would be interesting to assess the policy impact also on the type of services delivered or on health consequences for
the resident population in terms of risk exposure (e.g., Fenn et al. (2012) look at patients’ exposure to hospital-acquired
infections). Unfortunately data at the provider level for the entire period considered are not publicly available at the
range of the savings is estimated below 15% when only Local Healthcare Units are considered. The
drop in legal expenditures associated to monitoring is generally not statistically significant. The
findings are robust for the introduction of covariates which could potentially explain the different
trends in both premiums and legal expenditures among healthcare structures and Regions. Results
are also robust for placebo test for the plausibility of the (untestable) DD assumption of a
com-mon trend between the treated and the control groups, and for robustness checks run on subsets of
structures. Descriptive cross-section post-treatment evidence relate the estimated impact of
acquir-ing more information by the providers to a decrease in the concentration in the regional market for
malpractice insurance and to a higher use of open procedure when contracting out the coverage.
The paper proceeds as follows. Section 2 lays out the institutional framework and Section 3 our
econometric strategy. Section 4 describes our dataset. Section 5 discusses the empirical results and
Section 6 concludes.
2
Institutional Framework
2.1 The Italian Healthcare System
The Italian National Health System (NHS) provides universal coverage to citizens.6 The current organization and management of the Italian NHS is carried out at three levels: at the central level,
by the national State; at the regional level, by each Region; within each Region, by
population-based local health units (LHUs) (Aziende Sanitarie Locali), "independent" hospitals (IHs) (Aziende Ospedaliere), research hospitals (RHs) (Istituti di Ricovero e Cura a Carattere Scientifico) and, in
cases where a medical school is present, by teaching hospitals (THs) (Policlinici Universitariand
Aziende Ospedaliere Universitarie) (France and Taroni (2005); Fiorentini et al. (2008); Lo Scalzo
et al. (2009)).
The 19 regional governments and the 2 autonomous provinces (Provincia Autonoma di Trento
andProvincia Autonoma di Bolzano) are in charge of the healthcare budget and its management,
relying on their own revenues and transfers from the national government. Regions are
account-able for ensuring, among other things, the delivery of healthcare, the allocation of resources to the
healthcare providers, and the release of licenses to public and private healthcare providers within
their system (CERGAS, 2010). Besides this, they are free to regulate and finance healthcare services
in addition to the required minimum (national) standards of healthcare (LEA) (Livelli Essenziali di
Assistenza), set by the Central state and for which they receive financial support through a nation-wide equalizing fund (Fiorentini et al. (2008)). Finally, they can implement different healthcare
6
Healthcare is mainly provided by public entities and citizens are not allowed to opt out from the system and seek
management schemes, which led several authors to consider 21 healthcare systems in Italy.7 Each regional healthcare system is organized in LHUs, IHs, RHs, THs, and private institutions. LHUs
are population-based healthcare organizations that provide primary medical services and coordinate
non-emergency admissions to hospitals in their geographical area. LHUs provide medical services
through hospitals they own and manage, IHs, RHs, and THs. The IHs and THs are essentially
struc-tured like the British National Health System’s Trusts (Anessi Pessina et al. (2004)). Patients are
covered by health plans provided by LHUs according to their place of residence, even though they
can also choose to receive hospital care from a hospital that does not belong neither to their LHU
area nor to their Region of residence. As a consequence, a proxy for the healthcare system quality
can be provided by the mobility rates: internal mobility, when migration takes place within the
Region of residence; and external mobility, when migration involves healthcare providers outside the Region of residence. Healthcare structures in Northern Regions are generally considered to
pro-vide higher quality healthcare than their equivalents in the South. For example, Fabbri and Robone
(2010) show that, in 2001, the proportion of patients searching for hospital care outside their LHUs
of residence (exit rate) was higher for poorer (i.e., Southern) Regions, with variations according to
the type of care (more severe for cancer and complex surgery).
2.2 Legal Elements and the Insurance Market
Italy possesses no specific statute law to regulate the physician-patient relationship, although
at-tempts have been made. Therefore, the physician-patient relationship is regulated mostly by case
law similarly as in the U.S. and, specifically, through the jurisprudence developed by the Court
of Cassation (the higher court for civil and criminal jurisdictions). The duties of a medical care
provider (staff member, public or private hospital employee or independent practitioner) towards
the patient are interpreted as contractual obligations as far as liability is concerned. Tort law
liabil-ity rules (responsabilità aquiliana) are in fact not applicable to medical malpractice cases: doctors’s and hospitals’ liability is formally regulated by contract law.8
7
The current decentralized structure of the Italian Health System is the product of several reforms which, starting
in the Nineties, tried to make the regional governments more fiscally responsible, coping with soft-budget constraint
problems between Regions and the Central State (Bordignon and Turati (2009)) on one side, and to make the overall
mainly public system more competitive and efficient on the other side. These reforms introduced managerialism, fiscal
tools for decentralization and quasi-market mechanisms (Fattore (1999); Jommi et al. (2001); France et al. (2005)). In
the aftermath of these reforms, the number of IH and TH increased while the number of LHU decreased as Regions were
trying to reshape their own healthcare governance, especially in those realities characterized by a stronger preference for
competition (CERGAS, 2004). 8
The main implication, in liability terms, is related to: 1) burden of proof, which is on the defendant (physician or
hospital) (Art. 1218 of the Civil Code); 2) standard level of care, which should consider the specificities of the professional
activity (Art. 1176 of the Civil Code); 3) employee’s liability (Art. 2236 of the Civil Code); and 4) statute of limitations,
Victims of malpractice can seek compensation not only through civil justice but also through
the criminal system, suing either the physician or the hospital or both. As a matter of fact, criminal
courts can decide over the compensation due to medical liability even when the main indictment
is criminal (i.e., minor or major personal injury) (Garoupa and Grembi (2010)). Public healthcare providers (LHUs, IHs, RHs, THs, and hospitals directly managed by LHUs) are not legally obliged
to insure for medical malpractice themselves, but they must provide insurance for their medical
personnel. The insurance covers professional liability against third-parties.9 According to the data released by the Italian Association of Insurance Companies (ANIA (2010)), during the period
2000-2008 there were between 13 and 14 compensation requests for every 100 physicians, with an average
paid damage of 39,779 euros (2005 data) and an increasing trend between 1995 and 2004.10 The ratio between the number of filed suits and the number of compensation requests seems to be quite
low (significantly lower than 20%), although evidence on this index is available for a limited number
of regions (Amaral-Garcia and Grembi (2011)).
Like all public agencies in Italy, public providers are not allowed to access the market to select
an insurer at their discretion: they need to open a call for tenders (public procurement auctions) in
order to contract out the coverage. The insurers operating in the Italian market for medical
mal-practice are private companies, either national or international. These insurance companies cover
healthcare providers mainly on the basis of a yearly premium calculated as an adjustable percentage
of the annual gross payroll of the public entity (MoH (2006)). While the insurance premiums have
substantially increased, with a shift fromoccurrence-basedliability insurance coverage to claims-made liability, their calculation does not generally contain any reference to other activity-related statistics.11 We could think of, among others, the number of beds, the average recovery length, the average number of surgeries, or the number of wards, to name only a few. Moreover, experience
rating is not considered in Italy when setting medical malpractice liability premiums, similarly to
what happens in several other countries. Starting in the end of the Nineties, Italian hospitals began
to detect a degree of uneasiness in finding full and affordable coverage for medical liability from the
private market. For instance, Buzzacchi and Gracis (2008) summarize thestatus quoof insurance
details, see Garoupa and Grembi (2010), Scarso and Foglia (2011), and Amaral-Garcia (2011). 9
According to the national collective agreement for physicians signed on February 2005, the insurance needs to
provide a coverage up to 1,549,370.68 euros per medical accident, and up to 1,032,913.80 euros per person. 10
Calculations by Amaral-Garcia and Grembi (2011), using ANIA (2010) data. There are no national data available on
the number of paid claims. Just to have a reference indicator - even though plain comparisons should not be made given
the differences in sampling groups and healthcare systems- in Texas, total claims averaged about 20 per 100 physicians
in 2002 (Black et al. (2005)). In Florida, in 2003, the median payment per paid claim was equal to 150,000 dollars (the
mean was 300,000 dollars) (Vidmar et al. (2005)).
11In the former case, the insurance covers all accidents occurring in the policy year. In the latter case, the insurance
covers only those claims that are filed in the policy year. See Mello (2006). This is ade factotransfer of risks since the
coverage for LHUs and IHs from 2003 to 2006: out of the 308 collected calls for bids, the authors
report successful bids only in 55 cases. A failure in a total of 53 cases was found: in 40 calls there
was a lack of bidders or a lack of qualified bids; in 13 cases, there was a new call for bids opened
within one year after the previous award. For the remaining 200 cases there was no information on
the outcome of the call.
In most cases, the lack of further information is not due to the absence of bidders but to a shift
to alternative schemes of contracting, only feasible once an open call has not worked out. These
schemes provide a higher degree of contractual power to the providers against a lower level of
competition among insurers (procedure ristretteorprocedure d’urgenza), which are directly invited. So that, for instance, the providers can have incentives to classify the bids as inadmissible and then
invite only a few insurers to the bargaining process. Often the bargaining does not receive any
publicity and this is why we cannot infer anything from the 200 bids with no results reported by
Buzzacchi and Gracis (2008). As they state, a low degree of competition in the calls’ process
and a scarcity of appropriate information monitoring the public agents’ side is the only arguable
conclusion.12
Probably related to the low level of transparency affecting the process followed by the structures
when contracting out insurance coverage, between 2001 and 2008, 8 Regions out of 21 implemented
monitoring systems on medical malpractice claims. Thirteen Regions never adopted any policy
dur-ing the observation period, one Region was under the monitordur-ing policy before 2001 (Provincia
Autonoma di Trento, since 1997), and the main variation for the monitoring policy is due to 7 Re-gions. In Table 1 the timing of the policies and the Regions involved are specified. Two Regions,
Piemonte (since 2004) and Friuli Venezia Giulia (since 2006), adopted also a form of public
insur-ance (self-insurinsur-ance at the regional level) for their structures up to a compensation limit (500,000
euros), which counts as a deductible on the private market for medical malpractice insurance. The
contracting out of coverage higher than the set limit is managed directly by the Region and not by
the structures.
Table 1- Institutional details- here
3
Evaluation Framework
3.1 Econometric Strategy
To identify the effect, if any, of the treatment (Claims) , we use a Difference-in-Differences (DD)
es-timator that exploits the regional changes taking place at different points in time, as already adopted
12The Italian Antitrust Authority came to the same finding analyzing the overall market of contracts between the private
in the literature (Autor et al. (2006); Acemoglu et al. (2011)). DefineYirtas paid malpractice
pre-miums or legal expenditures by provideri, delivering healthcare in Regionr, at timet. We estimate the following equation:
Yirt=γi+λt+δP ostt∗Claimsr+X
′
itβ+Z
′
rtω+εirt (1)
whereγi is a vector of healthcare provider intercepts and λt is a vector of year dummies, so
that we control for both healthcare structure specific trends and time aggregated shocks. P ostt is
a dummy equal to 1 if t ≥ t∗ and 0 otherwise and Claims is equal to 1 for Regions adopting
monitoring. In this setting,t∗is equal to the adoption year ofClaims.δrepresents the DD estimator
and it can be written according to the following standard equation
δ={E[Yirt|Claimsr = 1, P ostt≥t∗]−E[Yirt|Claimsr= 1, P ostt< t∗]}
− {E[Yirt|Claimsr = 0, P ostt≥t∗]−E[Yirt|Claimsr = 0, P ostt< t∗]}
In our model we take into account two vectors of control variables per healthcare unit -Xit′ -and Regions -Zrt′ - which, according to the literature on malpractice, could have some impact on the trend of malpractice premiums and on legal expenditures as well (e.g. Thorpe (2004)).13 Xit′
groups structural characteristics of the healthcare providers. These include: 1) a set of dummies for
the type of the healthcare provider (LHUs, IHs, THs and RHs), since different healthcare structures
tend to have different management and organizational arrangements, which might affect insurance
management and their bargaining power; 2) the amount of medical personnel payroll, given that
medical liability insurance companies operating in Italy tend to set premiums according to a
per-centage of the gross payroll; 3) two indexes to consider patients’ mobility that healthcare providers
need to manage. These indexes control for qualitative differences, which could affect the number
of medical errors or the probability of filing claims. Hence, we use: a) the ratio of revenues due
to medical care provided to residents of other LHUs within the same Region (entry rate), being higher revenues potentially associated with higher quality; b) the ratio of expenditures due to
ser-vices that resident patients received from other public healthcare structures within the same Regions
(exit rate).14 The latter is an approximation of poor quality. For example, if patients perceive that the hospitals managed directly by the LHU of their residency provide low quality care, they might
decide to abandon the assigned healthcare providers. Mobility can be seen as a "defensive strategy"
in the face of poor quality (Fabbri and Robone (2010)).
13
For an accurate description of the variables see Table A6 in the Appendix. 14
We did not use mobility ratesfromandtoout-of-Region healthcare structures because the reliability of the data is not
very accurate for these cases. Generally, those financial transfers are done among Regions and not healthcare structures,
which means that they can be made even two years after the healthcare delivery. Therefore, the financial values of the the
Zrt′ includes four regressors available at the regional level, which allow to control for the socio-economic characteristics of the Regions in which public healthcare providers operate. It includes:
1) a weighted measure for the resident population per LHU, calculated as the number of regional
residents divided by the number of LHUs operating within the Region. Although an approximation,
this variable provides an assessment of the patients’ set for which the LHUs have to buy or provide
medical services either directly (in their own hospitals) or through other healthcare structures (other
LHUs’ hospitals, or IHs, THs, and RHs). Therefore, this variable is a proxy for both dimensions
and activity levels of LHUs; 2) a litigation rate index, calculated as the total number of regional
ordinary civil proceedings filed in First-Instance Courts weighted per 1,000 residents. It is important
to include this variable because it can be a direct driver of legal expenditures and compensation
requests, which are the main focus of the monitoring policy; 3) the average duration of First Instance
cases resolution, because it is a proxy for the efficiency of the civil justice system and, generally,
medical malpractice cases tend to have a higher than average duration with consequences mainly
on the insurer reserves; and 4) the regional GDP, to control for territorial differences in economic
conditions of both the patients and the providers (partially funded by regional taxes).
Overall, we are expecting that structures operating in Regions adoptingClaimswill experience lower levels of expenditures for malpractice premiums. The effects on the legal expenditures should
be analogous, if monitoring is able to provide incentives to adopt risk management measures and to
improve the quality of the services supplied by those working underClaims.
3.2 Validity Test
To test the robustness of the DD assumption of a common trend between treated and control
Re-gions, we propose the implementation of a validity test. The basic intuition of the DD approach
relies on the assumption that, but for the treatment, changes in the outcome variable over time
would have been exactly the same in both treatment and control groups (Bertrand et al. (2004)).
Suppose that, in our setting, healthcare providers operating in treated Regions were paying higher
premiums and legal expenses than healthcare providers in the control group. Additionally, consider
that this was the reason why treated Regions adopted the policies. Then, the assumption specified
above would not hold. Validity tests help verifying the possibility that the treatment is induced by
the outcome variable (i.e., endogeneity of the intervention variable). Additionally, our estimates of
the reform’s effects could also capture a trend triggered by the operational context characteristics or
some anticipation adjustments (i.e., the private insurer behavior). If this was the case, the estimated effect would not reflect the true effect of the treatment. For instance, if public healthcare providers
were not able to get insurance in the first place (i.e., availability crisis) this would generate a de-crease in paid premiums. As a consequence, we would have a decreasing trend in paid premiums,
Hence, we run a placebo test using a fake measure of the treatment year using the following
model:
Yirt =γi+λt+δP ostt_f ake∗Claimsr+X
′
itβ+Z
′
rtω+εirt
whereP ostt_f akeis equal to 1 when providers operate in Regions adoptingClaimsand
P ost_f ake ≥ t_f akewith t_f ake = mean(t∗ −2001).15 If the "fake" treatment coefficient is significant, the regional policy cannot be regarded as responsible for whatever impact we might
detect estimating equation (1). Indeed, a significant "fake" treatment coefficient means that it is
something happening before the treatment year that triggered the trend.16
4
Data and Descriptive Statistics
We collected data from the Ministry of Health (MoH), the Italian National Institute of Statistics
(Istat), and the Ministry of Justice (MoJ), from 2001 to 2008.17 The Ministry of Health releases the annual balance sheets of each LHU, IH, RH, and TH. From this source we obtain the two outcomes
of interest (Yirt): paid insurance premiums and legal expenditures. Paid insurance premiums are a
proxy for medical malpractice liability premiums, since the share of the latter is not specified in the
former aggregate measure. However, since 2008, public healthcare providers need to declare the
amount of paid medical liability premiums, distinguishing them from other types of insurance that
the healthcare provider might have bought, such as a fire insurance. A check on 2008 data shows
that medical liability premium counts, on average, for 80% of the total paid insurance premiums.
All in all, the aggregate measure can be regarded as a good proxy for paid medical malpractice
premiums.
Legal expenditures are an aggregate measure as well, which includes essentially costs due to
litigation and are available only until 2007. Wages paid to lawyers working at healthcare facilities
and expenses with legal counseling are not part of legal expenditures.18 Therefore, this variable can be considered as a proxy for costs related to claims.
Figure 1 shows the per capita increase in paid premiums at the regional level from 2001 to 2008.
All Regions are distributed in the upper part of the diagonal (the 45 degree line) which points to the
15
See Table 9 for the fake year specification.
16We consider the possibility to run a Granger causality test, using years before the policy adoption and years after.
This approach would imply loosing several Regions from the check given the available years for the data. See Table 1 for
the institutional details, and the data description section.
17Financial data before 2001 are available but, unfortunately, the organization of the Balance sheet changed in 2001.
Therefore, it is impossible to reconstruct the series. 2008 is the last available financial year in October 2011. 18
It is not possible to know the wage that healthcare providers pay to their lawyers because the financial data provides
fact that the vast majority of Regions experienced significant increases. On average, paid premiums
rose approximately 120%. In 2001 residents in Valle d’Aosta were paying the highest per capita
premium, around 10 euros, while in 2008 residents in Abruzzo were among those paying the most,
with a per capita bill higher than 15 euro (2009 values).
Figure 1: Paid Premium per capita variation (2001-2008) - here
Our final dataset is an unbalanced panel, with a minimum of 225 public healthcare structures
to a maximum of 282. LHUs are the most represented type of healthcare provider in the sample,
followed by IHs, THs, and RHs (Table 2). The changes in the observed number of structures is due
to mergers among them or the creation of new structures during the analyzed period.
Table 2: Healthcare Structures Types - here
THs are paying, on average, higher premiums than the other healthcare structures. One
possibil-ity might be that these higher premiums reflect their risk exposure related to, among other things, the
interns. However, given the lack of experience rating characterizing the sector, it is more probable
that the numbers are due to the higher amounts of TH payrolls, THs having more medical staff or
more senior physicians. As shown in Table 3, LHUs registered higher increase rates: in 2001, LHUs
paid on average 893,000 euros in premiums while in 2008 this amount was equal to 2,353,000 euros
(2009 euros). A similar trend is detectable for legal expenditures (Table 4).
Table 3: Average Premium per Type of Healthcare Structure - here
Table 4: Average Legal Expenditures per Type of Healthcare Structure - here
In Table 5 the number of healthcare structures affected by the monitoring policy (the treated) is
shown. RHs are observed from 2003, since in that year a new legislation was enforced concerning
the regulation and organization of these healthcare providers and their data are available after that
date. In 2001 and 2002 only 1 LHU worked under the policy, the only LHU operating inProvincia di Trento.
Table 5: Total Number of Healthcare Structures (Treatedvs. Control) - here
According to the descriptive evidence, paid premiums increased for all the healthcare providers
in both the treated and non-treated samples. Table 6 shows the average paid premiums and legal
expenditures for the treatment and control groups. Overall, paid premiums of the treated increased
on average 102.5% compared to the 142.2% increase in the control group. The increase in legal
expenditures is astonishing for the non-treated, up to 244.3% compared to 67.1% for the treated
If we consider the trend according to the type of healthcare structure (Table A1, in the
Ap-pendix), the percentage increase in premiums from 2001 until 2008 is higher for the non-treated
than for the treated groups, but for THs. The percentage increase for LHUs was equal to 182%
for the control group and 143.4% for the treated group. With respect to IHs, premiums increased
138.9% for the non-treated and 82% for the treated group. However, we can see that THs suffered
a higher increase in premiums in the treated (74.8%) than in the control group (36.4%). We can
make the same calculation for RHs (only from 2003 until 2008): the difference between control and
treated groups is considerably high, with and increase of 55.3% for the treated and 193.6% for the
control group.
Legal expenditures also show some differences between control and treated Regions, according
to the type of healthcare structure (Table A2, in the Appendix). The percentage increase overtime
was, similarly to what we described previously for premiums, higher for the control than for the
treated groups (with the exception of THs that present a lower percentage increase for the control
group).19 However, the difference in the percentages are considerably higher for the control group. From 2001 until 2007, control LHUs show a 300% increase in average legal expenditures, while this
increase was only equal to 63.1% for treated LHUs. The difference is even higher for IHs (428.6%
and 63.3% increase for the control and the treated, respectively). The smallest difference between
treated and control groups is presented by RHs although for this type of healthcare structure the
percentage increase was higher for the treated (78.2%) than for the control group (58.6%).
Non-treated RHs suffered a 476.2% increase in legal expenditures from 2003 until 2007, while this
increase was equal to 157.9% for treated RHs.
Table 6: Average Premiums and Legal Expenditures (Treatedvs. Control) - here
Finally, the graphical analysis to show the trend of the dependent variables before and after
the treatment (visual check for the common trend assumption) is not so straightforward given that
Regions adopted the policy in different years during the period of observation. We decide to provide
two sets of graphs, a first showing a DD traditional graphical representation (Figures 2 and 3) and a
second grouping graphical analyses more consistent with the institutional case we are dealing with
(see Autor et al. (2006)) (Figures 4 and 5). According to the former, we plotted the values for paid
premiums and legal expenditures distinguishing between the treated and the control providers as in
Figures 2 and 3. It is apparent that the trends of the treated and the control are diverging starting
from a certain point in time. However, the visual effect could be explained in a twofold way: 1) the
effect is due to the providers of those Regions treated before the lines started diverging, because the
treatment effect took time to be detectable; or 2) the effect is due to the providers of those Regions
19
that will be treated after the lines start diverging, because there is a violation of the identifying
assumption of common trend.
Figure 2 and 3: Premiums and Legal Expenditures of Treated and Control - here
The traditional DD graphical analysis does not allow to clearly disentangle between the two
explanations. Hence, we show graphical evidences only for the treated referred to the years
imme-diately before and after the implementation of the policy. In Figures 4 and 5 we consider 2 years
before the treatment and 2 years after, setting the year of adoption equal to 0. The trends seem
to show evidence that introducing monitoring on malpractice claims decreases paid malpractice
premiums (Figure 4). An analogous trend is associated to the legal expenditures (Figure 5).
Figure 4 and 5: Premiums and Legal Expenditures of the Treated - here
5
Empirical Results
5.1 The Impact of Monitoring on Paid Premiums and Legal Expenditures
We run the models specified in Sections 3.1 and 3.2 distinguishing between the entire sample and
the sample considering LHUs only. The split is due to the fact that theexit rateindex is meaningful only for LHUs, since it will be the LHU of the patient residency that will pay for the medical care
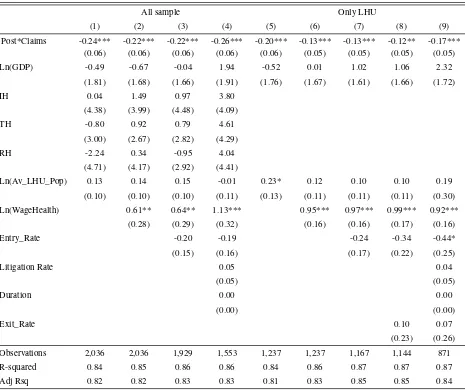
delivered to her by a provider other than its own hospitals. In Tables 7 and 8, we show the results
of the model described in Section 3.1 for both paid premiums and legal expenditures. We present 4
regressions for the entire sample and 5 for the LHUs sample, adding controls in a stepwise way to
show the robustness of the treatment’s estimate. Regressions (4) and (9) includelitigation ratesand
durationand, as such, they refer to samples containing observations until 2007, given the availability
oflitigation rate andduration only up to that year. Regression (8) includesexit rateonly for the LHUs. Model (4) is our preferred specification when all sample is considered, whereas Model (8) is
the preferred specification for the LHUs sample since both represent the most complete version of
equation 1 for the entire period. All regressions include years and healthcare structures fixed effects,
which means that we are controlling for unobserved heterogeneity among the healthcare structures
and external shocks, which have equally affected all the structures.20
Tables 7-8: Regressions Results - here
The impact ofP ost∗Claims(δ) on premiums is assessed in a range between -20% (Table 7, Model 3) and -23% (Table 7, Model 4) in the complete dataset, and between -11% and -16% in the
20
dataset of LHUs. Among the regional controls, the duration of civil proceedings and the healthcare
provider potential population have no significant impact21on paid premiums although their sign is the expected one. Among the structures controls, it is confirmed that a crucial role is played by the
gross payroll which exerts a positive and significant impact of paid premiums, as expected. The
coefficient of the financial variables represent elasticities, therefore an increase of 10% of the gross
payroll is associated to an increase of 6.4% in paid premiums (Model (3)). Mobility rates are not
significant (but forentry ratein Model (9)) even if their sign is consistent with our a priori when the
outcome of interest is paid insurance: negative forentry rate(Table 7, Models (3), (4), (7), (8), and (9)) - which stands for good quality - and positive forexit rate(Table 7, Models (8) and (9))- which stands for bad quality.
There are no significant effects on legal expenditures, but for Models (1) and (2) of Table 8.
Besides the fact that actually no improvement in the quality of the services can be linked to the
reform as we measure such improvement through the legal expenditures, another reason for these
poor results could be linked to the fact that data for legal expenditures are only available until 2007.
The signs of the qualitative indexes (entry andexit rate) are reverted (Table 8, Models (3), (4),
(7), (8), and (9)) compared to those for paid premiums. Entryandexit rateseem to capture here the activity levels with better providers (e.g., more patients to treat) having to cope with presumably
more claims, than structures that are abandoned by their registered patients. However, the coefficient
is significant at 5% only when the LHUs sub-sample is considered (Table 8, Model (9)).
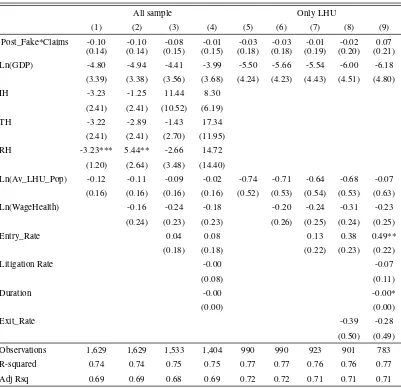
Results from the validity tests shown in Tables 9 and 10 confirm the robustness of the coefficients
in Tables 7 and 8. Table 9 presents the results of the validity test when the outcome of interest is paid
premiums and reveals thatP ost_f ake∗Claimsis not significant.22 The finding is confirmed also by the results of Table 10 which provides the coefficients for the impact ofP ost_f ake∗Claims
on paid legal expenditures.
Tables 9 and 10: Regressions Results of the Validity Test - here
As a further robustness check we run equation (1) (Section 3.1) on a subset of regional providers,
dropping those which merged with other providers during the period.23 The rationale of this check is quite intuitive. Since several mergers took place, it could be that we detect a significant decrease in
the paid premiums triggered by the new organizational scheme due to the mergers. In other words,
we could expect a drop in the transaction costs associated to the contracting out of malpractice
insurance and consequent rise of the bargaining power of the new, bigger providers. It is also true
that mergers might not be the consequence of rational business planning, but rather the byproduct of
21The coefficient of healthcare provider potential population is statistically significant in Model 5, but only at 10%.
22
Except in Model (4), but only at 10%. 23
budget constraints or political issues. In this case, and considering the time lag in moving from one
management scheme to another within the public sector, the augmented contractual capacity could
be counterbalanced by an inefficient transition period (e.g., more dispersion of the information, staff
replacements).
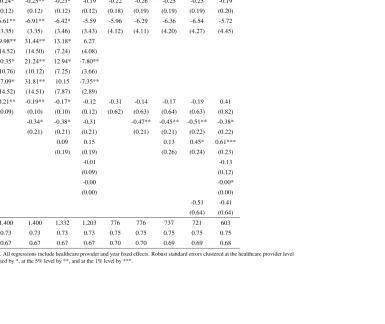
Tables 11 and 12 show the results only on structures not taking part in a merger. The impact
of the policy is again assessed mainly on paid premiums in a range between -25% (Model (3)) and
-27% (Model (4)) for the entire dataset and between -15% (Model (8)) and -20% (Model (9)) if
we consider LHUs only. These results seem to address a sort of distress associated to the mergers,
more than an improvement in the efficiency of the system. Claimshas a slightly significant impact on legal expenditures but only for the regressions on the entire dataset and in Models (1) to (3)
(Table 12).
Tables 11 and 12: Regressions Results for No Merged Structures- here
5.2 The Channels of the Policy
In the previous section, we detected a reduced form effect of -20% (-11% on LHUs) on paid
pre-miums. We interpret this as an increase in the surplus of the public providers from the insurance
contract, triggered by the enhanced monitoring and information due to the analyzed policy. This
surplus gain might arise from two different channels, which often move jointly. First, on the
de-mand for insurance side, it might be due to an increase in the bargaining power of the providers.
Second, on the supply side of the insurance market, it might be related to a raised interest of more
competitors aware that the position of the incumbent insurer is weaker as a consequence of the
higher level of information available to the providers.
In order to assess the channels through which the estimated policy can exert its effects we use
data on calls for bids of medical liability insurance contracts for the years 2008-2011 released by
the Italian Authority for the Surveillance on Public Procurements (Autorità per la Vigilanza sui
Contratti Pubblici di Lavori, Servizi e Forniture-AVCP).24 The AVCP collects data on auctions involving public entities whenever the value of the auction concerns contracts above or equal to
150,000 euros. Due to data limitations we are not able to test the DD model on these data but we
can at least provide descriptive cross-section post treatment evidence that Regions implementing
monitoring end up having less concentrated markets for medical liability and tend to opt for types
of auctions which potentially advantage more competition (i.e., open calls).
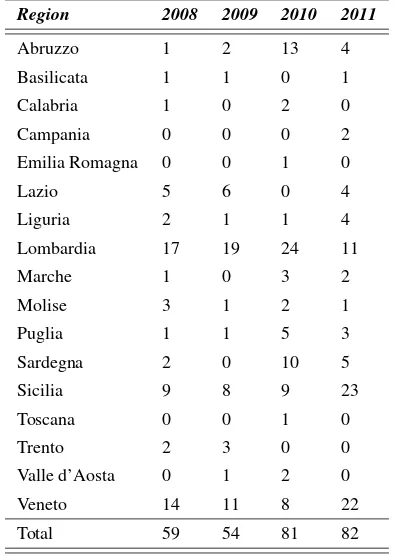
Table 13 shows the distribution of the auctions according to their closing year. For each
in-surance contract we have the identity of the insurer/insurers (e.g., they cover different part of the
contract), the type of auction (e.g., open calls), and both the starting value of the contract and its final price. The price variables are not very informative given the absence of price-related variables
such as the number of providers covered by the insurance, the length of the contract, or the amount
of deductibles if any.
Table 13: Medical Liability Insurance Contracts (2008-2011) - here
Hence, we decide to focus on two outcomes: the chosen type of auction and the identity of the
bidders. First, we generate a dummy variable Open Calls equal to 1 if the type of the auction is open and 0 otherwise (e.g., calls based on invitation, closed calls, etc.). We then use a logit model
to estimate, at the auction-level (c), the probability of choosing open calls in Regionras a function of
Open Callscr =λClaimsr+αt1+γt2+εcr (2)
whereαt1 andγt2 represent the year of the call opening and the year of the call closing with
at least a winner, and Claims is equal to 1 for Regions adopting monitoring. It is not possible to control for any further relevant independent variables at the regional level given the considered
period.
Second, we generate a simple Herfindahl-Hirschmann (HH) index, which is a concentration
index quite used in the analysis run by Antitrust Authorities (e.g., U.S. Department of Justice and FTC 2010). The HH index is calculated by summing the squares of the individual firms market
shares, and thus gives proportionately greater weight to the larger market shares. The higher the
index (i.e., the concentration) the lower the competition in the market of interest.
Typically the index is written asHHr=Σns2n, wheresnrepresents the quota of the insurernin
Regionr, so that we have a HH index for each regional market for medical liability insurance. To derive it using auction-level information, we count the number of winning insurers in each Region
in every year and construct the quota of the market for insurernin Regionr as the ratio between that insurer and the total number of insurers operating in Regionr. Overall, we counted a maximum of 50 insurers, both national (e.g.,Generali) and international (e.g.,Lloyd’s). The way to interpret the index is consistent with any other HH index: the higher the index the lower the competition
level (i.e., the higher the analyzed market concentration). We explain the variation in the HH index according to the following equation:
HHcrt2=σClaimsr+αt1+γt2+θOpenCallscr+εcrt2 (3)
where, as before, αt1 andγt2 represent the year of the call opening and the year of the call
closing, Claims is equal to 1 for Regions (r) adopting monitoring, and Open Callscontrols for the type of auction, which could affect the competitive level of the market. In Table 14 average
Table 14: Descriptive Statistics for Open Calls and HH Index - here
We estimate the two equations on the cross section of available auctions, dropping those
refer-ring to providers operating in Toscana, given its switch to a public insurance scheme for malpractice
starting in 2010. λand its robust standard error in the logit model are respectively equal to +1.68 and 0.32 (significance level at 1%). This means that the probability of selecting open calls is higher
for providers operating under the policy. We derived marginal effects (average partial effects) for
every year and, on average for the overall period, it appears that the probability of selecting open
calls given that monitoring is in place is around 0.30 higher.25
σ is equal to -0.05 and it is statistically significant at 1% level (S.E. -0.009). This means that there is a decrease of 31% in the HH index for providers switching from not operating under
moni-toring to operate under the policy, with an increase of the competition level.
6
Conclusion
We showed that State initiatives to cope with multiple agency problems in the medical
malprac-tice insurance market can be effective, even without any change either in the liability system or
the insurance management schemes (e.g., from private to public insurance). To perform our
analy-sis, we evaluated the impact of a monitoring policy of malpractice claims on medical malpractice
paid premiums and legal expenditures at the healthcare provider level, in a mainly public
health-care system. Such impact runs along two processes: on the one hand, improving the amount of
available information on malpractice (at least on the legal side) seems to generate more convenient
insurance contracts-paid premiums. Several rationales can explain this relationship, among which
an increased ability of local healthcare providers to extract the rent from the private bidders, with
a raise, for instance, in the public procurement quality indexes (e.g., more competition, more
trans-parency) and a reduction of the contractual power of the incumbent insurer. Additionally, it might
be also due to more appropriately defined reserves within the contractual relationship between the
healthcare provider (now more aware of its risk exposure) and the private insurer. Legal
expendi-tures - linked to the burden of litigation - seem to have decreased for healthcare strucexpendi-tures subject
to the monitoring treatment, although not in a significant way. The result could again be due to the
fact that legal expenditures might not be an appropriate measure for the quality of the healthcare
service delivered by each structure, being often the case that higher quality providers, dealing with
higher risk patients, need to cope with more frequent claims than their lower quality equivalents.
Notwithstanding data limitations, we present evidences on a 2008-2011 dataset with auction-level
25The effects have been calculated usingmfx(STATA 11) and setting the year dummies equal to 1 or zero depending
from the considered year. So we have that in 2008 (both opening and closing year), the effect ofClaimsis equal to 0.12
information to show the relationship between the monitoring policy and the increase in the level of
7
Tables and Figures
Table 1: Institutional Details
Regions 2001 2002 2003 2004 2005 2006 2007 2008
Abruzzo
Basilicata
Bolzano
Calabria
Campania
Emilia Romagna C C C C C C
Friuli Venezia Giulia C C C
Lazio C C
Liguria
Lombardia C C C C C
Marche
Molise
Piemonte C
Puglia C C
Sardegna
Sicilia
Toscana C C C C
Trento C C C C C C C C
Umbria
Valle d’Aosta
Veneto
Note: C = monitoring (Claims). Source: AGENAS (2009).
With the exception of Table 1 and Figure 1 all the remaining tables and figures do not include information from Friuli
Table 2: Healthcare Structures Types
Type 2001 2002 2003 2004 2005 2006 2007 2008
LHU 155 169 169 168 168 152 143 138
IH 47 63 60 57 58 58 58 58
TH 23 27 27 28 37 37 39 37
RH 0 0 18 20 19 18 19 19
Total 225 259 274 273 282 265 259 252
Note: LHU:Local Health Units; IH:Independent Hospitals; TH:Teaching Hospitals; and RH:
[image:22.595.150.446.283.377.2]Research Hospitals. RHs do not present data for 2001 and 2002 because they started operating, as we know them today, in 2003 as a consequence of the Legislative Decree n.88/2003.
Table 3: Average Premium per Type of Healthcare Structure
Type 2001 2002 2003 2004 2005 2006 2007 2008
LHUs 893 992 1,292 1,597 1,781 2,003 2,178 2,353
IHs 1,026 1,026 1,232 1,514 1,623 1,762 1,925 1,921
THs 1,508 1,561 1,825 2,383 2,389 2,430 2,110 2,346
RHs . . 550 643 866 972 1,087 1,003
Total 986 1,060 1,283 1,598 1,767 1,940 2,031 2,151
Note: Values are in 1,000 euros deflated at 2009. LHUs: Local Health Units; IHs: Independent Hospitals; THs:Teaching Hospitals; and RHs:Research Hospitals. RHs do not present data for 2001 and 2002 because they started operating, as we know them today, in 2003 as a consequence of the Legislative Decree n.88/2003.
Table 4: Average Legal Expenditures per Type of Healthcare Structure
Type 2001 2002 2003 2004 2005 2006 2007
LHUs 163 183 287 349 503 487 499
IHs 85 125 151 290 232 193 201
THs 112 115 118 182 287 173 202
RHs . . 62 152 191 100 216
Total 140 162 226 304 400 355 374
[image:22.595.172.428.462.552.2]Table 5: Total Number of Healthcare Structures (Treatedvs. Control) 2001 2002 2003 2004 2005 2006 2007 2008
LHU Non-Treated 154 168 155 141 129 113 86 81
Treated 1 1 14 27 39 39 57 57
IH Non-Treated 47 63 59 33 33 33 29 29
Treated 0 0 1 24 25 25 29 29
TH Non-Treated 23 27 23 18 24 24 21 19
Treated 0 0 4 10 13 13 18 18
RH Non-Treated 0 0 17 14 13 12 8 8
Treated 0 0 1 6 6 6 11 11
Total Non-Treated 224 258 254 206 199 182 144 137
Treated 1 1 20 67 83 83 115 115
Note: Treated usingPost*Claims. The total number of healthcare structures suffered some changes, namely due to mergers.
Table 6: Average Premiums and Legal Expenditures(Treated vs. Control) Year Premiums Legal Expenditures
Non-Treated Treated Non-Treated Treated
2001 810 1,173 140 140
2002 844 1,343 164 158
2003 1,011 1,638 252 192
2004 1,288 2,003 310 297
2005 1,505 2,112 481 287
2006 1,713 2,209 396 304
2007 1,765 2,363 482 234
2008 1,962 2,375 . .
Sample Average 1,369 1,911 324 232
[image:23.595.159.441.352.514.2]Table 7: The Impact on Paid Premiums
All sample Only LHU
(1) (2) (3) (4) (5) (6) (7) (8) (9)
Post*Claims -0.24*** -0.22*** -0.22*** -0.26*** -0.20*** -0.13*** -0.13*** -0.12** -0.17*** (0.06) (0.06) (0.06) (0.06) (0.06) (0.05) (0.05) (0.05) (0.05)
Ln(GDP) -0.49 -0.67 -0.04 1.94 -0.52 0.01 1.02 1.06 2.32
(1.81) (1.68) (1.66) (1.91) (1.76) (1.67) (1.61) (1.66) (1.72)
IH 0.04 1.49 0.97 3.80
(4.38) (3.99) (4.48) (4.09)
TH -0.80 0.92 0.79 4.61
(3.00) (2.67) (2.82) (4.29)
RH -2.24 0.34 -0.95 4.04
(4.71) (4.17) (2.92) (4.41)
Ln(Av_LHU_Pop) 0.13 0.14 0.15 -0.01 0.23* 0.12 0.10 0.10 0.19
(0.10) (0.10) (0.10) (0.11) (0.13) (0.11) (0.11) (0.11) (0.30)
Ln(WageHealth) 0.61** 0.64** 1.13*** 0.95*** 0.97*** 0.99*** 0.92***
(0.28) (0.29) (0.32) (0.16) (0.16) (0.17) (0.16)
Entry_Rate -0.20 -0.19 -0.24 -0.34 -0.44*
(0.15) (0.16) (0.17) (0.22) (0.25)
Litigation Rate 0.05 0.04
(0.05) (0.05)
Duration 0.00 0.00
(0.00) (0.00)
Exit_Rate 0.10 0.07
(0.23) (0.26)
Observations 2,036 2,036 1,929 1,553 1,237 1,237 1,167 1,144 871
R-squared 0.84 0.85 0.86 0.86 0.84 0.86 0.87 0.87 0.87
Adj Rsq 0.82 0.82 0.83 0.83 0.81 0.83 0.85 0.85 0.84
Table 8: The Impact on Legal Expenditures
All sample Only LHU
(1) (2) (3) (4) (5) (6) (7) (8) (9)
Post*Claims -0.21* -0.22* -0.20 -0.15 -0.19 -0.22 -0.21 -0.22 -0.17 (0.12) (0.12) (0.12) (0.12) (0.18) (0.18) (0.19) (0.19) (0.19)
Ln(GDP) -5.79* -6.02* -5.38 -4.35 -5.74 -6.01 -5.76 -6.31 -5.63
(3.26) (3.26) (3.43) (3.42) (3.96) (3.96) (4.16) (4.24) (4.33)
IH -3.88* -1.93 14.26 8.97
(2.29) (2.30) (10.16) (5.76)
TH -3.87* -3.57 -0.94 18.59*
(2.29) (2.30) (2.57) (11.16)
RH -3.62*** 6.39** -2.14 16.02
(1.09) (2.60) (3.30) (13.40)
Ln(Av_LHU_Pop) -0.08 -0.07 -0.05 -0.00 -0.38 -0.27 -0.24 -0.26 0.24
(0.16) (0.16) (0.17) (0.17) (0.60) (0.62) (0.63) (0.62) (0.74)
Ln(WageHealth) -0.24 -0.31 -0.24 -0.31 -0.34 -0.41 -0.31
(0.23) (0.23) (0.23) (0.27) (0.26) (0.25) (0.26)
Entry_Rate 0.04 0.09 0.14 0.39 0.53**
(0.18) (0.18) (0.23) (0.24) (0.23)
Litigation Rate -0.00 -0.08
(0.08) (0.11)
Duration -0.00 -0.00*
(0.00) (0.00)
Exit_Rate -0.37 -0.25
(0.49) (0.48)
Observations 1,629 1,629 1,533 1,404 990 990 923 901 783
R-squared 0.75 0.75 0.75 0.75 0.77 0.77 0.76 0.77 0.77
Adj Rsq 0.69 0.69 0.69 0.69 0.72 0.72 0.71 0.71 0.71
Notes: Dependent variable isLn(LegalExpenditures). All regressions include healthcare provider and year fixed effects. Robust standard errors clustered at the healthcare provider level in brackets. Significance at the 10% level is represented by *, at the 5% level by **, and at the 1% level by ***.
Table 9: The Impact on Paid Premiums: Validity Test
All sample Only LHU
(1) (2) (3) (4) (5) (6) (7) (8) (9)
Post_Fake*Claims -0.06 -0.06 -0.07 -0.14* -0.04 -0.01 -0.02 -0.00 -0.05
(0.08) (0.07) (0.07) (0.07) (0.08) (0.07) (0.07) (0.07) (0.08)
Ln(GDP) -0.30 -0.49 0.25 3.33 -0.61 -0.08 0.99 0.98 2.57
(1.75) (1.66) (1.64) (2.05) (1.77) (1.67) (1.60) (1.64) (1.81)
IH -0.51 1.01 0.21 6.76
(4.25) (3.96) (4.41) (4.44)
TH -1.11 0.73 0.40 7.80*
(2.91) (2.72) (2.79) (4.58)
RH -2.73 -0.05 -1.39 7.11
(4.57) (4.18) (2.92) (4.58)
Ln(Av_LHU_Pop) 0.13 0.14 0.15 -0.05 0.18 0.08 0.07 0.08 -0.14
(0.09) (0.10) (0.10) (0.12) (0.12) (0.11) (0.10) (0.10) (0.33)
Ln(WageHealth) 0.63** 0.65** 1.20*** 0.99*** 1.01*** 1.03*** 0.98***
(0.28) (0.29) (0.31) (0.16) (0.15) (0.16) (0.16)
Entry_Rate -0.21 -0.18 -0.25 -0.36* -0.44*
(0.15) (0.16) (0.17) (0.21) (0.26)
Litigation Rate 0.06 0.04
(0.05) (0.05)
Duration 0.00 0.00
(0.00) (0.00)
Exit_Rate 0.08 0.05
(0.23) (0.26)
Observations 2,036 2,036 1,929 1,553 1,237 1,237 1,167 1,144 871
R-squared 0.84 0.85 0.86 0.86 0.84 0.85 0.87 0.87 0.87
Adj Rsq 0.81 0.82 0.83 0.83 0.81 0.83 0.84 0.85 0.83
Notes: Dependent variable isLn(Premiums). Post_Fake*Claimsis equal to one if Region is equal to: Lombardia andyear >= 2002; Lazio andyear >= 2004; Puglia and year >= 2004; Toscana andyear >= 2003; or Region is equal to Emilia Romagna or Trento. All regressions include healthcare provider and year fixed effects. Robust standard
errors clustered at the healthcare provider level in brackets. Significance at the 10% level is represented by *, at the 5% level by **, and at the 1% level by ***.
Table 10: The Impact on Legal Expenditures: Validity Test
All sample Only LHU
(1) (2) (3) (4) (5) (6) (7) (8) (9)
Post_Fake*Claims -0.10 -0.10 -0.08 -0.01 -0.03 -0.03 -0.01 -0.02 0.07 (0.14) (0.14) (0.15) (0.15) (0.18) (0.18) (0.19) (0.20) (0.21)
Ln(GDP) -4.80 -4.94 -4.41 -3.99 -5.50 -5.66 -5.54 -6.00 -6.18
(3.39) (3.38) (3.56) (3.68) (4.24) (4.23) (4.43) (4.51) (4.80)
IH -3.23 -1.25 11.44 8.30
(2.41) (2.41) (10.52) (6.19)
TH -3.22 -2.89 -1.43 17.34
(2.41) (2.41) (2.70) (11.95)
RH -3.23*** 5.44** -2.66 14.72
(1.20) (2.64) (3.48) (14.40)
Ln(Av_LHU_Pop) -0.12 -0.11 -0.09 -0.02 -0.74 -0.71 -0.64 -0.68 -0.07
(0.16) (0.16) (0.16) (0.16) (0.52) (0.53) (0.54) (0.53) (0.63)
Ln(WageHealth) -0.16 -0.24 -0.18 -0.20 -0.24 -0.31 -0.23
(0.24) (0.23) (0.23) (0.26) (0.25) (0.24) (0.25)
Entry_Rate 0.04 0.08 0.13 0.38 0.49**
(0.18) (0.18) (0.22) (0.23) (0.22)
Litigation Rate -0.00 -0.07
(0.08) (0.11)
Duration -0.00 -0.00*
(0.00) (0.00)
Exit_Rate -0.39 -0.28
(0.50) (0.49)
Observations 1,629 1,629 1,533 1,404 990 990 923 901 783
R-squared 0.74 0.74 0.75 0.75 0.77 0.77 0.76 0.76 0.77
Adj Rsq 0.69 0.69 0.68 0.69 0.72 0.72 0.71 0.71 0.71
Notes: Dependent variable isLn(LegalExpenditures).Post_Fake*Claimsis equal to one if Region is equal to: Lombardia andyear >= 2002; Lazio andyear >= 2004; Puglia and year >= 2004; Toscana andyear >= 2003; or Region is equal to Emilia Romagna or Trento. All regressions include healthcare provider and year fixed effects. Robust standard
errors clustered at the healthcare provider level in brackets. Significance at the 10% level is represented by *, at the 5% level by **, and at the 1% level by ***.
Table 11: The Impact on Paid Premiums - No Merged Structures
All sample Only LHU
(1) (2) (3) (4) (5) (6) (7) (8) (9)
Post*Claims -0.27*** -0.25*** -0.25*** -0.31*** -0.23*** -0.16*** -0.16*** -0.16*** -0.23***
(0.07) (0.06) (0.06) (0.07) (0.06) (0.05) (0.05) (0.05) (0.06)
Ln(GDP) 0.02 -0.23 0.10 1.82 -0.21 0.21 0.72 0.71 2.66
(1.85) (1.69) (1.70) (2.00) (1.82) (1.70) (1.72) (1.77) (1.79)
IH -0.49 0.29 -0.73 2.55
(5.23) (4.77) (1.57) (2.54)
TH -1.37 -0.48 -0.49 4.85
(5.58) (5.04) (1.31) (4.48)
RH -4.32 -1.92 -2.44** 1.09
(5.92) (3.59) (1.18) (1.16)
Ln(Av_LHU_Pop) 0.22*** 0.22*** 0.24*** 0.08 0.23 0.10 0.08 0.08 0.29
(0.06) (0.07) (0.07) (0.07) (0.14) (0.11) (0.11) (0.11) (0.33)
Ln(WageHealth) 0.62** 0.63** 1.12*** 0.99*** 0.98*** 1.01*** 0.92***
(0.28) (0.29) (0.33) (0.18) (0.17) (0.17) (0.17)
Entry_Rate -0.24 -0.24 -0.30 -0.39* -0.51**
(0.16) (0.18) (0.18) (0.22) (0.26)
Litigation Rate 0.06 0.05
(0.05) (0.05)
Duration 0.00 -0.00
(0.00) (0.00)
Exit_Rate 0.32 0.29
(0.29) (0.33)
Observations 1,768 1,768 1,691 1,325 991 991 950 933 669
R-squared 0.84 0.85 0.85 0.86 0.83 0.85 0.86 0.86 0.86
Adj Rsq 0.81 0.82 0.82 0.83 0.81 0.83 0.83 0.84 0.83
Notes: Dependent variable isLn(Premiums). All regressions include healthcare provider and year fixed effects. Robust standard errors clustered at the healthcare provider level in brackets. Significance at the 10% level is represented by *, at the 5% level by **, and at the 1% level by ***.
Table 12: The Impact on Legal Expenditures - No Merged Structures
All sample Only LHU
(1) (2) (3) (4) (5) (6) (7) (8) (9)
Post*Claims -0.24* -0.25** -0.23* -0.19 -0.22 -0.26 -0.25 -0.25 -0.19
(0.12) (0.12) (0.12) (0.12) (0.18) (0.19) (0.19) (0.19) (0.20)
Ln(GDP) -6.61** -6.91** -6.42* -5.59 -5.96 -6.29 -6.36 -6.54 -5.72
(3.35) (3.35) (3.46) (3.43) (4.12) (4.11) (4.20) (4.27) (4.45)
IH 29.98** 31.44** 13.18* 6.27
(14.52) (14.50) (7.24) (4.08)
TH 20.35* 21.24** 12.94* -7.80**
(10.76) (10.12) (7.25) (3.66)
RH 27.09* 31.81** 10.15 -7.35**
(14.52) (14.51) (7.87) (2.89)
Ln(Av_LHU_Pop) -0.21** -0.19** -0.17* -0.12 -0.31 -0.14 -0.17 -0.19 0.41
(0.09) (0.10) (0.10) (0.12) (0.62) (0.63) (0.64) (0.63) (0.82)
Ln(WageHealth) -0.34* -0.38* -0.31 -0.47** -0.45** -0.51** -0.38*
(0.21) (0.21) (0.21) (0.21) (0.21) (0.22) (0.22)
Entry_Rate 0.09 0.15 0.13 0.45* 0.61***
(0.19) (0.19) (0.26) (0.24) (0.23)
Litigation Rate -0.01 -0.13
(0.09) (0.12)
Duration -0.00 -0.00*
(0.00) (0.00)
Exit_Rate -0.51 -0.41
(0.64) (0.64)
Observations 1,400 1,400 1,332 1,203 776 776 737 721 603
R-squared 0.73 0.73 0.73 0.73 0.75 0.75 0.75 0.75 0.75
Adj Rsq 0.67 0.67 0.67 0.67 0.70 0.70 0.69 0.69 0.68
Notes: Dependent variable isLn(LegalExpenditures). All regressions include healthcare provider and year fixed effects. Robust standard errors clustered at the healthcare provider level in brackets. Significance at the 10% level is represented by *, at the 5% level by **, and at the 1% level by ***.
Table 13: Calls for Bids for Insurance Coverage
Region 2008 2009 2010 2011
Abruzzo 1 2 13 4
Basilicata 1 1 0 1
Calabria 1 0 2 0
Campania 0 0 0 2
Emilia Romagna 0 0 1 0
Lazio 5 6 0 4
Liguria 2 1 1 4
Lombardia 17 19 24 11
Marche 1 0 3 2
Molise 3 1 2 1
Puglia 1 1 5 3
Sardegna 2 0 10 5
Sicilia 9 8 9 23
Toscana 0 0 1 0
Trento 2 3 0 0
Valle d’Aosta 0 1 2 0
Veneto 14 11 8 22
Total 59 54 81 82
Table 14: Average Open Calls and HH Index(Treated vs. Control)
Year Open Calls HH Index
Non-Treated Treated Non-Treated Treated
2008 0.82 1 0.16 0.13
2009 0.32 0.86 0.16 0.13
2010 0.47 0.70 0.17 0.09
2011 0.54 0.76 0.16 0.10
Average 0.54 0.83 0.16 0.11
[image:30.595.162.435.445.571.2]Figure 1: Paid Premium per capita (variation 2001-2008)
NOTE: Per capita paid premium variation from 2001 to 2008. Treated Regions (i.e., that adopted a monitoring system) with diamond symbol; control Regions with circle symbol. Dotted-line is the 45 degree line.
Figure 2: Premiums: Treatedvs.Control
[image:31.595.149.449.409.640.2]Figure 3: Legal Expenditures: Treatedvs.Control
NOTE: "Num. of switches to Monitoring" represents the total number of Regions adopting a monitoring system. Trento is not included as it implemented the monitoring system in 1997. Legal expenditures are only available until 2007.
Figure 4: Paid Premium of Treated
[image:32.595.148.450.462.689.2]Figure 5: Paid Legal Expenditures of Treated