Munich Personal RePEc Archive
Occupational structures, migration,
religion and poor relief in nineteenth
century urban Ireland
Cousins, Mel
Galsgow Caledonian University
January 2011
Online at
https://mpra.ub.uni-muenchen.de/28734/
Occupational structures, migration, religion and poor relief in nineteenth
century urban Ireland
1Mel Cousins
Glasgow Caledonian University
Introduction
Although Ireland had a national poor law (introduced in 1838), patterns of poor relief varied greatly amongst nineteenth century Irish cities. In 1901, indoor relief varied from a low of 0.5 persons supported per 100 population in northern Londonderry to a high of 1.8 in the large South Dublin union. Similarly, outdoor relief varied from a low of 0.1 person supported (per 100 population) (again in parsimonious Londonderry and also Belfast) to a high of 2.0-2.1 in the southern capitals of Cork and Limerick. To date, however, there has been little examination of the reasons behind these divergences. One possible factor is the divergent occupational and demographic structures of these cities – ranging from the dramatic growth of an industrialising Belfast, to relative (post-Famine) stability in more service-oriented Dublin, to the slow decline of other southern regional capitals.
This paper examines the occupational and social class breakdown of the six major Irish cities over the period from 1861 (after the Great Famine) to 19012 and explores whether the difference in these factors can help to explain the differences in poor relief policies adopted in the different poor law unions. The paper analyses the occupational structure of the six major cities in both 1861 and 1901 drawing on the existing Census
categorisation of occupations and recoding these according to the HISCO system.3 It
1
An earlier version of this paper was originally presented at the European Social Science History Conference (ESSHC), University of Lisbon, 27 February 2008. I am grateful to participants for their comments.
2
There was a significant change in Ireland’s occupational structure as a result of the Great Famine (1846-51). The 1861 Census is the first truly post-Famine Census. I chose the 1901 Census (rather than 1911) as an end point as it seems likely that the introduction of the old age pension in 1908 would have had some impact on the reporting of occupations amongst older persons.
3
uses this system and the related HISCLASS4 to categorize the large number of existing occupational titles (which varied over time) into a consistent schema.5
It concludes that the aggregate evidence suggests little clear link between occupational structures and poor relief policies. While it would seem unlikely that occupational structures did not have some impact on such policies, it appears that the impact of such structures was mediated through a range of other policies and will only be revealed through detailed local studies. Drawing on broader work, the paper suggests that key influences in the different patterns of poor relief– in addition to overarching factors such as the wealth of a union – may have included both religious factors and the use of poor relief policy to control in-migration in the rapidly growing northern cities.
Irish urban structure
Compared to Ireland’s closest neighbour Great Britain, Ireland had a relatively low level of urbanisation in the nineteenth century.6 Nonetheless the six largest cities made up about one-quarter of the total population and Ireland’s level of urbanisation was similar to that of France or Belgium and higher than in countries such as the Nordic countries, Austria-Hungary and Spain.7 Although ‘city’ is a legal term in Irish law, the attribution of the term to a conurbation owes more to historical chance than population size. I examine here the six cities which were clearly the largest over the period in question – all having at all times a population of over 20,000.8 These range from the large cities of Dublin and Belfast, to the medium sized (but declining) southern city of Cork to a number of small regional capitals (table 1). As can be seen from the map, all are coastal cities and only Limerick is located on the west coast.
4
M. H.D. van Leeuwen, Ineke Maas “A short note on HISCLASS” on http://historyofwork.iisg.nl/
5
Although preliminary analysis according to HISCLASS has been carried out, the main results are not included in this paper as they are subject to rechecking and verification.
6
T. Guinnane, The Vanishing Irish: Households, Migration and the Rural Economy in Ireland, 1850–1914, Princeton University Press, 1997, pp. 121-2. Although, in a broader European context Ireland had a similar level of urbanisation to countries such as
7
S. Halperin, War and Social Change in Modern Europe, Cambridge University Press, 2004, table 3.8.
8
As can be seen in table 1 (which shows the cities in order of population), Dublin was historically the largest city and its population grew moderately in the period.9 Belfast, in contrast, had grown from a town of under 20,000 in 1801 to the second largest city by 1861 and almost trebled its population in the period to 1901. Similarly, although on a smaller scale, Londonderry almost doubled its population by 1901. By contrast Cork and Limerick experienced population loss although Waterford saw modest growth.
Table 1: Population of 6 main cities, 1861-1901
1861 1901 Change
Dublin 246465 290638 17.9 Dublin city &
suburbs 296413 355181 16.5 Belfast 119393 349180 192.5
Cork 79594 76122 -4.4
Limerick 43924 38151 -13.1 Londonderry 20519 39892 94.4 Waterford 22869 26769 17.1 Source: Vaughan and Fitzpatrick, Irish Historical Statistics, table 10.
Belfast was a predominantly Protestant city although with a significant Catholic
minority. In Londonderry city itself the Catholic population had a small majority but the surrounding area (which was included in the union) had a Protestant majority and urban local government was largely in Protestant hands. By contrast all the other cities were mainly Catholic.
Unfortunately for present purposes, the city boundaries do not always match closely with those of the poor law unions.10 In 1861, in the largest cities (Dublin and Belfast) the urban population made up 73-85% of the union population. However, the smallest cities (Londonderry and Waterford) were dominated by their hinterlands with the urban population making up only about a third of the union.11 This problem persisted in 1901
9
The suburbs (which include Pembroke and Rathermines and Rathgar) are an integral part of the city and the separate classification owed more to political factors. For most purposes using the Dublin city and suburbs data will give a more accurate impression of the city. However, the suburbs did not form part of the Dublin city poor law unions and thus we use the narrower city figure in the analysis here.
10
In addition the Dublin area is divided into two unions for which separate occupational data are not available.
11
albeit to a lesser extent. By 1901, Belfast city overflowed the poor law union; the Dublin city population made up three-quarters of the unions’ total; while the remaining cities constituted between 56-67% of their unions. Although the match is far from perfect we would, however, expect that – particularly in 1901 – the city population would have a significant impact on overall union policy and practice.
The structure of the poor law in urban Ireland
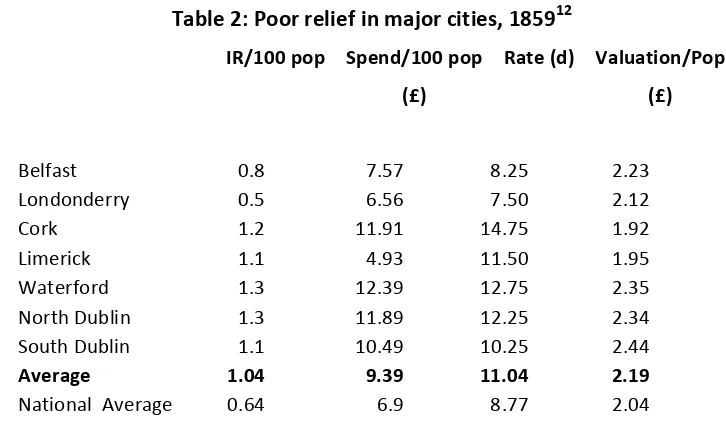
[image:6.595.112.475.276.491.2]As set out in tables 2 and 3, there was considerable variation in poor relief in Irish cities in 1861 and this variation had increased by 1901.
Table 2: Poor relief in major cities, 185912
IR/100 pop Spend/100 pop
(£)
Rate (d) Valuation/Pop
(£)
Belfast 0.8 7.57 8.25 2.23
Londonderry 0.5 6.56 7.50 2.12
Cork 1.2 11.91 14.75 1.92
Limerick 1.1 4.93 11.50 1.95
Waterford 1.3 12.39 12.75 2.35
North Dublin 1.3 11.89 12.25 2.34
South Dublin 1.1 10.49 10.25 2.44
Average 1.04 9.39 11.04 2.19
National Average 0.64 6.9 8.77 2.04
Source: Cousins, Poor relief in Ireland, Database of poor law statistics
As can be seen, there is relatively little variation in terms of the wealth of the six cities (measured as the valuation per head of population) (table 2 and figure 1).13 There is more variation in the levels of poor relief measured both as the numbers on poor relief per 100 population14 or the level of spending per 100 population. Both measures are
12
The data reported here is drawn from a broader study of the poor law in nineteenth century Ireland. The year 1859 (rather than 1861) was chosen as this is the year in which the lowest (post famine) number of persons were on relief. See Mel Cousins, Poor relief in Ireland, 1851-1914, PhD thesis, Glasgow Caledonian University, 2010.
13
Although the wealth of the cities was at about the average for the whole of the country, there was significantly more variation in rural areas from the wealthy eastern farmlands to the very poor peripheral western unions.
14
reasonably closely correlated (0.68) although (for reasons which are unclear) Limerick had about average levels of persons on indoor relief but at a very low cost.
As can be seen in 1859, urban unions (except Londonderry) provided above the national average levels of relief and, excluding the northern cities, had above the national
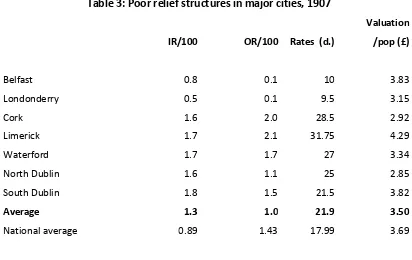
Table 3: Poor relief structures in major cities, 1907
IR/100 OR/100 Rates (d.)
Valuation
/pop (£)
Belfast 0.8 0.1 10 3.83
Londonderry 0.5 0.1 9.5 3.15
Cork 1.6 2.0 28.5 2.92
Limerick 1.7 2.1 31.75 4.29
Waterford 1.7 1.7 27 3.34
North Dublin 1.6 1.1 25 2.85
South Dublin 1.8 1.5 21.5 3.82
Average 1.3 1.0 21.9 3.50
National average 0.89 1.43 17.99 3.69
Source: Cousins, Poor relief in Ireland, table 2.5
By 1907, there is still a relatively small variation amongst the cities in terms of wealth. Most fall around the national average with only North Dublin and Cork noticeably below and only Limerick significantly above. In terms of poor relief, Londonderry and Belfast are now even more distinctive. With the exception of the introduction of a small level of outdoor relief, overall patterns of poor relief have changed hardly at all in Londonderry. While the level of indoor relief has increased slightly in Belfast, levels remain well below average and outdoor relief is marginal. In contrast, there has been an increase of about one-third in indoor relief in the southern cities and a significant shift towards outdoor relief. The north-south divide can also be seen in terms of rates with the southern cities having rates 2-3 times those of the northern cities.
relief patterns. We turn now to examine the occupational structures of the cities to see if they throw any light on these patterns.
Occupational structure, 186115
Table 4 gives the size of the relevant workforces and the proportion of both men and women with recorded occupations (as a percentage of the total population of that gender). Obviously we do not know the extent to which such persons were un or underemployed but it may not be unreasonable to assume that this data give some indication as to the relative employment rates in the cities concerned. As can be seen male employment was consistently about two-thirds of the total male population. Female employment varied more between cities but was rather high averaging close to 50% of the female population.16
Table 4: Workforce and gender employment rates, 1861
Total employed Male % Female %
Belfast 65015 65.5 43.3
Cork 40907 68.9 37.5
Dublin 141994 67.7 45.4
Limerick 26090 66.6 51.9
Waterford 12732 64.7 46.1
Average 66.7 44.8
15
There are some important changes in the way in which occupations were classified between 1861 and 1901. In particular, in 1861 there is a large group (particularly of women) whose employment was classified as ‘all others’. There is now no way of knowing how this group was employed (given the loos of Census manuscripts) and they are shown in the figure as ‘not known’. (Given the predominately female make-up one could speculate that, in the southern cities, this group is mainly services). This lumping together does not happen in 1901 where all persons are assigned to a specific occupational description. At the current stage of the analysis there are a number of smaller occupational descriptions which have not been coded. These amount to 5-8% of the workforce in 1861 and up to 10% in 1901. These are perhaps more likely to be small service jobs but are unlikely to change significantly the overall picture. There are also major differences in the classification of employments used in both years although the HISCO system hopefully allows a reasonably consistent classification (though, for example, some employments. such as prostitute, have disappeared entirely from the classification in 1901).
16
The second point to note is that there is a clear distinctions between Belfast (the only northern city for which we have data in 1861) which was highly industrialised (with 61% employed in industry and only 23% in services) and the more service oriented southern cities (Figure 2). Dublin city and suburbs,17 in particular, is dominated by services (44% to 36% for industry) although if we focus on the city area alone we get a slightly more industrialised picture. In the other southern cities, industry accounts for about 40-45% of employment compared to 30-32% in services. In should be noted that in the southern cities in particular, there is a marked difference between the composition of male and female employment (see below). In all cases male employment is mainly industrial. However, female employment is overwhelmingly in the service sector (and this does not take account of the large ‘all others’ category). If we take account of the large unknown (or as yet uncategorised) group,18 and the fact that this is predominantly female, the actual split in the southern cities is probably much closer to parity between the two sectors.
17
As noted, the Dublin suburbs are an integral part of the city and the separate classification owed more to political factors. However, also for political and financial reasons, the surburbs did not form part of the South Dublin Union. Data as to the occupational composition of the suburbs is only provided in the 1861 Census.
18
Occupational structure, 1901
[image:11.595.105.439.340.510.2]Turning to the picture in 1901, the male employment rate (as a percentage of the total population) has fallen slightly to just over 60%, see table 5). However, there has been a dramatic fall in the recorded level of female participation in the labour force from just under half in 1861 to less than one-third in 1901. In seems possible that this reflects both some actual decline in female participation and a change in the extent to which women were classified as having an occupation.19 Unlike in 1861, we can now see a difference in female employment rates between the southern (service) and northern (industrial) cities with recorded female employment in Belfast and Londonderry at 33% or over while all the southern cities have less than 30% employed.
Table 5: Workforce and gender employment rates, 1901
Total employed Male % Female %
Belfast 163739 62.8 33.2
Londonderry 19141 61.7 36.4
Cork 33773 62.4 28.4
Dublin 133402 63.2 29.9
Limerick 16735 60.6 28.9
Waterford 22080 57.4 26.8
Average 61.4 30.6
In terms of occupation structure, again we see a distinction between the northern industrial cities and the southern service capitals (Figure 3). Because of the differences in how occupations are recorded in the two Censuses the data are not fully comparable with 1861. However, the overall picture if reasonably clear. Industrial employment in Belfast and Londonderry is at 57-67% while services make up only 25-33% (with the remainder largely unclassified at present). In contrast, in the southern cities Dublin (excluding the suburbs) is the most industrialised at just over half of the working population and 42% in services.20 In the other southern cities, there is a roughly 50:50
19
See M.E. Daly, Women and work in Ireland, ESHSI, 1997, who shows that the number of women with an occupation (both as a percentage of all occupations and of women aged 15+) fell from 1881 on.
20
split (Limerick) or services account for more employment than does industry (Waterford).
Gender differences in employment structures
Similarly in 1901, half the male employment was in industry with a third in services while this pattern was reversed for women (figure 5).
While there has been considerable debate about the status of female occupational data in nineteenth century Britain21 and in twentieth century Ireland,22 rather little is known about such data in nineteenth century Ireland.23 While this initial survey suggests that there may indeed also be issues about the reliability of the Irish data in this period, it also emphasies the importance of using the data which do exist having regard to the fact that including female employment gives quite a different picture as to overall occupational structures.
21
For a review see L. Shaw-Taylor “Diverse experiences: the geography of adult female employment in England and the 1851 Census” in N. Goose, (ed.) Women's work in Industrial England: Regional and Local Perspectives Local Population Studies (2008) no. 80 (2007).
22
See T. Fahy ‘Measuring the female labour supply: conceptual and procedural problems in Irish official statistics’ Economic and Social review 21(2), 1990, 163-90.
23
Is there a link between occupational structure and poor relief?
One must say that a comparison of the occupational data found in this analysis and the structures of poor relief shown earlier provides (at best) limited evidence of any link between them. There is a clear (negative) relationship between the degree of industrialisation and the level of poor relief paid (see Figure 6) with a correlation of -0.72 and -0.89 between levels employed in industry and indoor and outdoor relief respectively (figure 6). However, it is unclear that there is a causal relationship. Perhaps it might be argued that industrial employment was more regular or better paid and that therefore the more industrial cities had less need of the poor law.24
24
Although previous research in the USA has suggested the opposite, i.e. that the growth of
The data shown in Table 5 also indicate that those cities with higher female employment rates are those which rely less of the poor law. However, the differences in employment rate are not very large and it would seem somewhat difficult to account for the
differences in relief expenditure on this basis. On the other hand, the greatest changes in poor relief have occurred in the southern cities which have seen both very limited population change and little apparent change in occupational structure. 25
A fundamental difficulty, in isolating the influence of occupational structures, is that we are comparing northern, industrial, Unionist/Protestant-controlled cities with southern, service-oriented, (and by 1901) Nationalist/Catholic-controlled cities so that it is likely that the influences of politics are inextricably intertwined with those of occupational structures.26 We do not, unfortunately have a northern service city nor a southern industrial city to act as a control. Indeed marked differences between northern and
25
There is also some indication that those cities with lower poor relief have lower percentages of unskilled workers (although more low skilled manual workers) than those with higher level of relief. However, this is subject to verification of the coding.
26
southern unions in terms of poor relief patterns can also be identified in looking at all Irish unions and over the period from 1851 to 1914.27
The occupational analysis has been carried out, however, at a very macro level and it would be interesting to look in more detail at the occupational structure and social class of those relying on poor relief. Such data have only been provided, to date, for the South Dublin Union in 1861.28 This has been classified (as part of this study) in
accordance with HISCO and HISCLASS. As can be seen (Figures 7 and 8), those relying on indoor relief were predominantly from service employment (46%) and predominantly low skilled manual workers (41%).
Source: Burke, The people and the poor law in nineteenth century Ireland.
27
M. Cousins, Poor relief in Ireland.
28
Source: As figure 8
Comparable data for Dublin city as a whole are set out in figures 9 and 10.29 As can be seen the service sector is the largest (as noted above the unknown and uncategorised groups are probably predominately service workers) and low skilled manual workers also make up the largest category of employment. Thus, and unsurprisingly, there appears to be a general link between those availing of poor relief and the overall occupational structure of Dublin city. However, this research would require to be verified further as to the classification of employment, broken down on a gender basis (and perhaps by specific employment), and extended to other unions. In addition, more detailed studies as to the policies of urban unions and the reasons why different unions may have taken different approaches related to differences in occupational structures is required.
29
Alternative explanations for variations in poor relief
Drawing on broader research, we can posit a number of reasons for the variations in poor relief. One of the more detailed comparative studies of the causes of different levels and structures of poor relief has been carried out by Lindert.30 He found that, in general, richer countries transferred a higher share of national income to the poor. However, he identified a very considerable fall in expenditure on the poor law as a percentage of national income after 1834 in England. He suggests that the reason for this fall may be that the newly enfranchised classes had stronger reasons to oppose tax-based relief than the elites who controlled Parliament at the start of the century. Research indicates that poor relief expenditure in nineteenth century Ireland was related to the wealth of a union (echoing Lindert’s findings at a national level).31 However, this link was not particularly strong in statistical terms and as we have seen here there is no clear relationship between the wealth of a city and its expenditure on poor relief. Demographic factors such as the proportion of older people in the
population and the percentage of the older population who never married also appear to have influenced the level of relief.32
Urban Ireland, as a whole, shows a somewhat different pattern to the national average with generally higher levels of relief although the urban unions are at or about the average in terms of wealth. However, to posit an urban Irish model would be somewhat misleading given the enormous differences between the northern and southern cities. Lindert found that the English poor law stood out sharply from Continental models in giving more relief in the countryside whereas Continental relief – which was generally organised more on a regional than national basis – favoured towns and cities. He identified an English urban pattern of (1) lower poor rates; (2) lower shares of the population on relief; (3) greater emphasis on indoor relief; and (4) frequent denial of relief to immigrants. If one looks at the data for Ireland (tables 2 and 3), only the northern cities followed this ‘English model’. The southern cities tended to have higher levels of relief than the average, although they generally granted more indoor than outdoor relief. Generally one does not see a distinctive Irish urban model and the cities are affected more by the region of which they form part. In the case of the cities of Belfast and Londonderry, it seems likely that an additional factor of concern about in-migration was at play. As has been seen above (table 1), these cities (especially Belfast) grew dramatically in the period covered and it is arguable that the guardians may have used control over poor relief as a means of discouraging undesired in-migration.33
30
P. Lindert, ‘Poor Relief before the Welfare State: Britain versus the Continent, 1780-1880’, European Review of Economic History, 1998, 101-140.
31
M. Cousins, Poor relief in Ireland, op. Cit.
32
Ibid., chapter 3.
33
One obvious possible explanation for the north-south variation is the differing religious composition of the cities. While all the southern cities were overwhelmingly Catholic,34 Belfast was predominantly Protestant and although a narrow majority of the
Londonderry union population was Catholic (53% in 1901),35 control of the urban local government was largely in the hands of the Protestant minority.36 While there is a surprising absence of work on the impact of religious divisions on poor relief, one can draw on work on the impact of racism in the United States on its welfare patterns.37 Alesina et al. suggest two reasons which – by analogy - might lead to lower poor relief in the north of Ireland.38 First, it is suggested that where there are strong religious
divisions in society, a condition which certainly applied in Ulster in the period, and the poor are disproportionately made up of one religious group (and again there is
considerable evidence that Catholics were, in general, poorer than Protestants)39 there will be opposition from rate payers to paying poor relief. An alternative (or
complementary) suggestion is that because of the religious differences, northern boards may have had a different ideological approach to payment of relief and may have adopted a more restrictive approach.40 Of course, these two arguments are not incompatible and it is possible that the differences in ideological approach might be strengthened by sectarianism.
In order to examine these issues, one might look at (i) whether the Belfast and Londonderry boards were, in fact, predominantly Protestant, (ii) whether Catholics received an equitable level of relief; and (iii) whether one can indentify sectarian views amongst the boards. Boards which were informed by a more restrictive approach to the
leave Belfast’ but without citing evidence in support of this view. The focus of his book is on a somewhat later period. See Devlin, Yes we have no bananas.
34
In 1861, 77% of the Dublin city population was Roman Catholic while for the other southern cities the percentage varied from 84 to 88%. In contrast only 34% of the Belfast population was Catholic. By 1901 the differences had widened. Between 82-92% of the population of the southern cities was Catholic while only 24% of the Belfast population was Catholic.
35
Census of Ireland, 1901. Part II. General report, 1902 [Cd. 1190], table 143.
36
For example, the Mayor of Londonderry and all three Londonderry union officers shown in the Belfast and Province of Ulster Directory 1900 were all of one of the Protestant denominations.
37
A. Alesina, E. Glaeser and B. Sacerdote, ‘Why Doesn't the United States Have a European-Style Welfare State?’, Brookings Papers on Economic Activity, 32, (2001), 187-278.
38
While the focus of the authors’ work is on the impact of racism, their approach is based on the impact of divisions in society and they explicitly acknowledge that ‘religious cleavages (for instance) may be more deeply felt that racial ones’ in other parts of the world (at 227).
39
See below.
40
granting of relief might be expected to provide a lower level of relief more generally while boards which were driven by sectarian considerations might be expected both to provide less relief and to provide relief disproportionately to Protestants.
While it is not possible, in the present state of knowledge, individually to establish the religious composition of boards pre-1901, it is perhaps safe to assume that Catholics were in a small minority in the northern boards. For example, in 1857, the Belfast Newsletter reported that only two of the 12 elected Belfast guardians were Catholics.41 By 1911, when one can establish the religion of officers from the Census, on the Belfast board only 2 of 40 identified guardians are Roman Catholics.
Turning to the composition of those relieved, a special return in 1861 gives the religious breakdown of those in workhouses. Overall, 47 per cent of those relieved In Belfast were Catholics which is significantly above the percentage of Catholics in the city’s population in 1861 (34 per cent).42 However, given the greater poverty of Catholics one would expect that Catholics would make up a greater proportion of those relieved than their share of the overall population.
Data as to the religious composition of individual workhouses do not appear to be published for 1901 but can now be calculated from the Census manuscripts published on-line by the National Archives of Ireland.43 In Belfast workhouse we find that 49% of the inmates are Roman Catholic compared to only 24% of the population in the union itself. Hepburn shows that Catholics in Belfast in 1901 lived in poorer housing, had higher levels of illiteracy and were overrepresented amongst low-skilled employment. Hepburn also shows that there was extensive discrimination against Catholics in the allocation of employment in nineteenth and twentieth-century Belfast. However, while it must be recalled that the level of relief in Belfast was comparatively low, amongst those who did get relief there is no sign of discrimination against Catholics. In
Londonderry, the Census manuscripts indicate that 59% of those in the workhouse were Roman Catholic compared to the 53% which Catholics represented in the union
population. It may be assumed that Catholics in Londonderry were also poorer and the data would suggest that poor Catholics may have found it more difficult to obtain relief in Londonderry than their Protestant counterparts.
The literature on sectarianism and discrimination in Ulster is lengthy and it would be surprising if the pervading sectarianism did not also permeate the boards of guardians.44
41
Belfast Newsletter, 27 October 1857.
42
In Londonderry, 74% of those in the workhouse in 1861 were Catholics In the county as a whole, 45% were Roman Catholics which would suggest that Catholics were not underrepresented amongst those receiving poor relief.
43
http://www.census.nationalarchives.ie/
44
As boards would not have been allowed to discriminate on religious grounds in the provision of relief, it is unsurprising that there is not much direct evidence of explicitly sectarian policies, e.g. boards would not have been allowed explicitly to exclude Catholics from relief. However, the sectarian tensions in the wider Ulster society are also to be seen in abundance in the operation of the boards.45
It is not argued that the difference between the patterns of urban boards north and south can be explained solely by religious factors. However, it is suggested that an important contributory factor to those differences, albeit one which is impossible to quantify precisely, is (i) an ethos in the northern boards which was conducive to the granting of lower levels of relief and to more emphasis on self-sufficiency; (ii) the sectarian tensions which ran throughout Ulster society and which arguably informed the ethos of self-sufficiency, and (iii) in the case of the two large cities, and perhaps smaller urban centres, a desire not to attract unwanted in-migration.
Conclusion
The research to date is perhaps more interesting for what it tells us about the
occupational structure of nineteenth century Irish cities than for any clear link between that structure and patters of poor relief. While there are some links between
occupational structures and poor relief (in particular cities with high levels of industrialisation and higher female employment had lower level of poor relief), this relationship is interrelated with the broader distinction between the industrial northern cities of Belfast and Londonderry (with their distinctive political and religious structures) and the southern service-oriented cities. In addition, other factors such as the negative relationship between population and employment growth and poor relief are somewhat counter-intuitive. However it seems unlikely that occupational structures (such as levels of female employment) had no impact on poor relief expenditures and further research is required. This might complete the classification of the cities by social class; look further at the occupational composition of those relieved; and examine the records of the various institutions for local policies on poor relief for specific groups.
History, xxv, 1 (1994), 1-21. For studies which deal more closely with poverty and the poor law see C. Kinealy and G. MacAtasney, Hidden Famine: Hunger, Poverty and Sectarianism in Belfast, 1840-1850, Pluto, London, 2000; A. Jordan, Who Cared?: Charity In Victorian And Edwardian Belfast, IIS, 1993; P. Devlin, Yes we have no bananas: Outdoor Relief in Belfast, 1920-39, Blackstaff Press, Belfast, 1981.
45
References
A. Alesina, E. Glaeser and B. Sacerdote, ‘Why Doesn't the United States Have a
European-Style Welfare State?’, Brookings Papers on Economic Activity, 32, (2001), 187-278
J. Bourke, From husbandry to housewifery, Oxford, 1993
I. Budge and C O’Leary, Belfast: Approach to Crisis – a Study of Belfast Politics, 1613-1970, Macmillan, London, 1973
H. Burke The people and the poor law in nineteenth century Ireland, WEB, 1987 L.A. Clarkson et al., Occupations of Ireland 1841, QUB, 1995.
M. Cohen, ‘Religion and Inequality in Ireland’, Journal of Interdisciplinary History, xxv, 1 (1994), 1-21
M. Cousins, Poor relief in Ireland, 1851-1914, PhD thesis, Glasgow Caledonian University, 2010.
M.E. Daly, Women and work in Ireland, ESHSI, 1997
P. Durnin ‘Aspects of poor law administration and the workhouse in Derry 1838-1948’ in G. O’Brien Derry and Londonderry: history and society, Geography Press, 1991
P. Durnin, Derry and the Irish Poor Law: a history of the Derry workhouse, Waterside Community Local History Group, 1991
T. Fahy ‘Measuring the female labour supply: conceptual and procedural problems in Irish official statistics’ Economic and Social review 21(2), 1990, 163-90
M. Farrell The Poor Law and the workhouse in Belfast 1838-1948, PRONI, 1978 P. Gibbon, The Origins of Ulster Unionism, Manchester University Press, Manchester, 1975
T. Guinnane, The Vanishing Irish: Households, Migration and the Rural Economy in Ireland, 1850–1914, Princeton University Press, 1997
A.C. Hepburn, A Past Apart: Studies in the history of Catholic Belfast 1850-1950, Ulster Historical Foundation, 1996
A. Jackson, ‘Unionist Politics and Protestant Society in Edwardian Ireland’, Historical Journal, 33(4), (1990), 839-866
A. Jordan, Who Cared?: Charity In Victorian And Edwardian Belfast, IIS, 1993 S. Kahl, ‘The Religious Roots of Modern Poverty Policy: Catholic, Lutheran, and
Reformed Protestant Traditions Compared’, Archives Européennes de Sociologie, xlvi(1), (2005), 91-126
T.P. O’Neill, ‘The Catholic Church and Relief of the Poor, 1815-45’, Archivium Hibernicum, 31, (1973,) 132-45
L. Shaw-Taylor “Diverse experiences: the geography of adult female employment in England and the 1851 Census” in N. Goose, (ed.) Women's work in Industrial England: Regional and Local Perspectives Local Population Studies (2008) no. 80 (2007)
G. Steinmetz, ‘The local welfare state: two strategies for social domination in urban Imperial Germany’ American Sociological Review, 1990, 55, 891-911
J. Underhill Hannon ‘Poverty in the Antebellum Northeast: the view from New York State’s poor relief rolls’ Journal of Economic History, 1984, xliv, 4, 1007-32
M. H.D. van Leeuwen, Ineke Maas and Andrew Miles, HISCO: Historical International Standard Classification of Occupations. Leuven University Press 2002;
M. H.D. van Leeuwen, Ineke Maas and Andrew Miles, “Creating a Historical International Standard Classification of Occupations” Historical Methods, Fall 2004, Volume 37, Number 4.