Munich Personal RePEc Archive
Hedging vs. speculative pressures on
commodity futures returns
Cifarelli, Giulio and Paladino, Giovanna
Dipartimento di Scienze Economiche, Università degli Studi di
Firenze, Economics Department LUISS University of Rome
10 January 2011
Online at
https://mpra.ub.uni-muenchen.de/28229/
H e dgin g vs. Spe cu la t ive Pr e ssu r e s on Com m odit y Fu t u r e s Re t u r n s
Giulio Cifar elli* and Giovanna Paladino°
Abst r a ct
This st udy int roduces a non linear m odel for com m odit y fut ures prices
w hich account s for pressures due t o hedging and speculat ive act ivit ies.
The linkage w it h t he corresponding spot m arket is considered assum ing
t hat a long t erm equilibr ium r elat ionship holds bet ween fut ur es and spot
pricing. Over t he 1990- 2010 t im e period, a dynam ic int eract ion bet w een
spot and fut ures ret urns in five com m odit y m arket s ( copper, cot t on, oil,
silver, and soybeans) is em pirically validat ed. An error correct ion
relat ionship for t he cash ret urns and a non linear param et erizat ion of t he
corresponding fut ures ret urns are com bined w it h a bivariat e CCC- GARCH
represent at ion of t he condit ional variances.
Hedgers and speculat ors are cont em poraneously at w ork in t he fut ures
m arket s, t he role of t he lat t er being far from negligible. I n order t o
capt ure t he consequences of t he grow ing im pact of financial flow s on
com m odit y m arket pr icing, a t w o- st at e regim e sw it ching m odel for fut ures
ret urns is developed. The em pirical findings indicat e t hat hedging and
speculat ive behavior change across t he t w o regim es, which w e associat e
w it h low and high ret urn volat ilit y, according t o a dist inct ive pat t ern,
which is not hom ogeneous acr oss com m odit ies
Ke yw or ds: Com m odit y spot and fut ures m arket s, dynam ic hedging, speculat ion, non linear GARCH, Mar kov regim e sw it ching.
JEL Cla ssifica t ion G1 3 , G1 5 , Q4 7
* Universit y of Florence. Dipart im ent o di Scienze Econom iche, via delle Pandet t e 9, 50127, Florence I t aly; [email protected]
I n t r odu ct ion
This paper focuses on t he t w o m ain act ivit ies associat ed w it h fut ur es
t rading: hedging and speculat ion. They do not have t o be considered as
referring t o t w o separat e agent s. I t m ay w ell be t hat t ypical hedgers, such
as com m ercial firm s, t ake a view on t he m arket ( speculat e on price
direct ion) . Alt ernat ively, speculat ors can find it profit able t o engage in
hedging act ivit ies ( see St ulz, 1996, and I r w in et al., 2009) . Consequent ly
it could be m isleading t o consider hedgers as pure risk–averse agent s and
speculat or s as risk- seekers. The fut ures’ dem and funct ions used in t his
paper w ill avoid t his sim plist ic divide.
Fut ures t rading involves an exchange bet w een people w it h opposit e view s
of t he m arket ( as t o t he fut ure behavior of prices) and/ or a different
degree of risk aversion. I t allow s t o shift t he risk from a part y t hat desires
less risk t o a part y t hat is willing t o accept it in exchange for an expect ed
profit .1
Speculat ion is essent ial for t he sm oot h funct ioning of com m odit y m ar ket s
as it assures liquidit y and assum es t he risks laid off by hedgers.
Speculat or s, m ainly non com m ercial firm s or privat e invest or s, are ready
t o t ake up risks in order t o earn profit s st em m ing from expect ed price
changes. No physical delivery is involved in t his fut ures t rade and
speculat ion does not int ervene direct ly in t he cash m arket .
The lit erat ure on com m odit y m arket speculat ion has follow ed t w o m ain
st rands. A direct approach based on an at t em pt t o m icro m odel
sim ult aneously speculat ive and hedging behavior and an indirect
approach, which analyzes t he excess co- m ovem ent of com m odit y pr ices
and ascribes t his evidence t o 'herding' behavior. I n addit ion som e recent
st udies have t ried t o exploit t he inform at ion on t he com m it m ent s of
t raders.
I n an im port ant paper Johnson ( 1960) suggest s t hat hedging and
speculat ion in fut ures m arket s are int errelat ed. Speculat ion is m ainly
at t ribut ed t o t raders’ expect at ions on fut ure price changes t hat bring
1
about an increase/ decrease of t he opt im al hedging rat io in a short
hedging cont ext . Ward and Flet cher ( 1971) generalize Johnson’s approach
t o bot h long and short hedging and find t hat speculat ion is associat ed w it h
opt im al fut ures posit ions ( short or long) t hat are in excess of t he 100
percent hedging level.
A different st rand of analysis on speculat ion in t he com m odit y m ar ket s
focuses on t he presence of excess ( w it h r espect t o a com ponent explained
by fundam ent als) co- m ovem ent of ret urns of unrelat ed com m odit ies
( Pyndick and Rot em berg, 1990) . Subsequent research - see am ong ot hers
Cashin et al. ( 1999) , Ai et al. ( 2006) , and Lescaroux ( 2009) - challenged
t he excess co- m ovem ent hypot hesis on bot h em pirical and m et hodological
grounds. The overall result s are m ixed and could indeed depend on t he
select ion of t he est im at ion t echniques and/ or of t he inform at ion set ( Le
Pen and Sévi, 2010) .
I n recent years t he availabilit y of dat a on t he Com m it m ent s of Traders
Report s, provided by t he Com m odit y Fut ures Trading Com m ission, has
generat ed a body of papers t hat t ry t o assess t he im pact of speculat ion on
com m odit y prices, m easuring speculat ive posit ions in t erm s open int er est .
The w eekly open int erest of each com m odit y is broken dow n, according t o
t he purposes of t raders, in long and short report ing com m ercial hedging,
long and short speculat ion by report ing non com m ercial firm s, and
posit ions of non report ing t raders. The em pirical result s, however, are
m ixed ( Fagan and Gencay, 2008) .
I n t he sixt ies opt im al hedging behavior w as ident ified by St ein ( 1961) and
McKinnon ( 1967) . They associat ed it w it h t he m inim izat ion of t he variance
of t he ret urn of t he port folio of an hedger, const ruct ed w it h cash and
fut ures cont ract s. This approach allow s t o com put e an opt im al cover rat io
β
( t he Minim um Variance Hedge rat io or MVH) , defined as t he percent ageof cash cont ract s m at ched by fut ures posit ions t hat m inim izes t he
variance of t he hedged port folio. I t owes it s popularit y t o it s sim plicit y,
since
β
- given by t he rat io bet w een t he covariance of cash and fut uresret urns and t he variance of fut ures ret urns - can be easily est im at ed.
The MVH st rat egy focuses on t he variance of t he hedged port folio and
include st rat egies based on hedged port folio ret urn m ean and variance
expect ed ut ilit y m axim izat ion2 ( Cecchet t i et al., 1988, Lence, 1995) ,
m inim izat ion of t he ext ended m ean- Gini coefficient ( Kolb and Okunev,
1992) , or based on t he Gener alised Sem ivar iance ( GSV) ( Lien and Tse,
2000) . I t has been show n, how ever, t hat if fut ures prices are m art ingale
processes and if t he spot and fut ures ret urns are j oint ly norm al t hen t he
opt im al hedge rat io will converge t o t he rat io obt ained wit h t he MVH
st rat egy. Subsequent im provem ent s see t he im plem ent at ion of new
est im at ion t echniques, w hich account for t he non st at ionarit y and t he
het eroskedast icit y of t he t im e series.
Given t he st ochast ic nat ure of fut ures and spot prices, t he hedge rat io is
unlikely t o be const ant . St at ic OLS hedge rat io est im at ion recognizes t hat
t he correlat ion bet w een t he fut ures and spot prices is less t han perfect
( Ederingt on, 1979, Figlew ski, 1984) , but im poses t he rest rict ion of a
const ant correlat ion bet w een spot and fut ures price rat es of change. As
such it could lead t o sub- opt im al hedging decisions in periods of high basis
volat ilit y and/ or t o inefficient revisions of t he hedge rat io.
A large body of lit erat ure has arisen t o cope w it h t he dynam ics of t he j oint
dist ribut ion of t he ret urns and w it h t he t im e- varying nat ure of t he opt im al
hedge rat io, using t he grow ing fam ily of GARCH m odels. These st udies
suggest t hat opt im al hedge rat ios are t im e dependent and t hat dynam ic
hedging reduces in- sam ple port folio variance subst ant ially m ore t han
st at ic hedging.3 They are based on t he est im at ion of bivariat e condit ional
variance m odels of varying com plexit y ( see, am ong ot hers, t he sem inal
w orks of Baillie and Myer s, 1991, and of Kroner and Sult an, 1993, Chan
and Young, 2006, w ho incor porat e a j um p com ponent in a bivariat e
GARCH, and Lee and Yoder, 2007, w ho im plem ent a Markov sw it ching
GARCH) . The param et er izat ion of t he condit ional m eans reflect s t he
st andard charact erist ics of financial t im e series. I ndeed, since t he
logarit hm s of t he fut ures and cash prices are non st at ionary and usually
2 The MVH is not only com pat ible w it h a quadrat ic ut ilit y funct ion but , as show n by
Benninga et al. ( 1983) , under cert ain condit ions, it is consist ent wit h expect ed ut ilit y m axim izat ion, a result t hat does not depend upon t he nat ure of t he ut ilit y funct ion.
3 Ot hers, however, considering t he t rade off bet ween t he benefit s of a dynam ic hedge and
coint egrat ed, t he condit ional m ean ret urn relat ionships have t o be
m odelled as bivariat e VECMs. Their rich dynam ic propert ies – t ypically
disregarded in t he lit erat ure – are carefully invest igat ed in t his paper and
given an econom ic int erpret at ion w it h t he help of a plausible m odel of
short - run hedger and speculat or react ion t o expect ed ret urns and
volat ilit y shift s. The em pir ical findings seem t o cor roborat e our a pr iori
hypot heses and provide innovat ive insight s on t he im pact on fut ures
pricing of t he int eract ion bet w een hedging and speculat ion across volat ilit y
regim es. We bridge in t his w ay t he usual dichot om y bet w een t he grow ing
sophist icat ion of t he est im at ion procedures and t he rat her sim plist ic
int erpr et at ion of t he result s in t erm s of efficiency of t he MVH paradigm ,
crit icized by Alexander and Barbosa ( 2007) .
I n m ore det ail, t his paper cont ribut es t o t he current debat e as follow s.
a. Using a com plex non linear CCC- GARCH approach w e m odel
explicit ly t he react ion of hedgers and speculat ors t o volat ilit y shift s
in t he com m odit y m arket s. I n t his w ay t he lit erat ure is ext ended by
adding a dynam ic com ponent t o t he st andard t w o- st ep opt im al
hedge rat io com put at ion.
b. A t w o- st at e Markov sw it ching procedure is used t o m odel t he
im pact of changes in t he behavior of com m odit y m arket s, changes
due t o bullish/ bearish react ions t o fut ures price changes and/ or t o
shift s in risk aversion brought about by ret urn volat ilit y changes.
We ident ify in t his w ay a financial pat t ern t hat seem s t o play a
growing role in recent com m odit y m arket pricing.
c. We m odel and assess em pirically t he relat ive im pact of speculat ive
vs. hedging drivers on fut ures pricing, and invest igat e w het her
periods of high fut ures ret urn volat ilit y are t o be associat ed w it h a
m ore int ense speculat ive act ivit y.
Follow ing a discussion of t he proper t ies of a dynam ic m odel of hedging
and speculat ion ( sect ion 1) , t he paper out lines t he m ain feat ures of t he
non linear m ult ivariat e CCC- GARCH t hat shall be used in t he em pirical
invest igat ion ( sect ion 2) , set s fort h t he est im at es for five m ain com m odit y
m arket s ( sect ion 3) , and present s a Markov sw it ching fram ew ork in w hich
( sect ion 5) discusses som e fut ure ext ensions of t he regim e swit ching
invest igat ion.
1 A dyn a m ic m ode l of h e dgin g a n d spe cu la t ion
Com m odit y fut ures t rading is analyzed in t his sect ion, focusing on hedging
and speculat ive behavior. A hedging t ransact ion is int ended t o reduce t he
risk of unwant ed fut ure cash price changes t o an accept able level. Spot
m arket t rades are associat ed w it h t rades of t he opposit e sign in t he
corresponding fut ur es m arket . I f t he cur rent cash and fut ures pr ices ar e
posit ively correlat ed, t he financial loss in one m arket will be com pensat ed
by t he earnings obt ained from holding t he opposit e posit ion in t he ot her
m arket .
I n m ore det ail, let ti
i t i
t
c C c
r, =Δlog =Δ and ti
i t i
t
f F f
r , =Δlog =Δ , w here
C
ti ist he cash ( spot ) price of com m odit y i and
F
ti is t he price of t hecorresponding fut ur es cont ract . An invest or w ho t akes a long ( shor t )
posit ion of one unit in t he cash m arket i will hedge by t aking a short
( long) posit ion of
β
unit s in t he corresponding fut ur es m arket , which hew ill buy ( sell) back w hen he sells ( buys) t he cash. The hedge r at io
β
canbe seen as t he proport ion of t he long ( short ) cash posit ion t hat is cover ed
by fut ures sales ( purchases) .4
The revenue of t his hedging posit ion ( or port folio) , i.e. t he hedger’s ret urn
i t H
r , , is given by
i t f i
t c i
t
H
r
r
r
,=
,−
β
, ( 1)The variance of t his port folio is given by
t r r t r t r t
r t
r t
rHi ci fi ci, fi, ci fi, 2
, 2 2
, 2
,
σ
β
σ
2
βσ
σ
ρ
σ
=
+
−
( 2)4 The hedge rat io is also defined as t he rat io bet ween t he num ber of fut ures and cash
w here 2 ,t rci
σ
is t he var iance ofr
ci,t, 2 ,t rifσ
is t he var iance ofr
fi,t, and rri t f i c ,ρ
ist he correlat ion bet w een
r
ci,t andr
fi,t.The opt im um hedge rat io
β
*
is derived from t he first order condit ion oft he hedging port folio variance m inim izat ion and reads as ( from now on w e
drop t he superscript
i
) :2 , , , ,
*
t r t r r t r t r f f c f cσ
ρ
σ
σ
β
=
( 3)The opt im um hedge rat io depends upon bot h t he covariance bet w een t he
changes in fut ures and cash prices, r r t r t r t r r t
f c f c f
c ,
σ
,σ
,ρ
,σ
=
, andt he variance of t he fut ures price changes.
I n order t o analyze t he react ion of hedgers t o shift s in com m odit y ret urns,
w e ext end t he st andard hedging m odel by int roducing a dynam ic
com ponent .
We assum e t hat t he expect ed ut ilit y of hedger s is an inver se funct ion of
t he expect ed variabilit y of t heir opt im ally hedged posit ion. The variance of
t his posit ion ( or por t folio) can be defined, replacing in equat ion ( 2) t he
opt im al hedge rat io
β
*
by it s det erm inant s set out in equat ion ( 3) , as
)
1
(
)
(
2 , 2 , 2 2 2 , 2 , , , t r r t r r r r t r tr c c f
t f t f c c
H
σ
σ
ρ
σ
σ
σ
=
−
=
−
( 4)w here t r t r t r r t r r c f f c f c , , ,
,
σ
σ
σ
ρ
=
The dem and of fut ures cont ract s of an hedger w ishing t o m inim ize t he
variance of his opt im al port folio is defined as
)
1
(
2 , 2 ,0 r t rr t H
H
t
a
b
c cfAn increase in t he m inim um port folio variance m ay be due t o a rise in t he
variabilit y of cash pr ice changes and/ or t o a decrease in t he correlat ion
bet w een cash and fut ures price changes. We can t hus reasonably assum e
t hat
b
His posit ive if consum er s’ hedging is prevailing since consum er s,concerned about cash price incr eases, w ill dem and m ore fut ures cont ract s
w henever t he port folio variance increases. Conver sely,
b
H w ill be negat iveif producers’ hedging is prevailing, since producers, w orried about possible
cash price decreases, will supply m ore ( i.e. dem and less) cont ract s if t he
variabilit y of t heir hedged posit ion rises.
The dem and for fut ures cont ract s of a speculat or is defined as
2 , ,
1
0 r t S t f t S S
t
c
d
E
r
e
fD
=
+
−−
σ
( 6)S
d
is alw ays posit ive because of t he posit ive im pact on speculat ion of anincrease in expect ed fut ures ret urns, whereas
e
S can be eit her posit ive ornegat ive, according t o t he react ion of speculat ors t o risk. We assum e t hat
0
<
S
e
for risk lover ande
S>
0
for risk aver se agent s.I t is generally accept ed t hat fut ures t rading is a zero sum gam e. As
point ed out by Hieronym us ( 1977) , am ong ot hers, “ for everyone w ho
t hinks t he price is going up t her e is som eone w ho t hinks it is going dow n,
and for everyone w ho t rades w it h t he flow of t he m arket , t here is
som eone t rading against it “ ( pg 302) . Thus w e can assum e t hat t he net
dem ands of bot h agent s are balanced on a daily basis or, equivalent ly,
t hat t he dem ands of hedgers and speculat ors add up t o 1
1
=
+
St H
t
D
D
( 7)Subst it ut ing equat ions ( 5) and ( 6) in equat ion ( 7) and readj ust ing t erm s,
w e obt ain t he follow ing expression for t he expect ed fut ures ret urn
)
)
1
(
1
(
1
2, 2
, 2
, 0
0 ,
1 r t
S t r r t
r H S
t f
t
a
c
b
c c fe
fd
r
E
−=
−
−
−
σ
−
ρ
+
σ
Since
r
f,t=
E
t−1r
f,t+
u
rf,t, we obt ain t he follow ing t est able short runrelat ionship
t r t r S S t
r r t
r S H t
f
e
b
d
c c fe
d
fu
fr
,=
0−
(
/
)
σ
2,(
1
−
ρ
2 ,)
+
(
/
)
σ
2 ,+
, ( 8)w here
e
0=
(
1
−
a
0−
c
0)
/
d
S. Equat ion ( 8) relat es fut ures ret urns t o t heirow n volat ilit y and t o t he variabilit y of t he opt im ally hedged port folio. The
short run dynam ics of t his r elat ionship is in line w it h t he st ylized fact s
det ect ed in t he paper by Fagan and Gencay ( 2008) , w here t he negat ive
correlat ion bet ween fut ures ret urns and hedger net long posit ions
support s t he idea t hat large speculat ors are net buyers in rising m arket s,
w hile large hedgers are net sellers. This behavior is encom passed by our
( m ore general) m odel, w hen it cont em plat es t he case of hedgers being
net sellers - w hen
b
His negat ive - and fut ures ret urns going up.2 A biva r ia t e n on lin e a r CCC- GARCH r e pr e se n t a t ion
We focus on fut ures prices since com m odit y prices are t ypically discovered
in fut ures m arket s and price changes are passed from fut ures t o cash
m arket s ( Garbade and Silber, 1983) . I ndeed, t rading is quicker and
cheaper in t he fut ures t han in t he cash m arket s. Econom ic t heory,
how ever, suggest s t hat t he prices of t he cash asset s and of t he
corresponding fut ur es cont ract s ar e j oint ly det er m ined ( St ein, 1961) . Our
em pirical est im at ion t hus includes a relat ionship t hat describes t he
behavior of cash r et urns, along a fut ures ret ur ns relat ionship, and
analyzes t he covariance bet w een t hese t w o variables. Over t he longer
t erm , equilibrium prices are ult im at ely det erm ined in t he cash m arket as
all com m odit y fut ures prices at delivery dat e converge t o t he cash price
( plus or m inus a const ant ) . This behavior j ust ifies t he exist ence of a
coint egrat ion relat ionship bet w een fut ures and cash prices and t he use of
an error correct ion param et erizat ion of t he condit ional m ean equat ion for
t c
w it h t he adopt ed fram ew ork of price discovery.5 I n t he long run t he
relat ion bet ween cash and fut ures prices holds and account s for t he
presence of an ident ified basis or convenience yield.
A non linear bivariat e GARCH m odel for fut ures and spot r et urns is t hus
est im at ed. The condit ional m ean of t he fut ures ret urns is m odeled by
equat ion ( 8) , w hile t he condit ional m ean of t he cash ret urns, equat ion ( 9) ,
is param et erized by an aut oregressive error correct ion st ruct ure and t he
condit ional second m om ent s are quant ified by a bivariat e
CCC-GARCH( 1,1) .
)
8
(
)
/
(
)
/
)(
/
(
)
9
(
)
(
, 2 , 2 , 2 , 2 , 0 , , 1 1 0 1 1 1 , 1 , 0 , t r t r S S t r t r r t r S H t f t r t t m k k t f k n j j t c j t c f f f f c c cu
h
d
e
h
h
h
d
b
e
r
u
c
d
d
f
r
b
r
a
a
r
+
+
−
−
=
+
−
−
+
+
+
=
− − = − = −∑
∑
ε
(
0
,
)
1 , , t t t t r t r t
H
N
u
u
u
u
f c −Ω
⎥
⎥
⎦
⎤
⎢
⎢
⎣
⎡
=
3 Th e e m pir ica l be h a vior of five com m odit y m a r k e t s
Our daily dat a span t he 3 January 1990 - 26 January 2010 t im e period. All
t he cont ract s are t raded on t he NYMEX ( New York Mercant ile Exchange)
and are t aken from Dat ast ream . Bot h spot (
C
t) and fut ures prices (F
t)are expressed in US dollars. Fut ures prices correspond t o t he highly liquid
5 On t his point see Figuerola- Ferret t i and Gonzalo ( 2010) . They successfully apply a VECM
approach t o cash and fut ures com m odit y ret urns where cash prices adj ust t o fut ures prices, in line wit h t he Garbade and Silver ( 1983) fram ework of price discovery.
1 m ont h ( nearest t o deliver y) fut ures cont ract .6 Ret urns are com put ed as
first differences of t he logarit hm s of t he price levels. The m odel is t est ed
for 5 com m odit ies belonging t o different com m odit y sect or s: cot t on
( indust rial m at erials) , copper ( indust r ial m et als) , crude oil ( energy) , silver
( precious m et als) , and soybeans ( grains) .
Sum m ary st at ist ics of cash and fut ures ret urns are present ed in Table 1.
< I NSERT TABLE 1 ABOUT HERE >
Average daily ret urns are sm all but not negligible, higher for oil and low er
for soybeans, a pat t ern t hat holds also for t he daily st andard deviat ions.7
The dist ribut ions of bot h cash and fut ures ret ur ns are alw ays m ildly
skewed and significant ly lept okurt ic, t he depart ure from norm alit y being
confirm ed by t he size of t he corresponding Jarque Bera ( JB) t est st at ist ics.
Volat ilit y clust ering is det ect ed in all cases a finding which support s t he
choice of a GARCH param et erizat ion of t he condit ional second m om ent s.
Tables 2 and 3 present parsim onious est im at es of t he condit ional m ean
equat ions of t he bivariat e non linear CCC- GARCH( 1,1) syst em set fort h in
sect ion 2 for 5 com m odit ies. The overall qualit y of fit is sat isfact ory.8 The
est im at ed param et ers are significant ly different from zero and t he
condit ional het er oskedast icit y of t he residuals has been capt ur ed by our
GARCH param et erizat ion.9 The usual m isspecificat ion t est s suggest t hat
t he st andardized residuals
ν
t are always w ell behaved; for each syst em0
]
[
t=
E
ν
,E
[
ν
t2]
=
1
, andν
t2 is serially uncorrelat ed.< I NSERT TABLES 2 and 3 ABOUT HERE >
Keeping in m ind t hat
d
S is posit ive by const ruct ion and t hat t he sign oft he coefficient rat ios
b
Hd
S ande
Sd
S will depend upon t he sign ofb
Hand
e
S, t he fut ures r et urn m ean equat ion ( 8) provides t he follow inguseful inform at ion on t he m arket drivers. ( i) Coefficient
b
Hest im at es ar e6 The fut ures cont ract expires on t he 3r d business day prior t o t he 25t h calendar day of t he
m ont h preceding t he delivery m ont h. I f t he 25t h calendar day of t he m ont h is a non-business day , t rading ceases on t he t hird non-business day prior t o t he non-business day pr eceding t he 25t h calendar day.
7 The logarit hm s of t he prices of t he cash and fut ur es cont ract s are always I ( 1) and t heir
first differences I ( 0) . The t est st at ist ics are not repor t ed for lack of space.
8 The corresponding condit ional variance equat ions are properly specified. Their param et er
coefficient s, always significant , are of t he appr opriat e sign and size. They are not report ed here for lack of space and are available from t he aut hors upon request .
negat ive in t he case of cot t on, copper and soybeans - reflect ing t he
predom inance of producers on t he m arket s - and posit ive for t he
rem aining com m odit ies of t he sam ple ( oil and silver) , because of t he
preponderance of consum ers. This result is also in line wit h t he effect s of
hedging pressure, w here fut ures prices increase w hen hedgers t rade short
and decrease w hen hedgers are long.10
( ii) The absolut e value of t he rat io bet w een speculat ive and hedging
fact ors S r2 ,t
/
H r2,t(
1
r2r ,t)
f c c
f
b
e
σ
σ
−
ρ
set fort h in Table 4 m easures t herelat ive im pact of different sources of risk on fut ures r et urns using a
“ level of im port ance” crit erion.11 I t is higher t han 1 for t he oil and
soybeans m arket s, where speculat ors seem t o be m ore react ive t han
hedgers.
( iii) Speculat or s are risk aver se ( since t he corr esponding
e
Scoefficientest im at es are posit ive) in t he oil and silver m arket s only, a finding t hat
m ay be due t o t he size of t he volat ilit y shocks. This issue shall be furt her
invest igat ed in t he next sect ion as it could be affect ed by fut ures pricing
regim e shift s.
< I NSERT TABLE 4 ABOUT HERE >
The dynam ic specificat ion of our m odel m ight int r oduce dist ort ive effect s,
in t he est im at ion of t he opt im al hedge rat io
β
, t hat reduce it seffect iveness. We have t hus perfor m ed t he st andard com parison of it s
hedging perform ance w it h t he perform ance of a naïve port folio hedge rat io
(
β
=
1
) and of an OLS hedge rat io, obt ained as t he fut ures ret urncoefficient est im at e in a regression of cash ret urns on a const ant and on
fut ures ret urns. An art ificial daily port folio is int roduced w here an invest or
is assum ed t o buy ( sell) one unit of t he cash asset and t o sell ( buy)
β
unit s of t he cor responding fut ures cont r act . The uncondit ional por t folio
ret urn st andard deviat ions are com put ed over t he w hole sam ple and ar e
set fort h in Table 5 for t he t hree hedge rat io est im at ors. The naïve hedge
port folios are clearly out perform ed by t he opt im al hedge port folios, a
finding t hat differs from t he result s obt ained by Alexander and Barbosa
( 2007) . Com m odit y m arket s, in spit e of t heir grow ing financializat ion,
10 See Chang ( 1985) and Bessem binder ( 1992) .
cannot com pare, in t erm s of efficiency, wit h t he m aj or st ock m arket s and
opt im al hedging rem ains an effect ive risk reduct ion t echnique. Our
CCC-GARCH m odel provides t he m inim um risk hedge in t hree out of five
m arket s, a finding t hat cor roborat es t he validit y of it s param et erizat ion.
Only in t he case of cot t on and soybeans, am ong t he less volat ile m arket s
of t he sam ple, does t he OLS opt im al hedge provide t he best result s.12
< I NSERT TABLE 5 ABOUT HERE >
4 H e dgin g, spe cu la t ion , a n d fu t u r e s pr icin g r e gim e sh ift s
Sarno and Valent e ( 2000) and Alizadeh and Nom ikos ( 2004) analyzed t he
changes in t he relat ionship bet w een fut ur es and spot st ock index ret urns
using a Markov sw it ching m odel set out originally by Ham ilt on ( 1994) .
This t echnique is used here in order t o analyze t he shift s over t w o r egim es
in hedging and speculat ive behavior.
Using t he full sam ple est im at es of t he condit ional second m om ent s
obt ained in t he previous sect ion, equat ion ( 8) is adapt ed in a second st ep
t o a t w o- st at e Markov sw it ching fram ework in which t he dr iver s of fut ures
ret urns ar e assum ed t o swit ch bet ween t w o different processes, dict at ed
by t he st at e of t he m arket .
Equat ion ( 8) is t hus r ew rit t en as
t s r t r S s S s t r t r r t r S s H s s t
f
e
tb
td
th
ch
c fh
fe
td
th
fu
f tr
,=
0−
(
/
)(
2,−
2 ,/
2,)
+
(
/
)
2,+
, ( 10)w here ~ (0, 2)
,t t
f st s
r N
u
σ
, and t he unobserved random variables
t indicat est he st at e in w hich is t he m arket .
The value of t he current regim e
s
t is assum ed t o depend on t he st at e oft he previous period only,
s
t−1, and t he t ransit ion probabilit yij t
t js i p
s
P{ = −1 = }= gives t he probabilit y t hat st at e i w ill be follow ed by
st at e j. I n t he t w o st at e case p11+ p12 =1 and p22 + p21 =1, and t he corresponding t ransit ion m at rix is
=
P
⎥ ⎦ ⎤ ⎢ ⎣ ⎡ − − 22 11 22 11 1 1 p p p p ( 11)The j oint probabilit y of
r
f,t ands
tis t hen given by t he product)
,
(
)
,
;
(
)
,
,
(
r
f,ts
t=
j
Y
t−1ψ
=
f
r
f,ts
t=
j
Y
t−1ψ
P
s
t=
j
Y
t−1ψ
p
j
=
1
,
2
( 12)w here
Y
t−1 is t he inform at ion set t hat includes all past inform at ion on t hepopulat ion param et ers and
(
0t,
(
t t)
,
(
t t)
,
s2t)
S s S s S s H s
s
b
d
e
d
e
σ
ψ
=
is t he vect or ofparam et ers t o be est im at ed.
f
(.)
is t he densit y ofr
f,t, condit ional on t he random variables
t, andP
(.)
is t he condit ional probabilit y t hats
tw ill t ake t he valuej
.For t he t w o- st at e case t he densit y dist ribut ion of
r
f,t is, following Ham ilt on ( 1994, Chapt er 22)⎪⎩ ⎪ ⎨ ⎧ ⎪⎭ ⎪ ⎬ ⎫ − ⎪⎩ ⎪ ⎨ ⎧ + ⎪⎭ ⎪ ⎬ ⎫ − = − 2 2 2 2 , 2 2 2 1 2 1 , 2 1 1 , 2 exp 2 1 2 exp 2 1 ) , (
σ
πσ
σ
πσ
ψ
r t r tt t f f f u u Y r
g ( 13)
w here r st
t f
u , is t he residual of equat ion ( 10) .
I f t he unobserved st at e variable
s
t is i.i.d. m axim um likelihood est im at esof t he param et ers in
ψ
are obt ained m axim izing t he follow ing loglikelihood funct ion wit h respect t o t he unknow n param et er s
L
∑
= −
=
T t t t fY
r
g
1 1 ,,
)
(
log
)
(
ψ
ψ
( 14)I n t his paper t he ident ificat ion process of t he nat ure of t he regim es,
essent ial for t he int erpret at ion of a Markov swit ching m odel, r elies on t he
est im at es of equat ion ( 10) and on t he analysis of t he behavior over t im e
of t he st at e probabilit ies.
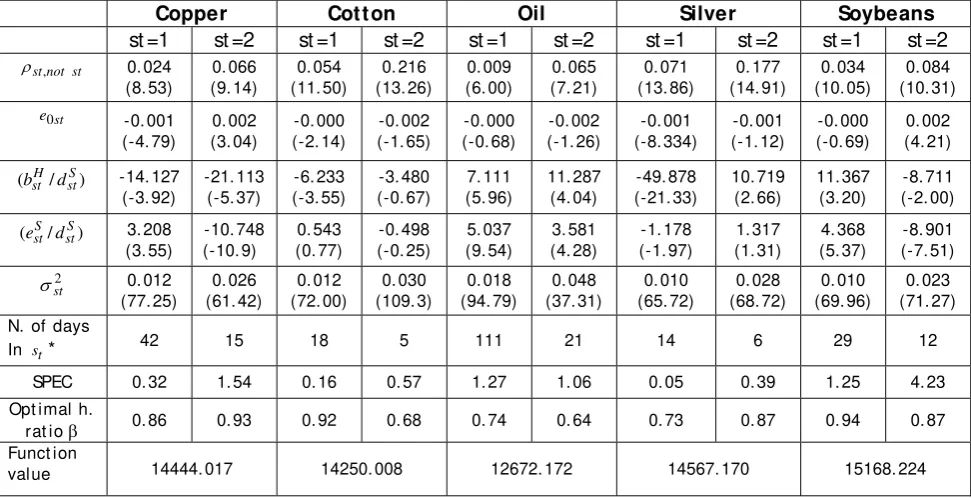
< I NSERT TABLE 6 ABOUT HERE >
Table 6 set s out t he est im at es of equat ion ( 10) for t he five com m odit y
m arket s. The qualit y of fit is highly sat isfact ory since, w it h t he except ion
of cot t on, t he relevant coefficient s change across regim es and are
significant ly different from zero. The regim e ( st at e) 2 variances are fr om
t w o t o t hr ee t im e lar ger t han t hose of regim e ( st at e) 1. The probabilit y of
sw it ching from a low variance t o a high variance st at e
p
12 is lower t hant he probabilit y of swit ching fr om a high variance t o a low variance st at e
21
p
. For inst ance, in t he case of oil, t he t ransit ion probabilit ies are%
9
.
0
12=
p
andp
21=
6
.
5
%
; t hese findings indicat e t hat t he averageexpect ed durat ion of being in st at e 1 is close t o 111 w orking days ( about
5 m ont hs) and t he average expect ed durat ion of being in st at e 2 is of 21
w orking days.13 The num ber of days of high volat ilit y is, on t he w hole,
rat her sm all.
A relevant difference in hedging and speculat ion be easily det ect ed across
regim es. I n t he case of copper and soybeans, a risk averse speculat ive
behavior in st at e 1 is reversed w it h t he change of regim e; speculat or s
increase t heir dem and for fut ures cont ract s w henever t he volat ilit y rises.
I n t he rem aining m arket s speculat ors behave in t he opposit e w ay. Their
react ion t o ( a high) fut ures ret urn volat ilit y decreases in t he case of oil
and becom es nil in t he case cot t on and silver. This finding is of int erest for
t he int er pr et at ion of t he m ain dr iver s of t he volat ilit y m ovem ent s for t hese
com m odit ies: it suggest s t hat volat ilit y changes, in r egim e 2, m ay be due
m ore t o spillover s fr om m onet ary, financial, and exchange r at e m arket s
t han t o endogenous m arket speculat ion.
The weight ed coefficient rat io ( SPEC) set fort h in Table 6 suggest s – being
great er t han 1 - t hat in st at e 2 t he im pact of speculat ion on fut ures price
dynam ics is st rong for all t he com m odit ies, w it h t he except ion of cot t on
13
The average expect ed durat ion of being in st at e 1 is com put ed according t o Ham ilt on
and silver, w here t he probabilit y of being in st at e 2 is how ever very low . I t
is w ort h not icing t hat for oil ret urns, even if t he SPEC m easur e is alw ays
larger t han 1, since speculat ors are m ore react ive t han hedgers t o
volat ilit y in bot h st at es, t he index declines in t he second regim e, as
consum ers increase t heir hedging in periods of high ret urn variabilit y.
Finally, t he opt im al hedge rat io
β
t ends t o increase during t he highvolat ilit y period in t he case of silver and copper ( a result due t o t he
significant increase in correlat ion bet w een spot and fut ures ret urns) , w hile
for oil, cot t on, and soybeans t he reverse holds t rue.14
< I NSERT FI GURE 1 ABOUT HERE >
< I NSERT FI GURE 2 ABOUT HERE >
Figures 1 and 2 provide useful insight s on t he dat ing of t he regim e shift s.
I n t he upper graph of each figure is set fort h t he behavior over t he sam ple
of t he t im e t probabilit y t hat t he m arket is in regim e 1. I n t he low er graph
is set out t he rat e of ret urn of t he corresponding fut ures cont ract . Visual
inspect ion suggest s t hat regim e 1 m ay be associat ed wit h periods in which
ret urn var iabilit y is low ( and t hus regim e 2 wit h periods in which it is
high) .15
< I NSERT TABLE 7 ABOUT HERE >
Table 7 report s t he correlat ion coefficient s bet w een t he pr obabilit y 1
regim e and t he daily rat e of ret urn and st andard deviat ion of t he
corresponding fut ures cont ract . As expect ed, w e find a large negat ive and
significant correlat ion coefficient bet ween t he regim e 1 pr obabilit ies and
t he daily st andard deviat ions. We det ect , how ever, also a significant
posit ive correlat ion of t hese regim e probabilit ies w it h fut ures r et urns. This
result indicat es, especially for silver, a m ore com plex ident ificat ion of t he
nat ure of t he st at e variable
s
t. Regim e 1 is t o be associat ed w it h bot h low fut ures ret urn variabilit y and, t o a lesser ext ent , w it h posit ive fut ures pricerat es of change ( i.e. possibly w it h a bullish m arket ) , and regim e 2 w it h
14 The correlat ion bet ween t he spot and fut ures ret urns is generally st ronger in t he high
volat ilit y regim e. I n t he case of cot t on and soybeans, however, t he increase is sm all ( 3.75 and 1.16 per cent , respect ively) . This lack of react ion t o volat ilit y shift s m ay explain t he port folio risk m inim izat ion result s of Table 5, where, for t hese com m odit ies, t he t im e-varying condit ional hedge rat ios are out perform ed by t he const ant OLS opt im al hedges.
15 For each m arket , bout s of high variabilit y are clearly ident ified. They do not coincide in
high ret ur n variabilit y and negat ive fut ur es pr ice rat es of change ( i.e. w it h
a bear ish m arket ) .16
5 Con clu sion s
This paper exam ines t he dynam ic behavior of fut ures ret urns on five
com m odit y m arket s. The int eract ion bet w een hedgers and speculat ors is
m odelled using a highly non linear param et erizat ion w here hedgers react
t o deviat ions from t he m inim um variance of t he hedged port folio and
speculat or s respond t o st andar d expect ed risk ret ur ns considerat ions. The
relat ionship bet w een expect ed spot and fut ures ret urns and t im e varying
volat ilit ies is est im at ed using a non linear in m ean CCC- GARCH appr oach.
The result s point t o t he suit abilit y of t his choice because of t he qualit y of
fit and of t he sensible m eaning of t he m odel’s param et er est im at es.
I n spit e of t he grow ing role of speculat ion, over t he 1990- 2010 sam ple
period, hedgers play a dom inant role since fut ures ret urns dynam ics is
m ost ly associat ed wit h t he variabilit y of t he hedged port folio, especially in
t he frequent low volat ilit y periods.
We account for t he im pact of financial int egrat ion of t he com m odit y
m arket s by allow ing t he dem and of fut ures t o be dependent upon t he
“ st at e of t he m arket ” via a Markov regim e sw it ching approach. Bot h visual
inspect ion and correlat ion analysis suggest t hat regim e 1 be associat ed
w it h periods in w hich ret urn variabilit y is low and regim e 2 w it h periods in
w hich it is high. Opt im al hedging rat ios com put ed in each st at e are larger
in high volat ilit y regim es for copper and silver, w hile t he reverse holds
t rue for oil, cot t on, and soybeans. The differences across regim es in
hedging and speculat ive behavior are dist inct ive and not hom ogeneous
across com m odit ies. The im pact on fut ures ret urns of t he rat io of
speculat ive t o hedging drivers seem s t o be st rong, w hen m arket volat ilit y
is high, in t hree out of t he five m arket s of t he sam ple.
I t should be not iced, finally, t hat t he posit ive correlat ion of t he regim e
probabilit ies wit h t he fut ur es daily rat es of ret urns suggest s, especially for
silver, a m ore com plex ident ificat ion of t he nat ure of t he st at e variable.
Furt her invest igat ion, e.g. int r oducing a four regim e fram ew ork, could
provide addit ional insight s about t he nat ur e of t he volat ilit y of t he fut ur es
TABLE 1 D e scr ipt ive st a t ist ics
Daily sam ple from 3 January 1990 t o 26 January 2010 ( 5325 observat ions)
Ret urn Mean St . dev. Sk. Kurt . JB ARCH(1)[ pr. ] ARCH(5)[ pr. ]
Copper f ut ures 0. 000229 0. 0169 -0. 22 4. 53 4520. 46 181. 57[ 0. 00] 570. 36[ 0. 00]
Copper cash 0. 000210 0. 0169 -0. 21 4. 51 4483. 09 346. 76[ 0. 00] 876. 66[ 0. 00]
Cot t on f ut ures 0. 000112 0. 0175 -0. 79 22. 07 106878. 63 14. 45[ 0. 00] 91. 93[ 0. 00]
Cot t on cash 0. 000122 0. 0174 0. 02 2. 43 1290. 37 177. 66[ 0. 00] 843. 85[ 0. 00]
Oil f ut ures 0. 000270 0. 0250 -0. 95 17. 52 67710. 6 73. 16[ 0. 00] 365. 74[ 0. 00]
Oil cash 0. 000240 0. 0240 -1. 23 24. 63 1333762. 2 20. 55[ 0. 00] 94. 68[ 0. 00]
Silver f ut ures 0. 000220 0. 0165 -0. 39 6. 89 10498. 5 120. 53[ 0. 00] 401. 85[ 0. 00]
Silver cash 0. 000220 0. 0177 -0. 23 4. 40 3521. 0 121. 88[ 0. 00] 334. 44[ 0. 00]
Soybeans f ut ures 0. 000095 0. 0148 -0. 59 5. 94 8020. 7 29. 21[ 0. 00] 206. 73[ 0. 00]
Soybeans cash 0. 000097 0. 0152 -0. 75 7. 24 11964. 7 60. 45[ 0. 00] 360. 72[ 0. 00]
TABLE 2 Con dit ion a l m e a n e qu a t ion s
Copper n= 2, m = 2
Cot t on n= 1, m = 2 k: dum m y in fut ures eq.
Oil n= 1, m = 1
t c
r, rf,t rc,t rf,t rc,t rf,t
0
a 0.006
( 88.93) a0
- 2.0E- 04
( - 1.84) a0
- 0.012 ( - 86.89)
1
a - 0.303
( - 52.45) a1
- 0.081
( - 10.44) a1
- 0.219 ( - 25.74)
2
a 0.247
( 45.79)
1
b - 0.172
( - 25.99) b1
0.084
( 14.72) b1
0.235 ( 32.58)
2
b 0.161
( 28.53) b2
- 0.026 ( - 3.74)
1
ε 0.036
( 113.64) ε1
0.030
( 15.08) ε1
0.065 ( 89.89)
0
d 0.134
( 69.63) d0
0.292
( 70.37) d0
-1
d 1.004
( 2512.4) d1
0.939
( 930.29) d1
0.957 ( 1547.6)
0
e - 1.0E- 04
( - 1.35) e0
- 5.6e- 04 ( - 5.22) e0
2.1E- 04 ( 1.51)
) /
(bH dS - 25.804
( - 15.87) ( / )
S H
d
b - 9.416
( - 9.67) ( / )
S H
d
b 4.217
( 5.51)
) /
(eS dS - 5.871
( - 14.68) ( / )
S S
d
e - 1.743
( - 4.23) ( / )
S S
d
e 2.401
( 7.61)
k - 0.280
( - 44.63)
] [ t
Eν 0.02
( 1.67)
0.02
( 1.58) E[νt]
0.007 ( 0.51)
0.005
( 0.37) E[νt]
- 0.016 ( - 1.16)
- 0.012 ( - 0.90)
]
[ t2
Eν 0.999 0.999 E[νt2] 1.000 1.000 E[νt2] 0.999 1.000
Sk. - 0.34 - 0.19 Sk. - 0.008 0.03 Sk. - 0.29 - 0.33
Kurt . 3.78 2.88 Kurt . 1.66 4.09 Kurt . 4.55 3.08
ARCH( 1) 0.23
[ 0.63]
2.75
[ 0.10] ARCH( 1)
0.77 [ 0.38]
0.003
[ 0.95] ARCH( 1)
0.59 [ 0.44]
4.78 [ 0.03]
ARCH( 6) 3.00
[ 0.81]
5.14
[ 0.53] ARCH( 6)
8.28 [ 0.22]
5.52
[ 0.48] ARCH( 6)
12.07 [ 0.06]
1.63 [ 0.95]
JB 3215.33 1840.81 JB 602.09 3648.35 JB 4592.51 2167.71
Not e: An AR( 1) filt er pr e- w hit ens t his fut ures ret urn t im e series; νt :
st andardized condit ional m ean residual.
Not e: The condit ional variance of t he fut ur es ret urns is param et erized
TABLE 3 Con dit ion a l m e a n e qu a t ion s
Silver n= 1, m = 1
Soybeans n= 1, m = 1
t c
r, rf,t rc,t rf,t
0
a 0.003
( 41.45) a0
- 0.001 ( - 14.87)
1
a - 0.143
( - 22.76) a1
- 0.231 ( - 39.23)
1
b 0.164
( 43.38) b1
0.215 ( 41.30)
1
ε 0.592
( 140.97) ε1
0.047 ( 25.47)
0
d - 0.002
( - 13.54) d0
0.012 ( 8.79)
1
d 1.001
( 49350.4) d1
0.998 ( 4670.5)
0
e 0.0002
( 2.62) e0
0.0003 ( 4.91)
) /
(bH dS 16.050
( 9.32) ( / )
S H
d
b - 19.695
( - 12.62)
) /
(eS dS 2.582
( 6.11) ( / )
S S
d
e ( - 17.69) - 5.916
] [ t
Eν 0.027
( 1.94)
0.022
( 1.61) E[νt]
0.010 ( 0.74)
0.012 ( 0.88)
] [ t2
Eν 0.999 0.999 E[νt2] 1.00 1.00
Sk. - 0.38 - 0.31 Sk. - 0.21 - 0.02
Kurt . 4.63 3.83 Kurt . 2.71 2.88
ARCH( 1) 4.24
[ 0.04]
1.50
[ 0.22] ARCH( 1)
1.95 [ 0.16]
0.58 [ 0.45]
ARCH( 6) 13.09
[ 0.04]
9.76
[ 0.13] ARCH( 6)
5.11 [ 0.53]
3.74 [ 0.71]
JB 4796.9 3284.8 JB 1646.6 1814.0
TABLE 4 Re la t ive im por t a n ce of spe cu la t ive dr ive r s on fu t u r e s pr icin g ( a bsolu t e va lu e of
/
(
1
2)
, 2
, 2
, r t rr t H t r S f c c f
b
e
σ
σ
−
ρ
)TABLE 5 Opt im a l h e dge r a t ios a n d por t folio se con d m om e n t s
CCC-GARCH Estimates OLS Estimates Naïve
Opt imal hedge
rat io
β
St . Dev. of t he opt imal hedge
port f olio
Opt imal hedge rat io
β
St . Dev. of t he opt imal hedge
port f olio
St . Dev. of t he naive port f olio
Copper 0. 87 0. 008240 0. 91 0. 008374 0. 008519
Cot t on 0. 80 0. 011268 0. 76 0. 011179 0. 011894
Oil 0. 74 0. 016322 0. 70 0. 016416 0. 018017
Silver 0. 71 0. 010867 0. 72 0. 010868 0. 011857
Soybeans 0. 90 0. 007627 0. 89 0. 007605 0. 007770
TABLE 6 M a r k ov sw it ch in g r e gim e e st im a t e s of e qu a t ion ( 1 0 )
Copper Cot t on Oil Silver Soybeans
st =1 st =2 st =1 st =2 st =1 st =2 st =1 st =2 st =1 st =2 st
not st,
ρ 0. 024 (8. 53) 0. 066 (9. 14) 0. 054 (11. 50) 0. 216 (13. 26) 0. 009 (6. 00) 0. 065 (7. 21) 0. 071 (13. 86) 0. 177 (14. 91) 0. 034 (10. 05) 0. 084 (10. 31) st
e0 -0. 001 (-4. 79) 0. 002 (3. 04) -0. 000 (-2. 14) -0. 002 (-1. 65) -0. 000 (-0. 68) -0. 002 (-1. 26) -0. 001 (-8. 334) -0. 001 (-1. 12) -0. 000 (-0. 69) 0. 002 (4. 21) ) /
(bstH dstS -14. 127
(-3. 92) -21. 113 (-5. 37) -6. 233 (-3. 55) -3. 480 (-0. 67) 7. 111 (5. 96) 11. 287 (4. 04) -49. 878 (-21. 33) 10. 719 (2. 66) 11. 367 (3. 20) -8. 711 (-2. 00) ) /
(estS dstS 3. 208 (3. 55) -10. 748 (-10. 9) 0. 543 (0. 77) -0. 498 (-0. 25) 5. 037 (9. 54) 3. 581 (4. 28) -1. 178 (-1. 97) 1. 317 (1. 31) 4. 368 (5. 37) -8. 901 (-7. 51) 2 st
σ 0. 012 (77. 25) 0. 026 (61. 42) 0. 012 (72. 00) 0. 030 (109. 3) 0. 018 (94. 79) 0. 048 (37. 31) 0. 010 (65. 72) 0. 028 (68. 72) 0. 010 (69. 96) 0. 023 (71. 27) N. of days
In st* 42 15 18 5 111 21 14 6 29 12
SPEC 0. 32 1. 54 0. 16 0. 57 1. 27 1. 06 0. 05 0. 39 1. 25 4. 23 Opt imal h.
rat io β 0. 86 0. 93 0. 92 0. 68 0. 74 0. 64 0. 73 0. 87 0. 94 0. 87 Funct ion
value 14444. 017 14250. 008 12672. 172 14567. 170 15168. 224
Not es: * : Aver age expect ed durat ion of being in st at e st ; SPEC: speculat iv e t o hedging fact ors rat io
defined as t he absolut e value of / (1 2 )
, 2
, 2
, r t r r t
H t r S f c c f b
[image:23.595.86.572.260.509.2]e σ σ − ρ .
TABLE 7 Cor r e la t ion be t w e e n r e gim e 1 pr oba bilit y a n d da ily fu t u r e s r e t u r n s a n d st a n da r d de via t ion s
Copper Cotton Oil Silver Soybeans
t f
r , 0. 032
(2. 23) 0. 051 (3. 62) 0. 077 (5. 42) 0. 114 (8. 11) 0. 029 (2. 08) t f r,
σ -0. 600
[image:23.595.83.513.582.646.2]FI GURE 1
0.0
0.2 0.4 0.6 0.8 1.0
92 94 96 98 00 02 04 06 08
REGIME 1 PROBABILITY
-.12 -.08 -.04 .00 .04 .08 .12
92 94 96 98 00 02 04 06 08
COPPER FUTURES DAILY RATE OF RETURN
0.0 0.2 0.4 0.6 0.8 1.0
92 94 96 98 00 02 04 06 08
REGIME 1 PROBABILITY
-.4 -.3 -.2 -.1 .0 .1 .2
92 94 96 98 00 02 04 06 08
COTTON FUTURES DAILY RATE OF RETURN
0.0 0.2 0.4 0.6 0.8 1.0
92 94 96 98 00 02 04 06 08
REGIME 1 PROBABILITY
-.5 -.4 -.3 -.2 -.1 .0 .1 .2
92 94 96 98 00 02 04 06 08
OIL FUTURES DAILY RATE OF RETURN
0.0 0.2 0.4 0.6 0.8 1.0
92 94 96 98 00 02 04 06 08
REGIME 1 PROBABILITY
-.16 -.12 -.08 -.04 .00 .04 .08 .12
92 94 96 98 00 02 04 06 08
FI GURE 2
0.0 0.2 0.4 0.6 0.8 1.0
92 94 96 98 00 02 04 06 08
REGIME 1 PROBABILITY
-.15 -.10 -.05 .00 .05 .10
92 94 96 98 00 02 04 06 08
Re fe r e n ce s
Achen C. I nt erpret ing and Using Regression. Thousand Oaks, CA: Sage
Publicat ions. ( 1982)
Ai, C., A. Chat rat h, and F. Song. “ On t he Com ovem ent of Com m odit y
Prices” . Am erican Journal of Agricult ural Econom ics 88 ( 2006) : 574–588.
Alexander, C., and A. Barbosa. “ Effect iveness of Minim um Variance
Hedging” . Journal of Port folio Managem ent 33 ( 2007) : 46- 59.
Alizadeh, A., and N. Nom ikos. “ A Markov Regim e Sw it ching Approach for
Hedging St ock I ndices” . Journal of Fut ur es Mar ket s 24 ( 2004) : 649- 674.
Baillie, R., and R. Myer s. “ Bivariat e GARCH Est im at ion of t he Opt im al
Com m odit y Fut ures Hedge” . Journal of Applied Econom et rics 6 ( 1991) :
109- 124.
Benninga, S., R. Eldor, and I . Zilcha. " Opt im al Hedging in t he Fut ures
Market Under Price Uncert aint y” . Econom ics Let t ers 13 ( 1983) : 141- 145.
Bessem binder, H. “ Syst em at ic Risk, Hedging Pressure and Risk Prem ium s
in Fut ures Market s” . Review of Financial St udies 5 ( 1992) : 637- 667.
Bollerslev T., and J.M. Wooldridge. “ Quasi- m axim um Likelihood Est im at ion and I nference in Dynam ic Models w it h Tim e- varying Covariances” .
Econom et r ic Review s 11 ( 1992) : 143- 172.
Cashin, P., McDerm ot t , C.J. and A. Scot t . " The Myt h of Com oving Com m odit y Prices." I MF Wor king Paper 169 ( 1999) .
Cecchet t i, S.G., Cum by, R.E., and S. Figlew ski. “ Est im at ion of t he Opt im al
Fut ures Hedge” . Review of Econom ics and St at ist ics 70 ( 1988) : 623–630.
Chan, W., and D. Young. “ Jum ping Hedges: An Exam inat ion of Movem ent s
in Copper Spot and Fut ures Market s” . Journal of Fut ures Market s, 26
( 2006) : 169- 188.
Chang, B. ” Ret urns t o Speculat ors and t he Theory of Norm al
Backw ardat ion” . Journal of Finance 40 ( 1985) : 193- 208.
Ederingt on, L.H. “ The Hedging Perform ance of t he New Fut ures Market s” .
Journal of Finance 34 ( 1979) : 157–170.
Fagan, S., and R. Gencay. “ Liquidit y- I nduced Dynam ics in Fut ures Market s” . MPRA Wor king Paper 6677 January ( 2008) .
Figlew ski, S. “ Hedging Perform ance and Basis Risk in St ock I ndex
Figuer ola- Ferret t i, I ., and J. Gonzalo. “ Modelling and Measuring Price
Discovery in Com m odit y Mar ket s” . Journal of Econom et r ics 158 ( 2010) :
95- 107.
Garbade, K.D., and W.L. Silber. ” Price Movem ent s and Price Discovery in
Fut ures and Cash Market s” . Review of Econom ics and St at ist ics 65
( 1983) : 289- 297.
Ham ilt on, J.D. “ A New Approach t o t he Econom ic Analysis of
Nonst at ionary Tim e Series and t he Business Cycle” . Econom et rica 57
( 1989) : 357- 384.
Ham ilt on, J.D. Tim e series analysis. Princet on, NJ: Princet on Univer sit y Press. ( 1994) .
Hieronym us, T.A. Econom ics of Fut ur es Trading for Com m er cial and
Per sonal Profit . 2nd r eprint New York: Com m odit y Resear ch Bureau I nc.
( 1977)
I rw in, S.H., Sanders, D.R., and R.P. Merrin. ” Devil or Angel? The Role of
Speculat ion in t he Recent Com m odit y Price Boom ( and Bust ) ” . Journal of
Agricult ural and Applied Econom ics 41 ( 2009) : 377- 391.
Johnson, L.L. ” The t heory of Hedging and Speculat ion in Com m odit y
Fut ures” . Review of Econom ic St udies 27 ( 1960) : 139- 151.
Kavussanos, M.C., and I .D. Visvikis. “ Hedging Effect iveness of t he At hens
St ock I ndex Fut ures Cont ract s” . European Journal of Finance 14 ( 2008) :
243- 270.
Kolb, R.W., and J. Okunev. 'An Em pir ical Evaluat ion of t he Ext ended Mean- Gini Coefficient for Fut ures Hedging', Journal of Fut ures Market s 12 ( 1992) : 177- 186.
Kroner, K.F., and J. Sult an. “ Tim e- varying Dist ribut ion and Dynam ic
Hedging w it h Foreign Currency Fut ures” . Jour nal of Financial and
Quant it at ive Analysis 28 ( 1993) : 535–551.
Lee, T.H., and J. Yoder. “ Opt im al Hedging Wit h a Regim Sw it ching Tim
e-Varying Correlat ion Garch Model” . Journal of Fut ures Market s 27 ( 2007) :
495–516.
Lence, S.H. “ The Econom ic Value of Minim um - Variance Hedges” . Am erican
Journal of Agricult ural Econom ics 77 ( 1995) : 353- 364.
Le Pen, Y., and B. Sévi. “ Revisit ing t he Excess Co- m ovem ent s of Com m odit y Pr ices in a Dat a- Rich Environm ent ” m em o Universit é de Nant es ( 2010) .
Lescaroux, F. “ On t he Excess Co- m ovem ent of Com m odit y Prices—A Not e
about t he Role of Fundam ent al Fact ors in Short - Run Dynam ics” . Energy
Lien, D. and Y.K. Tse. “ Hedging Dow nside Risk w it h Fut ure Cont ract s” .
Applied Financial Econom ics 10 ( 2000) : 163- 170.
McKinnon, R.L. “ Fut ures Market s, Buffer St ocks and I ncom e St abilit y for
Prim ary Pr oducer s” . Journal of Polit ical Econom y 73 ( 1967) : 844- 861.
Miffre, J.” Condit ional OLS Minim um Variance Hedge Rat ios” . Journal of
Fut ures Market s 24 ( 2004) : 945- 964.
Pyndick, R.S., and J.J. Rot em berg. “ The Excess Co- m ovem ent of
Com m odit y Prices” . Econom ic Journal 100 ( 1990) : 1173–1189.
Sarno, L., and G. Valent e. “ The Cost of Carry Model and Regim e Shift s in
St ock I ndex Fut ures Mar ket s: An Em pirical I nvest igat ion” . Journal of
Fut ures Market s 20 ( 2000) : 603–624.
St ein, J.L. “ The Sim ult aneous Det erm inat ion of Spot and Fut ures Prices” .
Am erican Econom ic Review 51( 1961) : 1012- 1025.
St ulz, R.M. “ Ret hinking Risk Managem ent ” . Journal of Applied Corporat e
Finance 9 ( 1996) : 8- 24.
Ward, R.W., and L.B. Flet cher. “ From Hedging t o Pure Speculat ion: a
Micro Model of Fut ur es and Cash Mar ket Posit ions” . Am erican Journal of