ISSN Online: 2162-2086 ISSN Print: 2162-2078
Non-Linear Effect of Remittances on
Banking Sector Development: Panel
Evidence from Developing Countries
Yaya Keho
Ecole Nationale Supérieure de Statistique et d’Economie Appliquée (ENSEA), Abidjan, Ivory Coast
Abstract
This paper examines the impact of remittances on financial sector development in a panel of 19 developing countries. Contrary to previous studies that focus on mean effects, it uses quantile regression methodology to examine whether the effect of re-mittances on financial development is the same for less and more financially devel-oped countries. The results point out that remittances promote financial develop-ment only in less financially developed countries. Further, the effect of income is positive and larger in less financially developed countries. Trade openness is posi-tively related to financial development while inflation and urbanization are negative-ly related to it.
Keywords
Remittances, Financial Development, Quantile Regression, Developing Countries
1. Introduction
Remittances have become an important source of foreign exchange earnings for devel-oping countries. Over the period from 1970 to 2013 develdevel-oping countries received sig-nificant amount of remittances. Remittance inflows to Sub-Saharan Africa increased from 0.9 percent of GDP in 1994 to 1.6 percent in 2004 and reached 2.3 percent in 2014. In South Asia, remittances increased from 2.2 percent of GDP in 1994 to 4.5 percent in 2014. Given the increasing volume of remittance inflows to developing countries, a number of studies have analyzed their development impact with more focus on the growth-enhancing and poverty-reducing effects. Remittances increase economic growth and reduce poverty by stimulating per capita income of the recipient country, enabling households to overcome credit constraints and improving human development.
How-How to cite this paper: Keho, Y. (2016) Non-Linear Effect of Remittances on Bank-ing Sector Development: Panel Evidence from Developing Countries. Theoretical Econo- mics Letters, 6, 1096-1104.
http://dx.doi.org/10.4236/tel.2016.65105
Received: September 8, 2016 Accepted: October 9, 2016 Published: October 12, 2016
Copyright © 2016 by author and Scientific Research Publishing Inc. This work is licensed under the Creative Commons Attribution International License (CC BY 4.0).
http://creativecommons.org/licenses/by/4.0/
ever, the findings by [1]-[4] showed that the impact of remittances on growth and po-verty depends on the level of financial development and how remittances are spent. Another strand of literature has analyzed the impact of remittances on the financial sector development. Theoretically, this relationship is ambiguous. Money transferred through financial institutions can enable households to gain access to financial pro- ducts and services provided by financial institutions. If financial institutions perceive remittances to be stable, they might become more willing to extend credit to remittance recipients and then the volume of credit in the economy might significantly increase [5]. On the other hand, because remittances reduce credit constraints, they may lower de-mand for credit and dampen financial sector development. If recipients immediately spend remittances or distrust banks and prefer other ways to save their money, the vo-lume of credit provided by financial institutions might not increase.
On the empirical front, very few studies have examined the impact of remittances on financial development. [5] assessed the impact of remittances on financial sector de-velopment for 109 countries over the period 1975-2007. Using a dynamic GMM frame- work, they found that remittances are positively related to financial development mea- sured as share of bank deposits or the ratio of bank credit to the private sector. [6] used fixed effects panel instrumental variables estimation and found that remittance flows to Sub-Saharan countries promote financial development proxied by the ratio of bank de- posits to GDP and the ratio of M2 to GDP.
As can be seen, the empirical studies regarding the impact of remittances on financial sector development are very rare. Furthermore, the existing studies have primarily re-lied on estimation approaches which estimate the mean effect of remittances assuming implicitly that the effect of financial development is the same regardless the level of fi-nancial depth. By estimating how “on average” remittances affect fifi-nancial develop-ment these studies do not study how remittances affect countries with different levels of financial development. For example, while remittances may matter for average coun-tries, it would be useful to know if they matter for less financially developed countries. In this paper, we not only address the question, “doremittances matter?” but also “for whom do remittances matter?” It is likely that the effect of remittances is different for less and most financially developed countries. Our work is the first to analyze the im-pact of remittances on financial development at different points of the financial depth distribution. To achieve this we apply the quantile regression methodology developed by
[7] for a panel of 45 African and Asian countries. The advantage of quantile regression relies in the possibility of investigating the effect of a covariate at many points of the con-ditional distribution of the dependent variable, not only at the mean but also in the tails. The remainder of the article is organized as follows. Section 2 outlines the econome-tric methodology. Section 3 describes the data and discusses the empirical results, while Section 4 concludes.
2. Model and Econometric Methodology
2.1. The Empirical Model
model:
0 1 2 3 4
it it it it it it
FIN =β +βGDP +β REM +βTO +β INF +µ (1)
where i is for country i in the panel, t refers to the time period, FIN stands for financial development indicator, GDP refers to real GDP per capita, REM is the remittances va-riable measured as the ratio of remittances to GDP, TO stands for trade openness and
INF is inflation rate. It is expected that economic growth, remittances and trade open-ness increase financial deepening while inflation lowers it [8].
Equation (1) assumes the marginal effect of remittances on financial development to be the same regardless the level of financial depth. If the effect could be different for countries with different financial development levels, this linear relationship may be miss pecified. We are interested in estimating this model in a way that identifies differ-ences in the response of financial development to remittances at various points of the distribution of financial development. To this end, we employ the quantile regression method which is a widely used estimation technique when it comes to examining the impact of explanatory variables at different points of the distribution of the dependent variable.
2.2. Quantile Regression Methodology
The quantile regression method was first introduced by [7] and discussed in further works (see [9] [10]). Compared to OLS regression, this method is more robust to out-liers and non-normality. The quantile regression model can be formulated as follows:
(
it)
0 1 it 2 it 3 it 4 it itq FIN =βτ +βτGDP +βτREM +βτTO +βτINF +µ (2)
where q FIN
(
it)
is the conditional quantile of financial sector development.Equation (2) can be written as follows:
( )
it it it
y =xβ τ +ε (3)
where xit =
(
1,GDP REMit, it,TO INFit, it)
is the vector of explanatory variables; β τ( )
are the k×1 regression coefficients at the τ-th quantile of the dependent variable y.
Contrary to the usual minimization of the sum of squared residuals in the OLS case, the quantile regression estimator minimizes the weighted sum of absolute deviations:
( )
(
)
( )
min 1
it it it it
it it it it
y x y x
y x y x
τ τ
θ ≥ θτ β τ ≤ θ τ β τ
− + − −
∑
∑
(4)We have as many estimators of β as values of τ∈
[ ]
0,1 . The special case τ=0.5which minimizes the sum of absolute residuals corresponds to median regression. The first quartile is obtained by setting τ =0.25 and so on. As one increases
τ
from 0 to1, one traces the entire conditional distribution of financial development. It is in this way that quantile regression allows for parameter heterogeneity in the response of the dependent variable to explanatory variables.
re-gression is estimated as a first step. As a second step, these fixed effects are used to de-mean the dependent variable and this transformed variable is taken as the dependent variable in the quantile regression described above. The use of panel quantile regres-sions with fixed effects improves the usual panel pooled data regresregres-sions by exploring simultaneously two kinds of heterogeneity: unobserved country heterogeneity via fixed effects and common heterogeneity via covariates effects along the dependent variable distribution.
3. Data and Empirical Results
3.1. Data and Descriptive Statistics
The empirical analysis uses annual time series data for 19selected countries: Benin, Burkina Faso, Cameroon, Cote d’Ivoire, Ghana, Kenya, Mali, Niger, Nigeria, Senegal, South Africa, Bangladesh, China, India, Indonesia, Malaysia, Pakistan, Philippines, and Thailand. The countries were chosen based on data availability. The variables under study are: remittances as share of GDP, real GDP per capita expressed in constant 2005 US dollar, the ratio of domestic credit to private sector by banks as share of GDP used as an indicator of financial development, trade openness measured by the ratio of ex-ports and imex-ports to total GDP, inflation rate measured as the growth rate of consumer price index and urbanization as share of total population. All the data cover the period 1987 to 2013 and are obtained from the 2015 World Development Indicators by the World Bank. The data were converted into natural logarithms, except inflation rate.
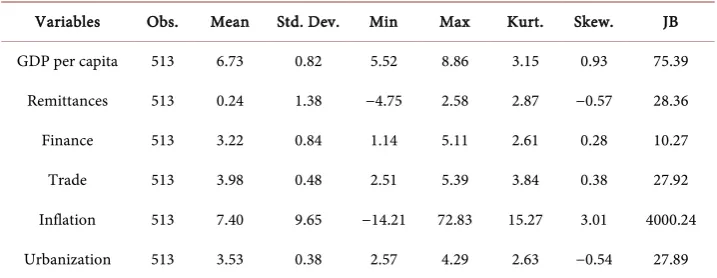
[image:4.595.195.554.548.687.2]Table 1 gives some descriptive statistics of the data. The Table shows one measure of tails i.e. the Kurtosis among other descriptive statistics. Kurtosis measures the peaked-ness or flatpeaked-ness of the distribution of the series. It is well known that whenever this quantity exceeds 3, we say that the data feature heavy tails. It is evident that most of the variables are leptokurtic. Another statistic is the Skewness that measures the asymmetry of the distribution of the series around its mean. A formal test of normality combining the Kurtosis and the Skewness is given by the Jarque-Bera test statistic, which suggests that all variables follow non normal distribution.
Table 1. Descriptive statistics.
Variables Obs. Mean Std. Dev. Min Max Kurt. Skew. JB
GDP per capita 513 6.73 0.82 5.52 8.86 3.15 0.93 75.39
Remittances 513 0.24 1.38 −4.75 2.58 2.87 −0.57 28.36
Finance 513 3.22 0.84 1.14 5.11 2.61 0.28 10.27
Trade 513 3.98 0.48 2.51 5.39 3.84 0.38 27.92
Inflation 513 7.40 9.65 −14.21 72.83 15.27 3.01 4000.24
Urbanization 513 3.53 0.38 2.57 4.29 2.63 −0.54 27.89
3.2. Unit Root and Cointegration Test Results
Before carrying out the empirical analysis, we test for stationary and cointegration to make sure that all variables in the model are cointegrated. We test for stationarity using
[12]-[14] unit root tests. The results reported in Table 2 strongly suggest that the va-riables in level are non-stationary and stationary in first differences. Consequently, panel cointegration tests can be employed to study the long-run relationship.The re-sults of the Johansen-Fisher cointegration test non-reported here support the existence of a long-run relationship between the variables.
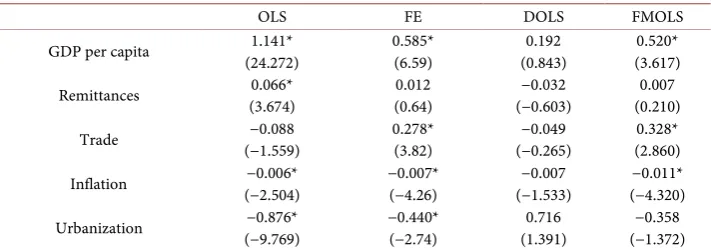
[image:5.595.196.555.339.506.2]In a panel framework, several linear estimators can be used to estimate a cointegrat-ing relationship: OLS, fixed-effects (FE), Fully Modified OLS (FMOLS) and Dynamic OLS (DOLS). [15] analyzed the properties of the OLS estimator and showed that the FMOLS and DOLS estimators may be more promising in cointegrated panel regres-sions. However, [16] showed that both the OLS and FMOLS have small bias and that the DOLS estimator outperforms both estimators. For comparison purposes, we per-form these conditional mean methods. The results of OLS, FE, DOLS and FMOLS re-gressions are given in Table 3. As can be seen, GDP per capita is robustly and signifi-
Table 2. Results of panel unit root tests.
Variables Level First difference
IPS LLC PP Fisher IPS LLC PP Fisher
Finance (0.557) 0.145 (0.196) −0.855 (0.904) 27.164 −13.287*(0.000) −13.469* (0.000) 249.000* (0.000)
GDP per capita (1.00) 7.444 (1.00) 4.038 (0.977) 22.605 −10.107* (0.000) −10.449* (0.000) 185.429* (0.000)
Remittances (0.134) −1.106 −2.465*(0.006) (0.303) 41.955 −16.463* (0.000) −17.557* (0.000) 307.829* (0.000)
Trade (0.178) −0.922 −1.924* (0.027) (0.140) 47.420 −17.130* (0.000) −17.706* (0.000) 348.262* (0.000)
Inflation (0.000) −9.609 −10.474 (0.000) 170.802 (0.000) −21.569 (0.000) −22.187 (0.000) 461.298 (0.000)
Urbanization (1.000) 10.997 (1.000) 9.845 86.967*(0.000) (0.999) 3.364 (1.000) 5.856 98.960*(0.000)
Note: IPS, LLC and PP-Fisher are the Im, Pesaran and Shin (2003), Levin, Lin and Chu (2002) and Maddala and Wu (1999) Fisher-PP panel unit root tests. Values in parentheses are p-value. * (**) signifies rejection of the unit root hypothesis at the 5% (10%) level.
Table 3. Conditional mean methods.
OLS FE DOLS FMOLS
GDP per capita (24.272) 1.141* 0.585* (6.59) (0.843) 0.192 (3.617) 0.520*
Remittances (3.674) 0.066* (0.64) 0.012 (−0.603) −0.032 (0.210) 0.007
Trade (−1.559) −0.088 0.278* (3.82) (−0.265) −0.049 (2.860) 0.328*
Inflation (−2.504) −0.006* −0.007* (−4.26) (−1.533) −0.007 (−4.320) −0.011*
Urbanization (−9.769) −0.876* −0.440* (−2.74) (1.391) 0.716 (−1.372) −0.358
[image:5.595.197.553.568.693.2]cantly positively related to financial deepening. Further, remittances are positively re-lated to financial development only in the OLS regression. Trade openness improves financial sector development in FE and FMOLS specifications while inflation is nega-tively related to financial development in three models. Urbanization is found to reduce bank credit to private sector in both OLS and FE models.
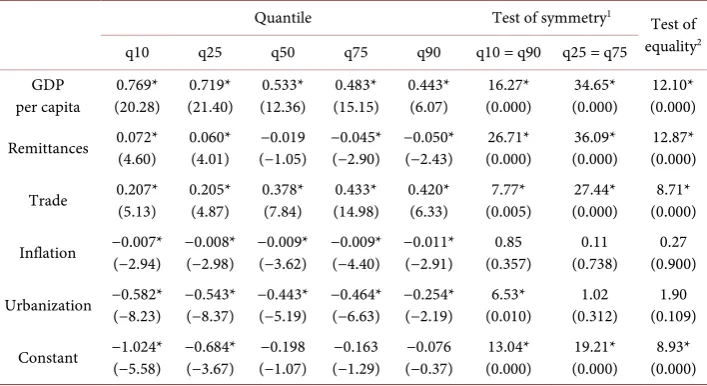
3.3. Results from Quantile Regressions
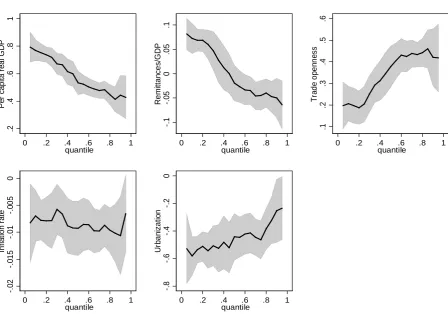
We report in Table 4 results from quantile regression for the 10th, 25th, 50th, 75th and 90thquantiles. Figure 1 illustrates how the magnitude of the coefficients of the cova-riates varies over quantiles. The results suggest some important differences across dif-ferent points in the conditional distribution of financial development. The estimates show that per capita income is positively related to financial depth and the effect is de-creasing overquantiles. For example, a 10% increase in income increases bank credit by 7.7% at the lower level of financial deepening but by 4.4% at the higher level of financial depth.
Another interesting result is the effect of remittances on domestic credit to private sector as share of GDP. This is a variable that was found to be insignificant in the DOLS and FMOLS regressions which focus on the mean effect. In the quantile regressions this variable has various effects on countries with different levels of financial development. The effect of remittances is positive and significant at the 0.25 quantile and lower, and negative at the 0.60 quantile and higher. Then remittances promote financial develop-ment in countries with lower level off inancial developdevelop-ment.
[image:6.595.198.552.479.672.2]With respect to the other covariates, trade openness is positively related to financial development and the effect is larger at the 0.75 quantile. Inflation and urbanization are negatively associated with financial development.
Table 4. Panel quantile regression results.
Quantile Test of symmetry1
Test of equality2 q10 q25 q50 q75 q90 q10 = q90 q25 = q75
GDP
per capita (20.28) 0.769* (21.40) 0.719* (12.36) 0.533* (15.15) 0.483* 0.443* (6.07) (0.000) 16.27* (0.000) 34.65* (0.000) 12.10*
Remittances 0.072*(4.60) 0.060*(4.01) (−1.05) −0.019 −0.045*(−2.90) −0.050*(−2.43) (0.000) 26.71* (0.000) 36.09* (0.000) 12.87*
Trade 0.207*(5.13) 0.205*(4.87) 0.378* (7.84) (14.98) 0.433* 0.420*(6.33) (0.005) 7.77* (0.000) 27.44* (0.000) 8.71*
Inflation −0.007* (−2.94) −0.008*(−2.98) −0.009*(−3.62) −0.009*(−4.40) −0.011*(−2.91) (0.357) 0.85 (0.738) 0.11 (0.900) 0.27
Urbanization −0.582*(−8.23) −0.543*(−8.37) −0.443*(−5.19) −0.464*(−6.63) −0.254*(−2.19) (0.010) 6.53* (0.312) 1.02 (0.109) 1.90
Constant −1.024* (−5.58) −0.684*(−3.67) (−1.07) −0.198 (−1.29) −0.163 (−0.37) −0.076 (0.000) 13.04* (0.000) 19.21* (0.000) 8.93*
Figure 1. Parameter estimates of quantile regressions and their confidence intervals. Note: The x-axis represents the condi-tional quantile of financial development measured as the share of bank credit to private sector to GDP. The solid line represents the quantile regression estimates and the shaded grey area plots the 95 percent confidence band.
4. Conclusions
This study has used panel quantile regression methodology to investigate the nonlinear effect of remittances on financial development in a panel of 19 developing countries. The use of panel quantile regressions with fixed effects improves the usual panel pooled data regressions by exploring simultaneously two kinds of heterogeneity: unobserved country heterogeneity via fixed effects and common heterogeneity via covariates effects within the quantile estimation. The results show that some determinants of financial development happen to be more important in less financially developed countries. In particular, we found that the effect of per capita income is positive and decreases with quantiles, suggesting that economic growth increases more financial development in less financially developed countries. Furthermore, remittances promote financial de-velopment in less financially developed countries while they are negatively related to financial development in more financially developed countries. In addition, the results indicated that trade openness is positively related to financial development while infla-tion and urbanizainfla-tion are negatively related to it. These findings give the insights that the effects of these factors may have been overestimated in previous studies that fo-cused on mean effects.
They also suggest that remittances can contribute to increase financial
intermedia-.2 .4 .6 .8 1 P er c ap it a r ea l G D P
0 .2 .4 .6 .8 1 quantile -.1 -. 05 0 .0 5 .1 R e m itta n c e s /GD P
0 .2 .4 .6 .8 1 quantile .1 .2 .3 .4 .5 .6 T rad e o pe nn es s
0 .2 .4 .6 .8 1 quantile -. 02 -. 01 5 -. 01 -. 00 5 0 In fl a ti o n r a te
0 .2 .4 .6 .8 1 quantile -.8 -.6 -.4 -.2 0 U rba ni z a ti on
tion in less financially developed countries by bringing recipient households into the formal financial sector. Given this effect, governments should make efforts to reduce transaction cost of remittances. Lowering the transaction cost of remittances would help to increase the volume of official remittances and therefore the current levels of financial development. This will have a positive effect on economic growth if these funds are channeled into productive uses.
References
[1] Giuliano, P. and Ruiz-Arranz, M. (2009) Remittances, Financial Development and Growth.
Journal of Development Economics, 90, 144-152.
http://dx.doi.org/10.1016/j.jdeveco.2008.10.005
[2] Mundaca, B.G. (2009) Remittances, Financial Markets Development and Economic Growth:
The Case of Latin America and the Caribbean. Review of Development Economics, 13, 288-
303. http://dx.doi.org/10.1111/j.1467-9361.2008.00487.x
[3] Adams, R.H. and Cuecuecha, A. (2010) Remittances, Household Expenditure and
Invest-ment in Guatemala. World Development, 38, 1626-1641.
http://dx.doi.org/10.1016/j.worlddev.2010.03.003
[4] Nyamongo, E.M., Misati, R.N., Kipyegon, L. and Ndirangu, L. (2012) Remittances,
Finan-cial Development and Economic Growth in Africa. Journal of Economics and Business, 64,
240-260. http://dx.doi.org/10.1016/j.jeconbus.2012.01.001
[5] Aggarwal, R., Demirgüç-Kunt, A., Soledad, M. and Peria, M. (2011) Do Remittances
Pro-mote Financial Development? Journal of Development Economics, 96, 255-264.
http://dx.doi.org/10.1016/j.jdeveco.2010.10.005
[6] Gupta, S., Pattillo, C.A. and Wagh, S. (2009) Effect of Remittances on Poverty and Financial
Development in Sub-Saharan Africa. World Development, 37, 104-115.
http://dx.doi.org/10.1016/j.worlddev.2008.05.007
[7] Koenker, R. and Bassett, G.J. (1978) Regression Quantile. Econometrica, 46, 33-50.
http://dx.doi.org/10.2307/1913643
[8] Boyd, J.H., Levine, R. and Smith, B.D. (2001) The Impact of Inflation on Financial Sector
Performance. Journal of Monetary Economics, 47, 221-248.
http://dx.doi.org/10.1016/S0304-3932(01)00049-6
[9] Koenker, R. and Machado, J.A.F. (1999) Goodness of Fit and Related Inference Processes
for Quantile Regression. Journal of the American Statistical Association, 94, 1296-1310.
http://dx.doi.org/10.1080/01621459.1999.10473882
[10] Koenker, R. and Hallock, K. (2001) Quantile Regression. Journal of Economic Perspectives,
15, 143-156. http://dx.doi.org/10.1257/jep.15.4.143
[11] Canay, I.A. (2011) A Simple Approach to Quantile Regression for Panel Data. The
Econo-metrics Journal,14, 368-386. http://dx.doi.org/10.1111/j.1368-423x.2011.00349.x
[12] Levin, A., Lin, C.F. and Chu, C. (2002) Unit Root Tests in Panel Data: Asymptotic and
Fi-nite Sample Properties. Journal of Econometrics, 108, 1-24.
http://dx.doi.org/10.1016/S0304-4076(01)00098-7
[13] Im, K.S., Peseran, M.H. and Shin, Y. (2003) Testing for Unit Roots in Heterogeneous
Pan-els. Journal of Econometrics, 115, 53-74. http://dx.doi.org/10.1016/S0304-4076(03)00092-7
[14] Maddala, G.S. and Wu, S. (1999) A Comparative Study of Unit Root Tests with Panel Data
and a Simple New Test. Oxford Bulletin of Economics and Statistics, 61, 631-652.
[15] Chen, B., McCoskey, S. and Kao, C. (1999) Estimation and Inference of a Cointegrated
Re-gression in Panel Data: A Monte Carlo Study. American Journal of Mathematical and
Man-agement Sciences, 19, 75-114. http://dx.doi.org/10.1080/01966324.1999.10737475
[16] Kao, C. and Chiang, M.H. (2000) On the Estimation and Inference of a Cointegrated
Re-gression in Panel Data. In: Baltagi, B., Ed., Nonstationary Panels, Panel Cointegration, and
Dynamic Panels (Advances in Econometrics), JAI Press, Amsterdam, 161-178.
http://dx.doi.org/10.1016/S0731-9053(00)15007-8
Submit or recommend next manuscript to SCIRP and we will provide best service for you:
Accepting pre-submission inquiries through Email, Facebook, LinkedIn, Twitter, etc. A wide selection of journals (inclusive of 9 subjects, more than 200 journals)
Providing 24-hour high-quality service User-friendly online submission system Fair and swift peer-review system
Efficient typesetting and proofreading procedure
Display of the result of downloads and visits, as well as the number of cited articles Maximum dissemination of your research work
Submit your manuscript at: http://papersubmission.scirp.org/