Modality Cost Analysis: A Methodology for Cost Effective
Datacenter Capacity Planning in the Cloud
M. Noureddine
Program Manager, Lync Server Group Microsoft Corporation
Seattle, USA
R. Bashroush
School of Computing, IT & Engineering University of East London
London, UK [email protected]
Abstract—In resource provisioning for datacenters, an important issue is how resources may be allocated to an application such that the service level agreements (SLAs) are met. Resource provisioning is usually guided by intuitive or heuristic expectation of performance and existing user model. Provisioning based on such methodology, however, usually leads to more resources than are actually necessary. While such overprovisioning may guarantee performance, this guarantee may come at a very high cost. A quantitative performance estimate may guide the provider in making informed decisions about the right level of resources, so that acceptable service performance may be provided in a cost-effective manner. A quantitative estimate of application performance must consider its workload characteristics. Due to the complex workload characteristics of commercial software, estimation of its performance and provisioning to optimize for cost is not straightforward. In this work we looked at breaking the application into isolated modalities (modality is a scenario in which an application is used, for example, instant messaging, and voice calls are two different modalities of a media application) and measuring resource cost per modality as an effective methodology to provision datacenters to optimize for performance and minimize cost. When breaking the application into modalities, resource cost is assessed in isolation. Results are then aggregated to estimate the overall resource provisioning requirements. A validation tool is used to simulate the load and validate the assumptions. This was applied to a commercially available solution and validated in a datacenter setting.
Keywords-OAuth; Access Deligation; Authorization Servers; I. INTRODUCTION AND MOTIVATION
It is one of the responsibilities of service providers to ensure appropriate resources are allocated to each tenant to guarantee acceptable performance of their products. The relationship between capacity planning and performance tuning is often misunderstood [13]. While they affect each other significantly, they have different goals. Performance tuning optimizes your existing system for better performance, while capacity planning determines what your system needs while maintaining the performance baseline. In order to guarantee performance SLAs, service providers in the Cloud tend to over provision mainly due to the lack of capacity planning tools that guide such optimization of performance and cost, and SLA violations are costly for Cloud hosted applications. A quantitative measurement of the resource cost (CPU, memory, storage, and network bandwidth) imposed by each of the modalities of the product, in isolation, may allow organizations
to make informed decisions with respect to the right level of resource provisioning. The objective of this paper is to illustrate a tested methodology to guide resource provisioning decisions. In this paper, we first present a systematic methodology to estimate the performance expected from each modality based on the representation of resource cost per modality. Subsequently, we discuss how the estimate of the expected application performance could guide resource provisioning decisions. We illustrate the methodology using a commercially available media application, the Microsoft Office Communications Server. Then we validate the performance estimation and resource provisioning methodology using a validation software tool to simulate a realistic workload against a production datacenter with all the modalities working together. The layout of the paper is as follows: Section 2 provides an overview of media applications performance. Section 3 provides an overview of the Modality Cost Analysis, our capacity planning methodology. Section 4 presents the results of our performance analysis and our validation tool. Section 5 summarizes the related research, and section 6 offers concluding remarks and directions for future research.
II. MEDIA APPLICATIONS PERFORMANCE
perceived performance with the a focus on ecommerce applications [1].
III. MODALITY COST ANALYSIS (MCA)
Modality Cost Analysis is a methodology for assessing resource cost for each of the modalities of an application. In this methodology, the application is broken into a set of modalities and each is measured for resource cost (CPU, Network bandwidth, Storage, and Memory) in isolation. The rationale behind using isolated cost analysis rather than the aggregated cost of the application in its entirety is that the workload for different modalities varies dramatically, and aggregation may not capture these variations. For example when hosting a communication software on the Cloud , one customer may be a heavy instant messaging user, another may be a heavy video chat user. Instant messaging is CPU intensive while video chat is network bandwidth intensive. Using this methodology, the service provider will be able to allocate resources appropriately and accurately for these two different user profiles according to what they are going to be using.
When using modality cost analysis, resource cost is calculated separately, namely, the CPU cost, the Network cost, and the memory cost, and any other cost that might be relevant to the provider such as storage in scenarios where the application storage requirements are significant.
In order to simplify our methodology, we consider n tenants with their distribution denoted by T1, T2. … Tn. We consider m
modalities, and r resources. The provider can calculate the resources needed using the following formula:
where N is the modality cost of resource r.
For our experiments, for example, the CPU cost for instant messaging modality using OCS [12] was found to be 5.4 + 0.0007*X where X is the number of concurrent users being provisioned. The CPU cost for application sharing was found to be 3 + 3.45*X where X is the number of concurrent provisioned user. (These formulas were deduced by capturing CPU utilization while varying number of users; see section IV titled Experiments and Results). Therefore, a provider wanting to calculate the CPU cost with these two modalities can obtain it simply by the following:
(5.4 + 0.0007*X) + (3 + 3.45*X), i.e. simply summing the resource cost of each modality being provisioned.
IV. EXPERIMENTS AND RESULTS
In this section we present our early experiments with modality cost analysis. Two sets of experiments are performed. In the first set of experiments, we measure the resource overhead for four modalities in isolation, namely instant messaging, Voice over IP (VoIP), application sharing conference, and address book download. In the second set we measure the resource overhead for three scenarios that combine all of the four modalities together simulating a real end user experiment. The first scenario we name MCA-S for small load, the second one is MCA-M for medium load, and the third we name MCA-L for large load.
We illustrate the performance estimation based on the following hardware: A server with dual processors quad-core 2.0 GHz, 16 gigabytes of memory, 30GB disk space, and 2-port 1 gigabit per second network adapter. The hardware topology remains fixed during our experimentation.
We use Office Communications Server (OCS)[12] which is an enterprise real-time communications server, providing the infrastructure for enterprise instant messaging, data collaboration conferencing and multiparty Voice and Video calling. These features are enabled within an organization, between organizations, and with external users on the public internet.
We ran OCS on the above described hardware server. In the first experiment, we simulated users using instant messaging modality only (in isolation where no other modality is running). In experiment 2, we simulated users making VoIP calls with no other modality running. In experiment 3, we simulated users joining a conference call and sharing a power point presentation. In experiment 4, we simulated users querying an address book.
For the first experiment, we simulated 5000 users sending IM messages to each other at the same time. We measured the CPU utilization over a period of 4 hours and obtained the average. In addition, we captured network bandwidth and memory utilization. Then, we increased the load and simulated 10,000 simultaneous users, and finally we simulated 15,000 simultaneous IM users. Table 1 below shows the result of our data collection:
TABLE I. FIRST EXPERIMENT RESULTS
Instant Messaging Users CPU %/Server Network/Bytes Memory/Bytes
5000 6.21 1,596,403 117,435,418
10000 7.04 2,011,843 136,765,376
15000 7.70 2,317,056.51 141,518,365
TABLE II. SECOND EXPERIMENT RESULTS
VoIP Users CPU %/Server Network/Bytes Memory/Bytes
400 1.7 216,545 269,283,186
600 2.48 320,444.62 281,681,544
TABLE III. THIRD EXPERIMENT RESULTS
Application Sharing Conference
CPU %/Server Network/Bytes Memory/Bytes
100 users 6.95 7,164,641 517,244,781
200 users 11.06 9,990,548.47 793,322,894
250 users 14.53 13,589,203.86 991,254,808.25
TABLE IV. FOURTH EXPERIMENT RESULTS
Address Book Download CPU %/Server Network/Bytes Memory/Bytes
5000 entries 1.84 157,286 53,965,229
10000 entries 1.97 185,179.73 52,671,103
15000 entries 3.63 395,116.23 53,686,217
In the second experiment, we simulated 200, 400, and 600 users making VoIP calls simultaneously. Table 2 above shows the resource cost for each run.
In the third experiment, we simulated a conference call with application sharing and 100, 200, and 250 users connecting simultaneously. Table 3 above shows the resource cost for each run.
In the fourth experiment, we simulated 1000 simultaneous users downloading an address book with 5000, 10000, and 15000 contacts, respectively. Table 4 above shows the resource cost for each run.
Using the above results, a provider that wants to provision 10,000 IM users, 6,000 VoIP users, and 250 application sharing conference, will need (7.04 + 2.48 + 14.53 = ~24% of the CPU resource of one server), and (136,765,376 + 281,681,544 + 991,254,808.25 = ~ 1.4GB) of memory, as an example. Using such methodology, providers can plan their capacity to the exact needs without having to overprovision.
V. VALIDATION METHODOLOGY
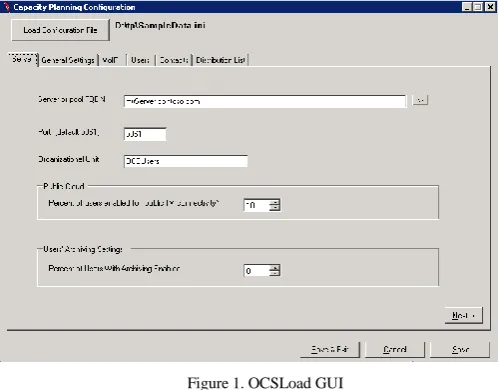
In the second set of experiments, we mixed the four modalities together to validate that measuring resources in isolation is an acceptable methodology for datacenter provisioning. In order to prove this hypothesis, we ran three experiments mixing IM, VoIP, address book download, and Application Sharing conference, using a tool called OCSLoad. OCSLoad generates a simulated load on Office Communications Server. For example, when we set up IM users, the tool will send instant messages between different simulated users based on the load that we specify (in this case, 5000 users sending instant messages (at a rate of 4 instant messages per user per hour). This user profile remains constant across all the experiments.
[image:3.595.82.510.132.201.2]The following image shows a snapshot of OCSLoad.
Figure 1. OCSLoad GUI
The first experiment we name MCA-S to simulate a user using all the four modalities in smaller quantities. To do this, we set up the same hardware that we used to run the modalities in isolation, and then we used OCSLoad and simulated the server with 5000 Instant Messaging users sending messages to each other where each user is sending 4 IMs/hour (the same load as when we ran the modality in isolation). Then we loaded 200 VoIP calls , 1000 users downloading 5000 contact simultaneously, and 100 users sharing a power point presentation (5 MB size).
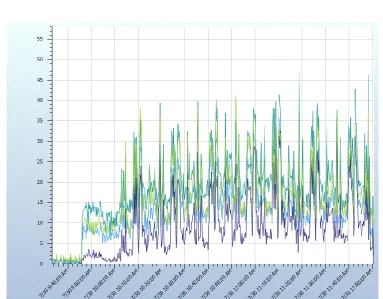
[image:3.595.307.557.357.552.2]In order to calculate the average, we ran the experiment on 4 servers independently. The chart presented in figure 2 below shows the CPU average for each of the servers.
As shown in figure 2, the averages for the four CPUs are 19.13, 13.81, 9.16, and 15.82 or an aggregate average of 14.48.
Also it is important to note that we ran the experiment for 2 hours and collected the data every ten minutes as shown in the chart.
TABLE V. MCA-SEXPERIMENT RESULTS
MCA
-S
CPU %/Server Network/Bytes Memory/Bytes
IM 5000 users 6.21 1,596,403 127,435,418
VoIP 200 calls 1.02 104,508 268,334,836
ABS 5000 contact 1.84 157,286 53,965,229
App Sharing Conference 100 users
6.95 7,164,641 517,244,781
Total of Isolated Measurements 16.02 9,022,839 956,980,264
Measured Resource Cost 14.48 8,382,582 1,086,426,806
[image:4.595.112.496.318.617.2]Diff -10.00% -7.10% 10 %
Figure 2. CPU average for each server
TABLE VI. MCA-MEXPERIMENT RESULTS
MC
A
-M CPU %/Server Network/Bytes Memory/Bytes
VoIP 400 calls 1.77 216,545 269,283,186
ABS 10000 contact 1.97 185,179.73 52,671,103
App Sharing Conference 200 users
11.06 9,990,548.47 793,322,894
Total of Isolated Measurements 21.84 12404116.38 1,252,042,559
Measured Resource Cost 19.89 11,676,771.20 1,304,269,858
Diff -1.95% -5.86% 4.17%
The second experiment we name MCA-M to simulate a user using all the four modalities in medium quantities. Table 6 above summarizes what we found.
The third experiment we name MCA-L to simulate a user using all the four modalities in large quantities. The outcome of that is summarized in table 7 below.
The results show that measuring modalities in isolation and using the results to provision datacenter is an effective methodology. The variance between measuring in isolation
and measuring the modalities running side by side is within +/-10%. In order to better plan for such variance, we recommend adding an adequate buffer for covering variation in side-by-side versus aggregated execution. 10% to 30% buffer is considered a minor buffer compared to current hardware overprovisioning estimates of 200-300% in best cases, and 5% to 10% of server resource utilizations in some of the worse cases [6].
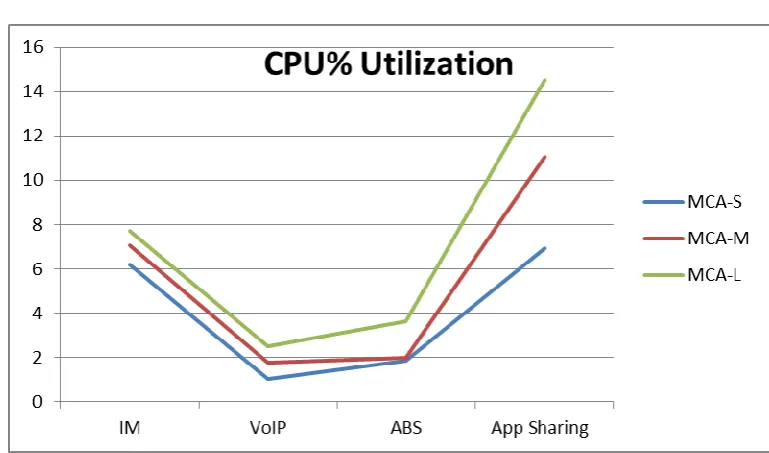
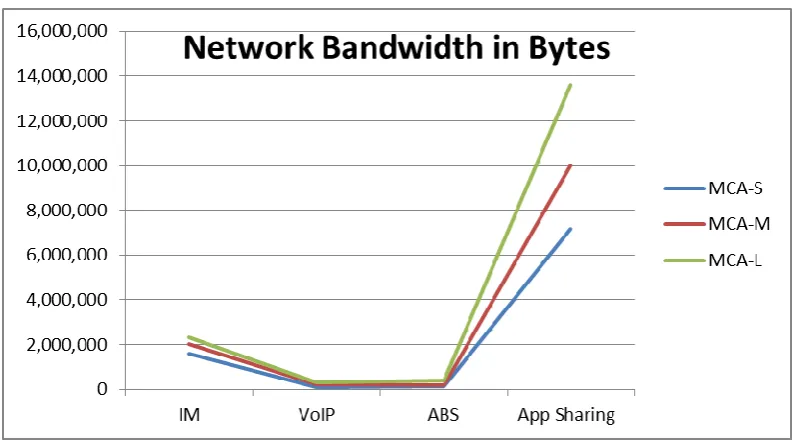
Figures 3,4 and 5 below compare the CPU utilization, Memory footprint, and Bandwidth utilization for the three runs.
TABLE VII. MCA-LEXPERIMENT RESULTS
MCA
-L
CPU %/Server Network/Bytes Memory/Bytes
IM 15000 users 7.70 2,317,056.51 141,518,365
VoIP 600 calls 2.48 320,444.62 281,681,544
ABS 15000 contact 3.63 395,116.23 53,686,217
App Sharing Conference 250 users
14.53 13,589,203.86 991,254,808.25
Total of Isolated Measurements 28.34 16,621,821.22 1,468,140,934
Measured Resource Cost 33.98 16,953,252.89 1,492,496,359
[image:5.595.110.495.485.711.2]Figure 3. CPU utilization
[image:6.595.105.506.98.560.2]Figure 4. Memory utilization
Figure 5. Bandwidth utilization
VI. RELATED RESEARCH
Datacenter provisioning and performance optimization has been an active research area for the past several years. Most of the research that we reviewed addresses dynamic provisioning [7-10] and virtualization [11]. Other research addressed resource provisioning in ecommerce applications [1-2]. Our research focuses on static provisioning in datacenters where the provider understands the user model and performance expectations but lacks the tools to provision according to exact
needs. The key factor that distinguishes our work form related efforts is that they consider all the application components in an aggregated manner while our research proposes and validates a methodology to measure each modality in isolation. Also our research simulates the methodology in commercial media application in use today.
VII. CONCLUSION &FUTURE WORK
[image:6.595.106.504.344.565.2]guide providers into provisioning datacenters for optimizing performance and cost. We also discussed how to validate the results. As one of future research directions, we want to address virtualization using modality cost analysis methodology and address any effects or limitations. This work can extensively benefit from virtualization to dynamically allocate resources based on usage profile. In order to achieve this, we plan to look at Windows Azure as a virtualization platform where we can deploy MCA and provision dynamically in order to reduce the total cost of ownership while not violating service license agreements.
REFERENCES
[1] Jijun Lu and Swapna S. Gokhale. “Resource Provisioning in an E-commerce Application”, IEEE Joint Conference on E-Commerce Technology (CEC'08) and Enterprise Computing, Commerce and E-Services (EEE'08).
[2] S. S. Gokhale and J. Lu., “Performance and availability analysis of e-commerce sites”, In Proc. 30th Annual Intl Computer Software and Applications Conference (COMPSAC’06), pages 495–502, 2006 [3] Ye Hu, Johnny Wong, Gabriel Iszlai and Marin Litoiu, “Resource
Provisioning for Cloud Computing,” Proceedings of CASCON 2009, November 2009.
[4] Alexander Lenk, Markus Klems, Jens Nimis, Stefan Tai, and Thomas Sandholm. What’s inside the cloud? An architectural map of the cloud landscape. In Proc. of the ICSE Workshop on Software Engineering Challenges of Cloud Computing, pages 23–31, 2009.
[5] Alexandra Fedorova , Margo Seltzer , Michael D. Smith, Improving Performance Isolation on Chip Multiprocessors via an Operating System Scheduler, Proceedings of the 16th International Conference on Parallel Architecture and Compilation Techniques, p.25-38, September 15-19, 2007
[6] Utilization and Datacenter productivity: http://www.ca.com/files/technologybriefs/dca-manager-tech-brief-us.pdf
[7] Bradley Simmons, Angela McCloskey, Hanan Lutfiyya, Dynamic Provisioning of Resources in Data Centers, Department of Computer Science, Proceedings of the third international conference on Autonomic and Autonomous Systems, 2007. ICAS07, June 2007. [8] Peter Bodík, Rean Griffith, Charles Sutton, Armando Fox, Michael I.
Jordan, David A. Patterson, Automatic Exploration of Datacenter Performance Regimes, Proceedings of the 1st workshop on Automated Control for Datacenter and Clouds, (ACDC09), Barcelona, Spain, June 2009.
[9] Vladimir Stantchev, Performance Evaluation of Cloud Computing Offerings, Proceedings of the 2009 Third International Conference on Advanced Engineering Computing and Applications in Sciences, pages 187-192.
[10] Truong Vinh Truong Duy; Sato, Y.; Inoguchi, Y.; Performance Evaluation of a Green Scheduling Algorithm, for Energy Savings in Cloud Computing, Parallel & Distributed Processing Workshops and Phd Forum (IPDPSW), 2010 IEEE International Symposium, April 2010, pages 19-23
[11] Chris Matthews, Yvonne Coady, Virtualized recomposition: Cloudy or Clear?, Software Engineering Challenges of Cloud Computing, 2009. CLOUD '09. ICSE Workshop, May 2009, pages 38-43.
[12] Microsoft. Microsoft Office Communications Server 2007 R2. http://www.microsoft.com/communicationsserver
[13] J. Allspaw. The Art of Capacity Planning: Scaling Web Resources. O’Reilly Media, Inc., 2008.
[14] Microsoft. Capacity Planning Tool for Office Communications Server
2007 R2.
http://www.microsoft.com/downloads/details.aspx?FamilyID=f8cbddd6-7608-4bbe-9246-16e96c62bef4&displaylang=en