http://dx.doi.org/10.4236/jmp.2014.59088
Disinfection of Microbes by Magnetized DC
Plasma
Ahmed Rida Galaly1,2, Hamdi Hussien Zahran3
1Physics Department, Faculty of Science, Beni-Suef University, Beni-Suef, Egypt 2Engineering Science Department, Faculty of Community, Umm Al-Qura University,
Makkah, KSA
3Department of Botany, Faculty of Science, Beni-Suef University, Beni-Suef, Egypt
Email: ahmed_galaly@yahoo.com
Received 28 April 2014; revised 26 May 2014; accepted 15 June 2014
Copyright © 2014 by authors and Scientific Research Publishing Inc.
This work is licensed under the Creative Commons Attribution International License (CC BY). http://creativecommons.org/licenses/by/4.0/
Abstract
A different combined effects for helium gas discharge such as: magnetic field strength, breakdown voltage, applied power, applied pressure, cathode fall thickness, edge effect, distribution of the electron temperature and density, and finally exposure time for Staphylococcus aureus substrate over slides at the cathode edge, are discussed under the influence of cold, nonthermal plasmas, ultra low pressure, and presence of the magnetic field for disinfection of bacteria for short expo- sure times, compatible to International Commission on Non-Ionizing Radiation Protection, Health Phys (ICNIRP) for healing applications. Furthermore, analyses of the experimental data of initial and final densities of cells alive, using survival curves, showed an impressive inhibitory effect of plasma discharge to the remaining survival of bacterial ratio under the influence of the magnetic field.
Keywords
DC Glow, Magnetic Field, Cathode Fall, Edge Effect, Non-Ionizing Radiation Protection, Health Phys ICNIRP
1. Introduction
are huge challenge for plasma diagnostics, it is necessary to supply the required knowledge on plasma sources for healing applications [1]. The application of a magnetic field on the discharge region results in enhancement of some attractive features of specific plasma sources [2]. Moreover there are many articles focusing on theoreti- cal and experimental study of factors of the sterilization of medical articles in low pressure glow discharge plasma [3], furthermore sterilization of medical products in low-pressure glow discharges and showing that roles of the various plasma agents in the inactivation of bacteria become the new fashion for applications of plasma [4] [5]. Also there are other methods to determine inactivation factors of spore-forming bacteria by plasma dis- charge such as: using low-pressure microwave plasmas in gas mixture, using Low-Pressure Radio-Frequency Oxygen Plasma and by using air plasmas at atmospheric pressure [6] [7].
Of late, it has been an important method in many non-equilibrium glow discharge plasma used in inactivation processes of microorganisms. Many studies have been carried out on plasma in a magnetic field, but most of them were about the effect of Extremely Low-Frequency (ELF) magnetic fields on the bacterial cell [8], that is, in which the magnetic field is not strong enough to make an ion do a cyclotron motion in the sheath before it strikes the target.
The present study aims to demonstrate the performance of magnetized direct current (DC) plasma for helium gas discharge in the disinfection process of cells alive. The inactivation processes for Staphylococcus aureus in the cathode fall (CF) region in magnetized DC helium plasma is investigated under the influence of some para- meters such as: different magnetic field strengths from strong permanent magnet, CF thickness, breakdown vol- tages, applied electric powers, applied gas pressures, and different exposure times for Staphylococcus aureus substrate over slides at the cathode edge, under the control of cold, non-thermal plasmas, ultra low pressure, and presence of the magnetic field for disinfection of bacteria for short exposure times and for complete sterilization, compatible to International Commission on Non-Ionizing Radiation Protection, Health Phys (ICNIRP) for heal- ing applications.
2. Experimental Setup
2.1. Electrical Circuit
Figure 1(a) shows the magnetized DC plasma electrical circuit and the plasma cell. The DC plasma structure consists of a stainless steel chamber that has two glass ports, connected to vacuum system. The pump speed was about 105 lit./sec. and the vacuum of a about 10−5 torr at room temperature. An oil trap was used to eliminate the impurities from reaching the discharge system. During all measurements, a continuous gas flow through the discharge vessel was maintained to sweep out the impurities. The gas was fed to the discharge tube using a needle valve. The pressure of the system was measured using two types of gauges, a dial gauge (Edward’s type CG3) which covers the range from 20 to 0.1 mbar and a thermocouple gauge type 77MT-2, covers the range from 0.5 down to 5 × 10⁻⁵ torr.
Figure 1(b) shows The geometry and the dimension of two hollow permanent circular magnets are placed bounded the cathode surface to produce the magnetic field, Each of them has a maximum magnetic field strength of 200 Gauss and with radial diameter 80 mm and hollow at the center of the magnet for the cathode position with the same diameter 50 mm, where the radial and axial distribution for the magnetic field strengths as measured by MG-4D Hall probe, which is a fully moveable hand-held Hall effect gauss meter.
2.2. Microbial Material Reaction with Plasma and Preparing
Biological material can be exposed to plasma by direct exposure, where the treated slides position is at the ca- thode edge (containing Staphylococcus aureus bacteria) are in direct contact with the magnetized DC plasma. All plasma generates agents, including charged particles, and come in contact with the sample (slides containing bacteria). As the amount of heat transmitted to the sample is increased, the charged particles play a role as they sputter the sample, and many of the short-lived neutral reactive species also reach the sample.
To show a clear illustration effect of the plasma discharge on inactivation process of Staphylococcus aureus bacterium, and to express it in an observable way, a hollow permanent magnet is placed surrounded the cathode to increase the inactivation efficiency.
2.2.1. Isolation and Cultivation of Bacteria
collected from patients. The cultured bacteria on agar plates will be identified according to the appearance of colonies, growth conditions and metabolic enzymatic activities.
2.2.2. Preparing Staphylococcus aureus Microbes Slides
a. Mannitol Salt Agar
Mannitol Salt Agar is a special bacterial growth medium that is selective for halophiles and can differentiate pathogenic and nonpathogenic Mannitol Salt Agar is used for the isolation of staphylococci. Chapman formu- lated Mannitol Salt Agar to isolate staphylococci by inhibiting growth of most other bacteria with a high salt concentration. Chapman added 7.5% Sodium Chloride to Phenol Red Mannitol Agar and noted pathogenic strains of staphylococci (coagulase-positive staphylococci) grew luxuriantly and produced yellow colonies with yellow zones [9]. Nonpathogenic staphylococci produced small red colonies with no color change to the sur- rounding medium. Mannitol Salt Agar is highly selective, and specimens from heavily contaminated sources may be streaked onto this medium without danger of overgrowth. Mannitol Salt Agar is recommended for iso- lating pathogenic staphylococci from clinical specimens, cosmetics, and microbial limit tests.
b. Principles of the microbiological sample Procedure
Principles of the Procedure depend on Enzymatic Digest of Casein, Enzymatic Digest of Animal Tissue, and Beef Extract provides the nitrogen, vitamins, and carbon in Mannitol Salt Agar. D-Mannitol is the carbohydrate source. In high concentrations, Sodium Chloride inhibits most bacteria other than staphylococci. Phenol Red is the pH indicator. Agar is the solidifying agent. Bacteria that grow in the presence of a high salt concentration and ferment mannitol produce acid products, turning the Phenol Red pH indicator from red to yellow. Typical pathogenic staphylococci ferment mannitol and form yellow colonies with yellow zones. Typical non-patho- genic staphylococci do not ferment mannitol and form red colonies [10].
Formula (g/l)
Enzymatic Digest of Casein 5
Enzymatic Digest of Animal Tissue 5
Beef Extract 1
D-Mannitol 10
Sodium Chloride 75
Phenol Red 0.025
Agar 15
Final pH: 7.4 ± 0.2 at 25˚C
[image:3.595.98.533.360.674.2](a) (b)
c. Methods
Our method depends on suspend 111 g of the medium in one liter of purified water. Heat with frequent agita- tion and boil for one minute to completely dissolve the medium. Autoclave at 121˚C for 15 minutes. Staphylo- cocci will grow on this medium, while the growth of most other bacteria will be inhibited. Coagulase-positive staphylococci will produce luxuriant growth of yellow colonies and may have a yellow halo around the colony. Coagulase-negative staphylococci will produce small colorless to pink colonies with no color change to the me- dium.
2.3. The Survival Curve
Generally survival curves take different shapes [11] (single slope, Two-Slope, Three-Slopes) depending on the type of microorganism, the type of the gases supporting the microorganisms, and the relationship between CFU/ml (cfu: colony-forming unit) and the exposure (reaction) time. Quantifying Sterilization Efficacy due to Equation (1):
10
Population before treatment Effect of Serilization Log
Population after treatment
=
(1)
where N0 is the initial population, and Ns is the surviving population.
2.4. Experimental Conducts for Microbiological Samples with Plasma
Viable suspension of Staphylococcus aureus was spread-plated onto slides containing nutrient agar under the in- fluence of many parameters such as magnetic field strength, discharge power, gas pressure, and exposure time. The tests were conducted as follows:
1) Staphylococcus aureus is used in the present study. An overnight culture containing approximately 108 cell-forming unit per milliliter (cfu/ml) was prepared. One of the slides was kept as control, whereas the others were exposed to the helium plasma discharge for different parameters. The plasma was in contact with the agar (the plasma discharge cover the slides). After exposure, the slides were incubated overnight at 37˚C for 24 hrs.
2) At different exposure times, the series of the inoculated slides containing five slides were exposed to he- lium discharge, constant magnetic field strength of 400 Gauss, 3 mJ discharge power, and 0.53 mbar.
3) At different applied magnetic field strengths of 200 and 400 Gauss, constant exposure time of 30 min, 3 mJ discharge power, and 0.53 mbar.
4) At different applied power range (0.5, 1.5, and 3 mJ), constant magnetic field strength of 400 Gauss, expo- sure time of 30 min, and 0.53 mbar.
5) At different applied pressures of 0.27 and 0.53 mbar, constant magnetic field strength 400 Gauss, 3 mJ dis- charge power, exposure time of 30 min, and 0.53 mbar.
6) Two plates were kept as control, by not exposing to the previous conditions.
3. Results and Discussion
3.1. Distribution of the Magnetic Field Strengths
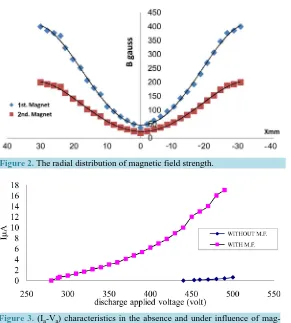
Figure 2 shows the radial distribution of the magnetic field strength B measured for two different magnets with two different maximum magnetic field strengths of 200 and 400 Gauss, respectively, by using the Hall probe across the diameter of the cathode surface from one edge to the other. It observed that for the radial distribution, B was maximum at the two cathode edges and minimum at the center of the cathode and hollow magnets. Moreover for the axial distribution, B was maximum at the cathode surface, then it decreases far from the ca- thode, i.e. towards the anode (passing through the negative glow and positive column regions).
3.2. Breakdown Potentials
Figure 2. The radial distribution of magnetic field strength.
Figure 3. (Ia-Va) characteristics in the absence and under influence of mag- netic field at pressure 0.27 mbar.
Figure 4. (Ia-Va) characteristics in the absence and under influence of mag- netic field at pressure 0.53 mbar.
tion potential of helium. Moreover, values of the current discharge in the presence of the magnetic field for he- lium is larger than those in the absence of the field; thus the slopes of the curves are larger (i.e., the resistance of the discharge is small in the presence of the magnetic field) [12].
[image:5.595.173.464.79.402.2] [image:5.595.174.456.425.573.2]3.3. The Power Characteristic Curves of the Helium Gas Discharge
As shown in Figure 5, in the absence of the magnetic field, the power characteristic curves of helium gas at pressures ranging from 0.27 to 4 mbar was between 0.3 and 25 mJ. When the external magnetic field is applied as shown in Figure 6 for the same parameters, the curves are similar to those without magnetic field but the power range increased to between 0.38 and 48 mJ. The reasons for the increase in the power under the influence of the magnetic field can be summarized in the following discussion:
1) When the magnetic field is applied, the cathode fall (CF) and negative glow regions are compressed, re- sulting in decreased length of the CF region (dc). Therefore, higher values of potential are expected. This will, of course, increase the electric field and the power in this region. Consequently, ions would accelerate more and efficient sputtering would increase, as well as the increase in the density of the plasma. Thus an increase in the magnetic field, the power, and the plasma density renders it compatible with many processes such as inactiva- tion process for alive cells of microorganisms [14].
2) According to guidelines of the International Commission on Non-Ionizing Radiation Protection (ICNIRP), nonhealing and nonelective ultraviolet radiant exposure of the skin in the spectral region 180 - 400 nm should not exceed 3 mJ/cm2. This value should be applied for the most sensitive, nonpathologic skin phototype (known as “melano-compromised”) [15].
Then by reason of our results from our previous study for argon discharge [16] and this study on helium dis- charge, As shown in Figure 5, in the absence of the magnetic field, the power range was 0.3 - 2.8 mJ for applied pressure 0.53 - 1 mbar, suitable as per ICNIRP guidelines andFigure 6 shows that in the presence of the mag- netic field, the power range was 1.5 - 3 mJ for applied pressure 0.27 - 0.53 mbar, which is also suitable for ICNIRP. Therefore, UV spectrum of helium discharge at low pressure as shown in Figure 7 is suitable for inac- tivation process as per the guidelines of ICNIRP, impact on skin at low pressures is well investigated particular- ly in dermatology because excess UV exposure causes detrimental effects on skin.
3.4. The Radial Distribution of the Electron Temperature and Density
The electron temperature and densities can be measured using the double probe method [17] [18], the double probe was moved radially from the edge to the center of the cathode (i.e., its direction perpendicular to the di- rection of the electric field lines), at different pressures ranges to investigate the radial distribution for CF region specially (in terms of the place of the treatment and disinfection of microbes). Figure 8 and Figure 9 show the temperature and density distribution of the CF region in the presence and in the absence of the magnetic field at different pressures (at center and edge) respectively. These figures clearly show the distribution profiles of Te, where Te is decreased, Ne continues to increase for the CF region. There is clearly a general trend that shows that values of Te and Ne are inversely proportional (Te × Ne = constant); the maximum value of one is found where the minimum value of the other is seen.
Under the influence of the magnetic field on Te and Ne for the CF region, the plasma is very intense (very thin bright ring) [19] [20], where the radial distributions of the electron density has its highest value at the edge, whereas the magnetic field is maximum, as shown in Figure 8. The electron temperature changes very little. The density begins to increases at the CF region at the edge more than at the center, as shown in Figure 9. This may be related to the distribution of the magnetic field, also because of the “edge effect” that caused because of the concentration of the electric field near the edge of the cathode [21].
3.5. Cathode Fall Thickness
It is noticed in our previous study [22] [23] that a reduction of the cathode fall (CF) thickness (dc) (about 37%) for helium and 33% for argon occurs in the presence of the magnetic field at the edge of the cathode, as shown in Figure 10. Thus, a stronger electric field is produced and consequently more acceleration of the ions is ex- pected that enhances the sputtering processes rate of the edge cathode surface. Moreover, values of Te decreased by increasing the gas pressure, whereas Ne increased by increasing the gas pressure. This may be attributed to the increase in the number of electron-atom collisions and consequently, increasing the rate of ionization at higher pressure.
Figure 5. The power characteristic curves of the helium gas discharge in the absence of M.F.
[image:7.595.172.453.276.415.2]Figure 6. The Power characteristic curves of the Helium gas discharge in the Presence of M.F.
Figure 7. UV spectrum of helium discharge at low pressure in the presence of magnetic field.
[image:7.595.173.456.563.692.2]Figure 9. The temperature and density distribution of cathode fall region in the presence of M.F. at different pressures (at edge).
Figure 10. The effect of the magnetic field on the reduction of the cathode fall.
the presence of the magnetic field, where the radial distributions of the electron density were high at the edge with higher magnetic field strength than at the center as shown before through Sections 3 and 4.
3.6. Survival Curves
In this study, our target for helium discharge is the survival curves under magnetized DC plasma at the cathode edge. The results were focused on the influence of many parameters such as magnetic field strength, discharge power, gas pressure, and exposure time.
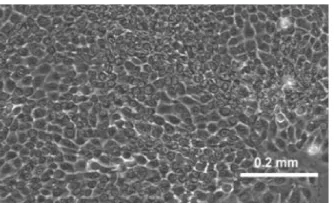
Figure 11 shows the inactivation process of Staphylococcus aureus bacteria. Moreover Figure 12 shows the effect of magnetic field strength on inactivation process after exposure time of 30 min, where the residual survived microbes ratio reach 45% for applied 200 Gauss and decreased to 10% for 400 Gauss.
[image:8.595.172.455.83.221.2] [image:8.595.174.455.259.421.2]Figure 11. Inactivation process of Staphylococcus aureus bacteria.
Figure 12. The effect of M.F. strength on inactivation process after exposure time 30 min.
Figure 13. The bacterial inactivation rate with the power range (MJ).
Figure 14. survival curves of Staphylococcus aureus spores under influnce of 400 gauss.
4. Conclusions
[image:9.595.175.454.348.491.2] [image:9.595.177.455.516.636.2]fluence of magnetized DC plasma, there are many evidences of its effect such as:
1) When magnetic field is applied, the CF and negative glow regions are compressed, therefore, higher values of potential are expected.
2) A magnetic field is applied such that field lines enter and leave through the cathode plate. Gas ions in the plasma are unconfined by the magnetic field. They are accelerated toward the cathode and strike it at high ener- gy. In addition to sputtering Staphylococcus aureus target, the impact of ions produces secondary electron emis- sion. These electrons are accelerated back into the plasma and are confined near the cathode by the magnetic field.
3) Because of the increase in magnetic field strength B, the Larmor radius [LR] decreases, and the diffusion coefficient across the field is reduced, and therefore, the electron temperature decreases. Moreover, the density of the plasma increases and becomes denser over the Staphylococcus aureus microbes in the same region of the effected magnetic field, especially at the edge more than the center. When using the magnetic field, the exposure time decreases to approximately half the value compared to those in the absence of the magnetic field.
4) Increasing magnetic field strength, low gas pressure, low discharge power, edge effect, and plasma density are very important parameters affecting the inactivation process of microbes and survival curves behavior. Any- way, sterilization is achieved in all cases; inactivation of bacterial cells is ultimately the result of the DNA de- struction by UV photons. Finally, in the survival curves under the influence of the magnetic field, there are two phases that are sufficiently cleared from debris for the UV photons to finally kill them.
References
[1] Laroussi, M., Mendis, D.A. and Rosenberg, M. (2003) New Journal of Physics, 5, 41.
http://dx.doi.org/10.1088/1367-2630/5/1/341
[2] Soloshenko, I.O., Khomich, V.A., Tsiolko, V.V., et al. (1999) Theoretical and experimental study of the factors of the sterilization of medical articles in low pressure glow discharge plasma Proceedings of the 14thInternational Sympo- sium on Plasma Chemistry, Prague, 2-6 August 1999, 2551-2556.
[3] Soloshenko, I.A., Tsiolko, V.V. and Khomich, V.A. (2000) Plasma Physics Report, 26.
[4] Lu, X., et.al. (2008) Journal of Applied Physics, 104, Article ID: 053309. http://dx.doi.org/10.1063/1.2977674
[5] Singh, M.K., Ogino, A. and Nagatsu, M. (2009) New Journal of Physics, 11, Article ID: 115027.
http://dx.doi.org/10.1088/1367-2630/11/11/115027
[6] Vicoveanu, D., Ohtsu, Y. and Fujita, H. (2008) Japanese Journal of Applied Physics, 47, 1130.
http://dx.doi.org/10.1143/JJAP.47.1130
[7] Laroussi, M. (2002) IEEE Transactions on Plasma Science, 30, 1409-1415.
http://dx.doi.org/10.1109/TPS.2002.804220
[8] Kakikawa, M. and Yamada, S. (2012) IEEE Transactions on Magnetics, 48, 2869-2872.
http://dx.doi.org/10.1109/TMAG.2012.2200881
[9] United States Pharmacopeial Convention (2007) The United States Pharmacopeia. 31st Edition, The United States Pharmacopeial Convention, Rockville.
[10] Directorate for the Quality of Medicines of the Council of Europe (EDQM) (2007) The European Pharmacopoeia. Council of Europe, Strasbourg.
[11] Laroussi, M. and Leipold, F. (2004) International Journal of Mass Spectrometry, 233, 81-86.
http://dx.doi.org/10.1016/j.ijms.2003.11.016
[12] Bohm, D. (1949) The Characteristics of Electrical Discharge in Magnetic Fields. McGraw-Hill,New York.
[13] Chapman, B. (1980) Glow Discharges Processes. Wiley, New York.
[14] Laroussi, M. (2005) Plasma Processes and Polymers, 2, 391-400.
[15] ICNIRP—International Commission on Non-Ionizing Radiation Protection (2004) Health Physics, 87, 171-186.
http://dx.doi.org/10.1097/00004032-200408000-00006
[16] Galaly, A.R. and El Akshar, F.F. (2013) Physica Scripta, 88, Article ID: 065503. [17] Chen, F.F. (1965) Plasma Diagnostic Techniques.Academic, New York.
[18] Brown, S.C. (1966) Introduction to Electrical Discharges in Gases. Wiley, New York.
[20] Simonchikpp, L., Pitchfordpp, L. and Safronau, Y. (2012) Effect of the Cathode Surface Temperature on the Cathode Fall Layer Parameters ESCAMPIG xxi Conference,Viana do Castelo, 10-14 July 2012.
[21] Yasuda, H.K., Tao, W.H. and Prelas, M.A. (1996) Journal of Vacuum Science and Technology A, 14, 2113.
http://dx.doi.org/10.1116/1.580089
[22] Galaly, A.R. and El Akshar, F.F. (2013) Physica Scripta, 88, Article ID: 065503.
[23] Galaly, A.R. (2014) Determination of the Cathode Fall Thickness in the Magnetized DC Plasma for Helium Gas Dis- charge. Proceedings of theIMEPS, International Middle East Plasma ScienceConference, Belek-Antalya, 23-25 April 2014.
[24] Galaly, A.R.and Zahran, H.H. (2013) Journal of Physics: Conference Series (IOP), 431, Article ID: 012014.
currently publishing more than 200 open access, online, peer-reviewed journals covering a wide range of academic disciplines. SCIRP serves the worldwide academic communities and contributes to the progress and application of science with its publication.