Munich Personal RePEc Archive
About SES educational expectations:
interrelations in the determination of
higher education baccalaureate
attainment.
Milagros, Nores
Brown University
April 2007
About SES & educational expectations: interrelations in the
determination of higher education baccalaureate attainment.
Introduction
Community colleges and four-year colleges provide two differing alternatives to post secondary education. High school seniors face several options upon high school completion: entering the labor market, entering a community college (for a two-year degree or as a step towards a baccalaureate) or attending a four-year institution. Selection into each of these is clearly not a random process, but one related to previous educational experiences, family characteristics and social class, and educational expectations, among others. Previous studies on attainment have either tried to measure baccalaureate attainment (Dougherty, 1987, 1992 & 1994; Leigh and Gill, 2003; Rouse, 1994 & 1995; Whitaker & Pascarella, 1994; among others), or labor market returns for either type of students (Grubb, 2002a –who provides a thorough review of previous studies- & 2002b; Kane & Rouse, 1995; Monks, 2000; Whitaker & Pascarella, 1994; among others).
Originally, community colleges appeared to provide a higher educational opportunity to a greater amount of students. This democratization effect was evidenced by the large enrollment increases in the sector in the last three decades (Brint & Karabel, 1989; Rouse, 1994; Grubb, 2002a). However, community college critiques state that this option only diverts students from the academic track, and in its stronger critique, it reinforces four-year institution’s elitism (Bowles & Gintis, 1976; Brint & Karabel, 1989; Karabel, 1972). Either way, these institutions do in fact exist as an important alternative to four-year higher education tracks. As such, they are an additional choice in the spectrum of higher education. Who chooses this option is a matter of concern. Do these institutions serve as higher education options or as a true route to baccalaureate education? Do they raise educational attainment?
Such issues have developed into an extensive literature on the democratization versus the diversion effect, which has its foundations in the functionalist versus the class-reproduction theorists’ confrontation over community colleges. While the former pose that these colleges serve societies needs in technical skills and social mobility, the latter argue that these serve as an additional mechanism for class reproduction in a capitalist economy (Dougherty, 1987).
What is evident from the existing literature in post secondary education is that selection bias is central in the comparison among types of institutions and student’s educational attainment. That is, we assume that high school graduates act as rational individuals that choose among the options available for post secondary education. These choices are the consequence of supply side variables (such as proximity, education laws, tuition levels, etc.) as well as demand side variables (access to funding, aspirations, labor market characteristics-returns-, abilities, interests, etc.). As a result of self-selection, it has been argued that: (a) most students attending two-year colleges would not have attended post-secondary education at all if such options were not accessible; and (b) community colleges operate to “cool-out” aspirations and reduce educational attainment by enrolling students that would otherwise have attended a four year institution (Grubb, 2002: p. 302).
to attainment. Her work provides evidence of a rational behavior on the part of two-year college students who respond to price and proximity of such institutions (1994), and of the existence of primarily a democratization effect (1994 & 1995).
Moreover, the importance of self-selection is furthered evidenced by the nature of the students that attend community colleges versus four-year institutions. As a consequence of the lower costs, and lack of admission requirements, community colleges have become the “postsecondary institution disproportionately used by disadvantaged groups to gain access to employment”, especially for African-American and Hispanics. (Grubb, 2002a: p. 312). Among immigrants, Hispanics dominantly choose non-enrollment into higher education, and about a quarter choose enrollment in four-year institutions and a third in two-year colleges (Hagy & Staniec, 2002).
Conversely, because the nature of the problem of self selection lies on the choices of students, and because their choices affect the probability of them attaining a baccalaureate degree, one issue for policy makers is whether the incentives defining such choices can be addressed. Some early (K-12) intervention programs are based on the assumption that educational expectations can be constructed and consequently educational attainment profiles increased. Such types of programs attempt to change children’s own perception of what they can achieve. These are based on the assumption that socioeconomic background, peer characteristics, and teacher’s perceptions of students’ abilities and future mold expectations. On the other hand, these same covariates are determinants of college attendance choice. Therefore, the plausibility that endogeneity between educational aspirations and socioeconomic background does exist is high. Both Leigh and Gill’s analysis and Rouse’s analysis do not take this into account when modeling college attendance choices through educational aspirations, where SES and aspirations are considered independent covariates that determine choice.
As a result, this paper proposes a variation on the work by Rouse (1995) and Leigh and Gill (2003) by inquiring into the effect of SES in relation to students’ educational expectations. It builds on the weaknesses of these two models. The underlying hypothesis is that expectations are not independent from SES and therefore examining social class differences and their interaction with educational expectations would support the theory of endogeneity between educational expectations and socioeconomic background. Moreover, instead of having to instrument for educational expectations, we directly control for expectations and interactions between SES and expectations, as well as considering variations to modeling SES. Breaking SES into quintiles allows analyzing the effect of class and their relation to the probability of attending community colleges vs. four-year institutions. Likewise, and in contrast to Rouse (1995) and Leigh and Gill (2003), we account for the binary character of the dependent variable and use alternative estimation methods for bounded probabilities.
Model
(i) BACi =Xiβ +Γ2D2i +Γ4D4i +εi
where,
i
BAC = measure of individual BA attainment / completed years of full time equivalent years of education
i
X = measures for individual covariates (gender, race, observable ability, and institutional characteristics)
i
D2 = measure of community colleges accessibility
i
D4 = measure of four year institutions accessibility
This reduced form equation attempts to measure individual attainment through the lens of the democratization effect mentioned earlier; that is, an increased in the supply of community colleges should imply increased educational opportunities. However, to measure the full effect of community colleges (that is, the diversion effect) the author stipulates the following simultaneous equation structural model:
(ii) BACi =Xiβ0 +α2A2i +α4A4i +λSi +μi
(iii) A2i =Xiθ2 +γiD2i +ϕiD4i +λ2Si +μ2i
(iv) A4i = Xiθ4 +γiD2i +ϕiD4i +λ4Si +μ4i
where,
i
A2 = choice of starting at a 2 year college
i
A4 = choice of starting at a 4 year college
i
S = individual expectations of schooling
In this model, the coefficient on the two-year college choice measures the democratization effect (α2), while the difference among the two-year and the four-year choice (α2-α4) represents the
diversion effect. That is, the first coefficient measures the effect of choosing the community college on attainment, and the latter difference measures the effect of attending a two-year institution when a four-year institution is available.
On the other hand, Leigh and Gill (2003) state that Rouse’s estimations are flawed because they “do not include information on educational aspirations.” (p.24) The authors use data from the
National Longitudinal Survey of Youth (NLSY) to provide ‘better’ estimates of the democratization versus the diversion effect, with the use of ‘observable’ measures of desired level of schooling. However, in terms of the choice of institution –selection-, in due of them not having any valid instruments, the authors just control on observables and apply OLS on Rouse’s equation (ii). Their estimations evidence a larger democratization effect.
Consequently, we suggest three variations on the basis of these models: (a) instrument for choice but including variables of educational expectations; (b) consider SES in terms of quintiles, to measure how where a person is in the social distribution determines choice and attainment; and (c) interact SES quintiles with educational expectations under the hypothesis that there is some probable endogeneity which manifests itself in these interactions.
We propose breaking the SES variable contained in the X covariates into quintiles, and define the following structural form:
(v) BACi =SESQiδ + X1iβ1 +α2A2i +α4A4i +ηSi +ρSESQi *Si +μi
(vi) A2i =SESQiδ + X1iθ2 +γiD2i +ϕiD4i +η2Si +ρ2SESQi *Si +μ2i
(vii) A4i =SESQiδ + X1iθ4 +γiD2i +ϕiD4i +η4Si +ρ4SESQi *Si +μ4i
While the alpha coefficients still provide the estimations of the diversion and democratization effects, the effect of desired level of schooling now depends on the quintile (effects on slopes), and each quintile defines different level effects (intercepts) for all three equations.
Moreover, both papers estimate linear equations. However baccalaureate attainment is a dichotomous (0, 1) variable. Therefore, these estimations are estimations of unbounded probabilities of attaining a bachelor’s degree (versus non attainment). Unbounded linear estimations of probabilities can be a problem in the extremes, especially if estimated probabilities are below zero or above one.
In due that Leigh and Gill use a linear estimation method with a binary dependent variable, a more appropriate method would be one that accounts for the discrete character of y. Therefore, we re-estimated the model using a logit model where our observed structure:
=
i
y 1 if yi* >Bacc
0 if yi ≤Bacc
*
Overall, this will imply three sets of estimations (with SES as a linear variable, with quintiles and with interactions) for four types of estimation methods: (1) Leigh and Gill’s OLS; (2) Logit estimation of (1); (3) IV estimations as Rouse’s; and (4) a Bivariate Probit approach for (3)1.
Dataset
This paper uses the National Educational Longitudinal Study (NELS: 88), which surveys a nationally representative sample of students who were enrolled in the eight grade in 1988. The survey counts with questionnaires administered to the student, the student’s parent, two teachers and the school administrator that supply a large amount of information on the school, the family and the student him/herself. Follow-up surveys were applied through four follow-ups in 1990, 1992, 1994, and 2000. This paper uses a random sample (9,000 students) of the whole survey (over 13,000 students), with the corresponding weights, for a nationally representative analysis.
To instrument for choice in the IV estimations and for the bivariate probit estimations, we used information on the number of colleges (two- versus four-year colleges) and an average of tuition levels (also for two- versus four-year institutions) weighted by sector participation (public versus private). These instruments on post secondary education accessibility are similar to Rouse’s (1995) model. The information is drawn from IPEDS data summarized in the Digest of Education Statistics (Tables 218 -1988- and Table 280 -1989-) of the National Center of Education Statistics (U.S. Department of Education).
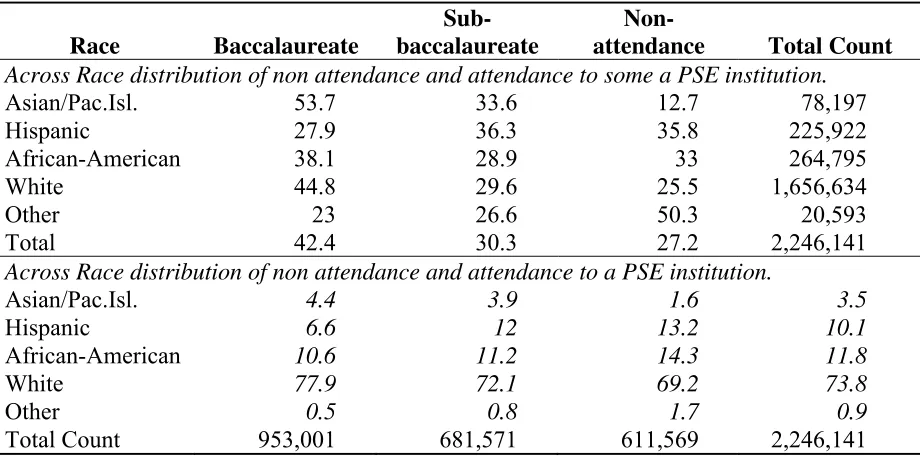
Of our weighted sample, 39.9% attended a baccalaureate institution While 28.8% attended a sub-baccalaureate one. The population is half male and half female, predominantly white (72.2%), and 11.8%, 10.2% and 3.6% are correspondingly African-American, Hispanic and Asian. Moreover, and in line with what was said about minority student participation in community colleges (Grubb, 2002a), although a vast majority of students attending either type of institutions are white, Hispanics predominantly concentrate on two-year institutions (36.3%) While White (44.8%) and Asians (53.7%) concentrate on four-year institutions (Table 1). African-Americans also attend the latter (38.1%) in higher proportions than the former (28.9%). Non attendance to post-secondary education is highest amongst Hispanics, followed by African-Americans.
1
Table 1. Weighted cross-tabulations of enrollments by type of institutions and race.
Race Baccalaureate Sub-baccalaureate
Non-attendance Total Count
Across Race distribution of non attendance and attendance to some a PSE institution.
Asian/Pac.Isl. 53.7 33.6 12.7 78,197
Hispanic 27.9 36.3 35.8 225,922
African-American 38.1 28.9 33 264,795
White 44.8 29.6 25.5 1,656,634
Other 23 26.6 50.3 20,593
Total 42.4 30.3 27.2 2,246,141
Across Race distribution of non attendance and attendance to a PSE institution.
Asian/Pac.Isl. 4.4 3.9 1.6 3.5
Hispanic 6.6 12 13.2 10.1
African-American 10.6 11.2 14.3 11.8
White 77.9 72.1 69.2 73.8
Other 0.5 0.8 1.7 0.9
Total Count 953,001 681,571 611,569 2,246,141
From our sub-sample of students, we are only considering those who participated in the base year and all subsequent follow-ups. Moreover, since we are modeling choice and its effect on attainment, we are additionally restricting the sample to high school graduates enrolled in some type of post secondary institution. This leaves non-enrollment out of the equation. Overall, this amounts to a loss of 30% of the observations. An additional 7% are lost in the estimation equation due to missing data on observables.
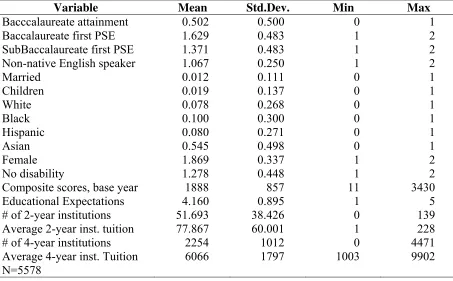
Table 2. Summary statistics.
Variable Mean Std.Dev. Min Max
Bacccalaureate attainment 0.502 0.500 0 1
Baccalaureate first PSE 1.629 0.483 1 2
SubBaccalaureate first PSE 1.371 0.483 1 2
Non-native English speaker 1.067 0.250 1 2
Married 0.012 0.111 0 1
Children 0.019 0.137 0 1
White 0.078 0.268 0 1
Black 0.100 0.300 0 1
Hispanic 0.080 0.271 0 1
Asian 0.545 0.498 0 1
Female 1.869 0.337 1 2
No disability 1.278 0.448 1 2
Composite scores, base year 1888 857 11 3430
Educational Expectations 4.160 0.895 1 5
# of 2-year institutions 51.693 38.426 0 139
Average 2-year inst. tuition 77.867 60.001 1 228
# of 4-year institutions 2254 1012 0 4471
Average 4-year inst. Tuition 6066 1797 1003 9902
N=5578
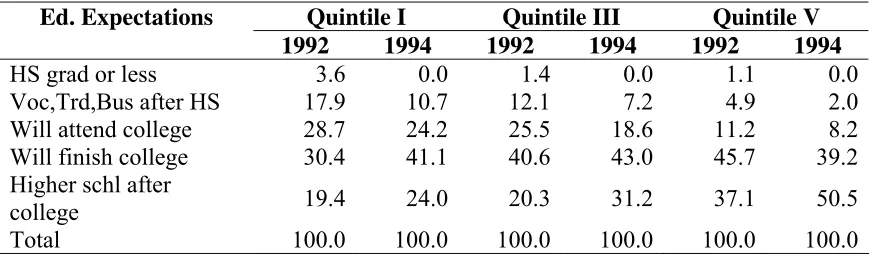
In terms of the relation between aspirations and SES, the data provides information on educational expectations for the students’ 12th grade (1992), their high school senior year, and two years after their theoretical graduation date of high school (1994). Expectations have been coded for complete and incomplete levels of education; that is, high school or less, vocational or trade degree (certificates and associates), attend college, complete college, and higher schooling after the baccalaureate. Coding students separately who expect to attend college from students who expect to complete it makes special sense when considering that by not expecting to finish a bachelor’s degree, this group of students is limiting itself ex ante.
While a higher percentage of the lower SES groups have educational expectations for lower education levels (HS or less and vocational or trade education) than of higher SES groups, this relation is inverted for expectations of finishing college and graduate school. Except for students expecting to finish college, where the three highest quintiles converge. Expectations by grade twelve are in fact ordered according to SES.
In time, the order varies little. Lower quintiles expect lower educational outcomes and higher quintiles expect higher, as anticipated. Nevertheless, by 1994, the expectation of finishing college converges for the three middle quintiles, While the highest quintiles expectation of graduate school increases significantly.
concentrates students for the 1st and 2nd quintile (around 30% each). As educational expectations increase, the distributions move to the right, with about 25% of students from the 3rd and 4th quintile expecting to finish college versus 13% from the 1st quintile. The group that expects graduate education pools students mainly from the 5th quintile (38%).
[image:10.612.87.527.266.382.2]Overall, these distributions across and within socio-economic quintiles do in fact suggest that there are common patterns on expected schooling attainment levels. This preliminary analysis provides prima face evidence that these two variables are interrelated, and may even be endogenous (although this can not be hereby inferred). Our subsequent linear estimations attempt to look at this relationship more closely, in terms of their effect on the probability of baccalaureate attainment for students starting in both, two- and four-year institutions.
Table 3. Distribution of Educational Expectations within choice of first PSE, 1992 & 1994.
1992 1994 Ed. Expectations
% Bacc % Subbacc % Bacc % Subbacc
HS grad or less 0.26 1.92 0.0 0.0
Voc, Trade after HS 0.87 13.65 0.6 7.2
Will attend college 3.88 23.53 2.3 18.8
Will finish college 43.49 37.14 31.4 42.2
Higher schl after college 51.50 23.75 65.6 31.9
Total 100.00 100.00 100.0 100.0
Lastly, it is worth highlighting that there is no visible “cooling out” effect on educational expectations (Table 3) within community colleges’ students (who chose to attend to a community college as their first post secondary education institution). Actually, expectations for finishing college and attending higher schooling after a baccalaureate increased by 1994 (after two years of PSE). However, the gap between baccalaureate and sub-baccalaureate students does increase because of a shift in the former towards more post college education.
Table 4. Distribution of Educational Expectations in subbaccalaureate programs for the first, third and fifth quintile, 1992 & 1994.
Ed. Expectations Quintile I Quintile III Quintile V
1992 1994 1992 1994 1992 1994
HS grad or less 3.6 0.0 1.4 0.0 1.1 0.0
Voc,Trd,Bus after HS 17.9 10.7 12.1 7.2 4.9 2.0
Will attend college 28.7 24.2 25.5 18.6 11.2 8.2
Will finish college 30.4 41.1 40.6 43.0 45.7 39.2
Higher schl after
college 19.4 24.0 20.3 31.2 37.1 50.5
Total 100.0 100.0 100.0 100.0 100.0 100.0
[image:10.612.89.525.537.665.2]towards post college education happens for children of all SES groups, the latter shift is greater among higher SES sub-baccalaureate students.
Estimations
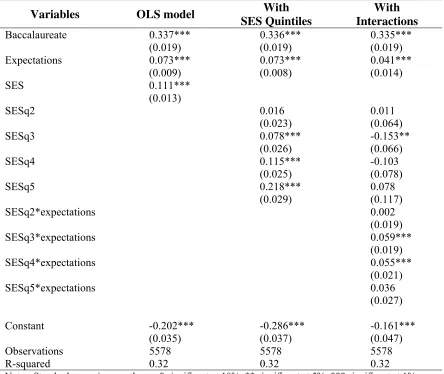
On the basis of equations (v), (vi) and (vii) we estimated four models, and three equations within each. The first model is an OLS re-estimation of the model posed by Leigh & Gill (2003), together with two additional estimations that introduced socio-economic quintiles and their interactions with educational expectations, correspondingly (Table 5). Furthermore, we also re-estimated Rouse’s (1995) model and introduced expectations into it. To this model we subsequently added SES as quintile dummies, and their interactions with schooling expectations (Table 6).
The missing group in the estimations of the quintile effect is the first quintile; therefore, all coefficients are defined in relation to the effect on the probability of baccalaureate attainment for students belonging to the first quintile. Likewise, in terms of the type of institution attended, the effect of attending a baccalaureate as the first post-secondary institution is defined relative to attending a sub-baccalaureate institution.
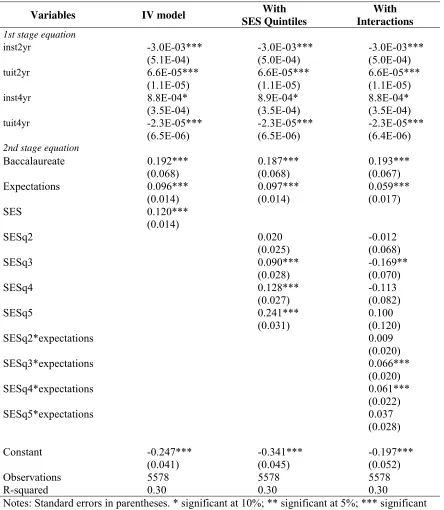
The estimations on the basis of the IV model proposed by Rouse, add to the model a correction for selection in terms of students’ choice of either type of institution. The instruments on accessibility proved highly significant and overall good instruments, within the first stage equation. The results agree with Rouse as a higher number of two-year institutions and lower four-year tuition is associated with lower baccalaureate completion rates.
Educational expectations are significant across the board. That is, expected levels of education do in fact have a positive effect in the probability of attaining a baccalaureate degree. Moreover, there are no significant differences across models. Then again, in the IV estimations (Table 6) the level of the effects are slightly higher. Thus, the relation between expectations and baccalaureate attainment is steeper, when instrumenting for the effect of choosing among types of institutions.
Table 5. Estimation of Leigh & Gill’s OLS model with SES quintiles and their interactions with educational expectations.
Variables OLS model With SES Quintiles
With Interactions
Baccalaureate 0.337*** 0.336*** 0.335***
(0.019) (0.019) (0.019)
Expectations 0.073*** 0.073*** 0.041***
(0.009) (0.008) (0.014)
SES 0.111***
(0.013)
SESq2 0.016 0.011
(0.023) (0.064)
SESq3 0.078*** -0.153**
(0.026) (0.066)
SESq4 0.115*** -0.103
(0.025) (0.078)
SESq5 0.218*** 0.078
(0.029) (0.117)
SESq2*expectations 0.002
(0.019)
SESq3*expectations 0.059***
(0.019)
SESq4*expectations 0.055***
(0.021)
SESq5*expectations 0.036
(0.027)
Constant -0.202*** -0.286*** -0.161***
(0.035) (0.037) (0.047) Observations 5578 5578 5578 R-squared 0.32 0.32 0.32
Notes: Standard errors in parentheses. * significant at 10%; ** significant at 5%; *** significant at 1%. Controls: nonnative, married, children, races, female, disabilities, urban & ability (scores). Full estimations are included in Appendix I.
Table 6. Estimation of Rouse’s IV model with educational expectations, and with SES quintiles and their interactions with the former.
Variables IV model With SES Quintiles
With Interactions
1st stage equation
inst2yr -3.0E-03*** -3.0E-03*** -3.0E-03*** (5.1E-04) (5.0E-04) (5.0E-04)
tuit2yr 6.6E-05*** 6.6E-05*** 6.6E-05*** (1.1E-05) (1.1E-05) (1.1E-05)
inst4yr 8.8E-04* 8.9E-04* 8.8E-04*
(3.5E-04) (3.5E-04) (3.5E-04)
tuit4yr -2.3E-05*** -2.3E-05*** -2.3E-05*** (6.5E-06) (6.5E-06) (6.4E-06)
2nd stage equation
Baccalaureate 0.192*** 0.187*** 0.193***
(0.068) (0.068) (0.067)
Expectations 0.096*** 0.097*** 0.059***
(0.014) (0.014) (0.017)
SES 0.120***
(0.014)
SESq2 0.020 -0.012
(0.025) (0.068)
SESq3 0.090*** -0.169**
(0.028) (0.070)
SESq4 0.128*** -0.113
(0.027) (0.082)
SESq5 0.241*** 0.100
(0.031) (0.120)
SESq2*expectations 0.009
(0.020)
SESq3*expectations 0.066***
(0.020)
SESq4*expectations 0.061***
(0.022)
SESq5*expectations 0.037
(0.028)
Constant -0.247*** -0.341*** -0.197***
(0.041) (0.045) (0.052) Observations 5578 5578 5578 R-squared 0.30 0.30 0.30 Notes: Standard errors in parentheses. * significant at 10%; ** significant at 5%; *** significant
at 1%. Controls: nonnative, married, children, races, female, disabilities, urban & ability (scores). Full estimations are included in Appendix II.
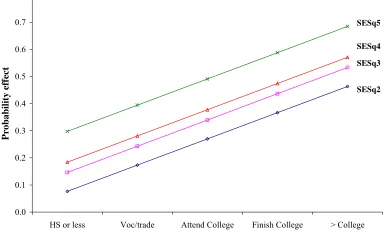
have any effect for the highest quintile, which evidences no change in slope. That is, there is no joint effect between SES and expectations for this group.
However, this is not the case for the rest of the social distribution. The interaction terms decreases the slope for the second quintile, diminishing the effect of higher expectations on the probability of baccalaureate attainment. In parallel, it diminishes the SES per se effect (level) for the third and fourth quintile, but it increases the slope of the relation (shifts the fitted line around). That is, SES makes the effect of increased expectations on the probability of attaining a bachelor’s degree even stronger.
[image:14.612.108.493.368.620.2]Additionally, even for people who only expected to have a high school diploma or less, there is a positive effect on the probability of attainment. That is, students who did not think they would attain any more than a high school level degree, but still enroll in a post secondary education, do quite evidently increase their chances of attaining a college degree just by exceeding their expectations.
Figure 1. Estimated attainment by SES and educational expectation levels. IV estimation without interactions.
0.0 0.1 0.2 0.3 0.4 0.5 0.6 0.7 0.8
HS or less Voc/trade Attend College Finish College > College
Prob
ab
ilit
y eff
ect
SESq5
SESq4
SESq3
Figure 2. Estimated attainment by SES and educational expectation levels. IV estimations with interactions.
0 0.1 0.2 0.3 0.4 0.5 0.6 0.7 0.8
HS or less Voc/trade Attend College Finish College > College
Prob
ab
ilit
y ef
fect
SESq5
SESq4
SESq3
SESq2
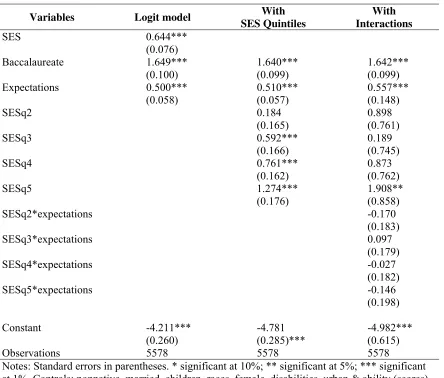
Table 7. Logit model (estimation coefficients).
Variables Logit model With SES Quintiles
With Interactions
SES 0.644***
(0.076)
Baccalaureate 1.649*** 1.640*** 1.642***
(0.100) (0.099) (0.099)
Expectations 0.500*** 0.510*** 0.557***
(0.058) (0.057) (0.148)
SESq2 0.184 0.898
(0.165) (0.761)
SESq3 0.592*** 0.189
(0.166) (0.745)
SESq4 0.761*** 0.873
(0.162) (0.762)
SESq5 1.274*** 1.908**
(0.176) (0.858)
SESq2*expectations -0.170
(0.183)
SESq3*expectations 0.097
(0.179)
SESq4*expectations -0.027
(0.182)
SESq5*expectations -0.146
(0.198)
Constant -4.211*** -4.781 -4.982***
(0.260) (0.285)*** (0.615)
Observations 5578 5578 5578 Notes: Standard errors in parentheses. * significant at 10%; ** significant at 5%; *** significant
at 1%. Controls: nonnative, married, children, races, female, disabilities, urban & ability (scores). Full estimations are included in Appendix III.
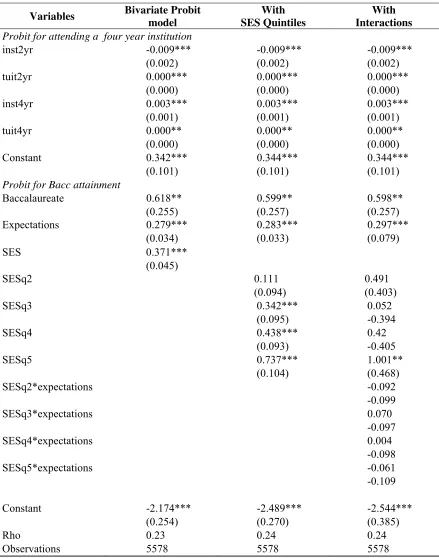
Fitting a bivariate probit model, results do not vary significantly. The effect of introducing the interactions is the same as for the logit estimations, where significance of SES disappears except for the top quintile and with the interactions turning not-significant2. However, for the estimations without interactions coefficients need to be interpreted in terms of probabilities, to compare with the estimations by Rouse and Leigh and Gill of the Diversion and Democratization effects.
Table 8. Bivariate Probit model (estimation coefficients).
Variables Bivariate Probit model
With SES Quintiles
With Interactions
Probit for attending a four year institution
inst2yr -0.009*** -0.009*** -0.009***
(0.002) (0.002) (0.002)
tuit2yr 0.000*** 0.000*** 0.000***
(0.000) (0.000) (0.000)
inst4yr 0.003*** 0.003*** 0.003***
(0.001) (0.001) (0.001)
tuit4yr 0.000** 0.000** 0.000**
(0.000) (0.000) (0.000)
Constant 0.342*** 0.344*** 0.344***
(0.101) (0.101) (0.101)
Probit for Bacc attainment
Baccalaureate 0.618** 0.599** 0.598**
(0.255) (0.257) (0.257)
Expectations 0.279*** 0.283*** 0.297***
(0.034) (0.033) (0.079)
SES 0.371*** (0.045)
SESq2 0.111 0.491
(0.094) (0.403)
SESq3 0.342*** 0.052
(0.095) -0.394
SESq4 0.438*** 0.42
(0.093) -0.405
SESq5 0.737*** 1.001**
(0.104) (0.468)
SESq2*expectations -0.092
-0.099
SESq3*expectations 0.070
-0.097
SESq4*expectations 0.004
-0.098
SESq5*expectations -0.061
-0.109
Constant -2.174*** -2.489*** -2.544***
(0.254) (0.270) (0.385)
Rho 0.23 0.24 0.24
Observations 5578 5578 5578 Notes: Standard errors in parentheses. * significant at 10%; ** significant at 5%; *** significant
Diversion or Democratization
The question of the whether community colleges serves as means of democratization of diversion of students, focuses (according to Leigh & Gill, 2003; p. 28) on “the question of whether students desiring to complete a bachelor’s degree are more likely to be diverted from their goal if the start at a community college. Basically, in our estimations, as we limited the sample to students choosing some track in higher education, this implies that our coefficient for baccalaraureate institutions already measures the distance between the two tracks (the negative of what Rouse defined as the diversion effect: α2-α4). Therefore, by setting all other variables to
[image:18.612.62.551.304.377.2]its means, and comparing what happens when Bacc=0 versus Bacc=1, it is feasible to compare the effects on the probability of attaining a bacc degree for all four models (although we can tell that all four models do in fact agree in a being positive and significant effect). While the IV and the Logit estimations are quite similar, the Bivariate Probit does in fact result in extremely high estimated effects on the probability of attaining a bachelor’s degree, of attending a 4 year institution.
Table 9. Effects computed by setting all variables to their means.
Effects OLS IV Logit Bivariate Probit
Bacc institution .337 .192 .187 .599
Conclusions
This paper attempted to address the interconnection of socio-economic status and educational expectation, two major determinants of the probability of attaining a bachelor’s degree. While previous literature measuring the democratization versus the diversion effect of community colleges, taking into consideration that students select themselves into two- versus four-year institution, have posed the importance of educational expectations, this literature has not address how such expectations are related to socio-economic status and are not independently constructed. Also, it improved previous estimation methods, as these have not taken into account the binary character of the dependent variables.
Consequently, and building upon of the similar models posed by Rouse (1995) and Leigh and Gill (2003), we focused on examining social class differences and their interaction with educational expectations in terms of defining the probability of baccalaureate attainment in two- versus four-year institutions. The estimations used variations from both mentioned models, and two series of estimations were presented for each of these.
for the rest. However, the chances are always higher for higher SES students. These are not observed using logits and bivariate probit methods, instead of OLS and IVs, correspondingly.
However, the democratization effect remains significant all through the estimations, and actually becomes stronger when estimation methods are improved. Our estimates therefore reinforced the findings by Rouse (1995) and Leigh and Gill (2003) of a positive democratization effect that outweighs any diversion effects.
References
Brint, S. & J. Karabel (1989) Community Colleges and the American Social Order. In, Arum, R and I.R.Beattie (eds) (1999) The Structure of Schooling. Readings in the Sociology of Education McGraw Hill Higher Education, New York: pp. 463-473.
Brooks-Gunn, J., Duncan, G.J. R. and Britto’s (1999) Are Socioeconomic Gradients for Children Similar to Those for Adults? Achievement and Health for Children in the United States. In D.P.Keating and C. Herzman (Eds.) Developmental Health and the Wealth of Nations: Social, Biological, and Educational Dynamics. New York: Guilford Press: pp. 94-124.
Dougherty, K. (1987) The Effects of Community Colleges: Aid or Hindrance to Socioeconomic Attainment? Sociology of Education, 60 (April): pp. 86-103.
Dougherty, K. (1992). Community Colleges and Baccalaureate Attainment. Journal of Higher Education, 63(2): pp.188-213.
Dougherty, K. (1994) The Community College’s Impact on Students, the Economy, and the Universities. In The Contradictory College: The Conflicting Origins, Impacts, and Futures of the Community ollege. Albany: SUNY Press: pp.42-68.
Grubb, W. N. (2002a) Learning and Earning in the Middle, Part I: National Studies of Pre-Baccalaureate Education. Economics of Education Review, 21: pp. 299-321.
Grubb, W. N. (2002b) Learning and Earning in the Middle, Part II: National Studies of Pre-Baccalaureate Education. Economics of Education Review, 21: pp. 401-414.
Hagy, A.P. & J.F.O. Staniec. (2002) Immigrant Status, Race, and Educational Choice in Higher Education. Economics of Education Review, 21: pp. 381-192.
Kane, T.J. & C.E. Rouse (1995) Labor-Market Returns to Two- and Four-Year College. The American Economic Review, 85 (3): pp. 600-614.
Leigh, D.E. & A.M. Gill (2003) Do Community Colleges Really Divert Students From Earning Bachelor’s Degrees? Economics of Education Review, 22: pp. 23-30.
Monks, J. (2000) The Returns to Individual and College Characteristics. Evidence form the National Longitudinal Survey of Youth. Economics of Education Review, 19: pp. 279-289.
Rouse, C.E. (1994) What to Do After High School: the Two-Year vs. Four-Year College Enrollment Decision. Choice & consequences: Contemporary policy issues in education, pp. 59-88. Ithaca, NY: ILR Press.
Rouse, C.E. (1995) Democratization or Diversion? The Effect of Community Colleges on Educational Attainment. Journal of Business & Economic Statistics, 13 (2): pp. 217-224.
Whitaker, D.G. & E.T. Pascarella (1994) Two-Year College Attendance and Socioeconomic Attainment. Journal of Higher Education, 65(2): pp.194-210.
Appendix I.
Estimation of Leigh & Gill’s OLS model with SES quintiles and their interactions with educational expectations.
Variables OLS model With SES Quintiles
With Interactions
Baccalaureate 0.337*** 0.336*** 0.335*** (0.019) (0.019) (0.019)
Nonnative 0.060 0.051 0.050
(0.037) (0.038) (0.038)
Married -0.034 -0.034 -0.034
(0.053) (0.053) (0.052)
Children -0.098** -0.103** -0.102**
(0.041) (0.040) (0.041)
Black -0.069** -0.078*** -0.075***
(0.029) (0.029) (0.029)
Hispanic -0.036 -0.049* -0.050**
(0.025) (0.025) (0.025)
Asian 0.001 0.002 0.002
(0.040) (0.040) (0.040)
Female 0.054*** 0.053*** 0.052***
(0.015) (0.015) (0.015)
Nodisabi -0.021 -0.020 -0.019
(0.021) (0.021) (0.021)
Urban90 0.028 0.028 0.029
(0.018) (0.018) (0.018)
By2xcomp 0.000*** 0.000*** 0.000***
(0.000) (0.000) (0.000)
Expectations 0.073*** 0.073*** 0.041***
(0.009) (0.008) (0.014) SES 0.111***
(0.013)
SESq2 0.016 0.011
(0.023) (0.064)
SESq3 0.078*** -0.153**
(0.026) (0.066)
SESq4 0.115*** -0.103
(0.025) (0.078)
SESq5 0.218*** 0.078
(0.029) (0.117)
SESq2*expectations 0.002
(0.019)
SESq3*expectations 0.059***
(0.019
SESq4*expectations 0.055***
(0.021)
SESq5*expectations 0.036
(0.027)
Constant -0.202*** -0.286*** -0.161***
(0.035) (0.037) (0.047) Observations 5578 5578 5578
R-squared 0.32 0.32 0.32
Appendix II.
Estimation of Rouse’s IV model with educational expectations, and with SES quintiles and their interactions with the former.
Variables IV model With SES Quintiles
With Interactions
Baccalaureate 1.649*** 1.640*** 1.642*** (0.100) (0.099) (0.099)
Nonative 0.343 0.304 0.302
(0.236) (0.238) (0.236)
Married -0.303 -0.305 -0.289
(0.451) (0.443) (0.438)
Children -0.998** -1.032*** -1.027***
(0.401) (0.395) (0.396)
Black -0.399** -0.427** -0.436**
(0.176) (0.175) (0.175)
Hispanic -0.251 -0.310* -0.316**
(0.157) (0.159) (0.160)
Asian 0.009 0.011 0.004
(0.241) (0.239) (0.238)
Female 0.314*** 0.302*** 0.303***
(0.086) (0.086) (0.086)
Nodisabi -0.123 -0.118 -0.118
(0.123) (0.123) (0.124)
Urban90 0.167 0.166 0.164
(0.107) (0.107) (0.107)
By2xcomp 0.000*** 0.000*** 0.000***
(0.000) (0.000) (0.000)
Expectations 0.500*** 0.510*** 0.557***
(0.058) (0.057) (0.148)
SES 0.644***
(0.076)
SESq2 0.184 0.898
(0.165) (0.761)
SESq3 0.592*** 0.189
(0.166) (0.745)
SESq4 0.761*** 0.873
(0.162) (0.762)
SESq5 1.274*** 1.908**
(0.176) (0.858)
SESq2*expectations -0.170
(0.183)
SESq3*expectations 0.097
(0.179)
SESq4*expectations -0.027
(0.182)
SESq5*expectations -0.146
(0.198)
Constant -4.211*** -4.781*** -4.982***
Appendix III.
Logit model (estimated coefficients).
Variables Logit model With SES Quintiles
With Interactions
1st stage equation
inst2yr -3.0E-03*** -3.0E-03*** -3.0E-03***
(5.1E-04) (5.0E-04) (5.0E-04) tuit2yr 6.6E-05*** 6.6E-05*** 6.6E-05*** (1.1E-05) (1.1E-05) (1.1E-05)
inst4yr 8.8E-04* 8.9E-04* 8.8E-04*
(3.5E-04) (3.5E-04) (3.5E-04)
tuit4yr -2.3E-05*** -2.3E-05*** -2.3E-05***
(6.5E-06) (6.5E-06) (6.4E-06) 2nd stage equation
Baccalaureate 0.192*** 0.187*** 0.193*** (0.068) (0.068) (0.067)
Nonative 0.054 0.044 0.044
(0.036) (0.036) (0.036)
Married -0.060 -0.060 -0.058
(0.056) (0.056) (0.055)
Children -0.115*** -0.119*** -0.118***
(0.041) (0.041) (0.041)
Black -0.059* -0.067** -0.065**
(0.031) (0.032) (0.031)
Hispanic -0.038 -0.052** -0.053**
(0.026) (0.026) (0.026)
Asian 0.006 0.006 0.006
(0.039) (0.040) (0.039)
Female 0.055*** 0.054*** 0.053***
(0.015) (0.015) (0.015)
Nodisabi -0.029 -0.028 -0.027
(0.021) (0.021) (0.021)
Urban90 0.033* 0.032* 0.033*
(0.018) (0.018) (0.018)
By2xcomp 0.000*** 0.000*** 0.000***
(0.000) (0.000) (0.000)
Expectations 0.096*** 0.097*** 0.059***
(0.014) (0.014) (0.017)
SES 0.120***
(0.014)
SESq2 0.020 -0.012
(0.025) (0.068)
SESq3 0.090*** -0.169**
(0.028) (0.070)
SESq4 0.128*** -0.113
(0.027) (0.082)
SESq5 0.241*** 0.100
(0.031) (0.120)
SESq2*expectations 0.009
(0.020)
SESq3*expectations 0.066***
(0.020)
SESq4*expectations 0.061***
SESq5*expectations 0.037 (0.028)
Constant -0.247*** -0.341*** -0.197***
(0.041) (0.045) (0.052) Observations 5578 5578 5578
R-squared 0.30 0.30 0.30
Appendix IV.
Bivariate Probit model (estimation coefficients).
Variables Bivariate Probit model
With SES Quintiles
With Interactions
Probit for attending a four year institution
inst2yr -0.009*** -0.009*** -0.009***
(0.002) (0.002) (0.002)
tuit2yr 0.000*** 0.000*** 0.000***
(0.000) (0.000) (0.000)
inst4yr 0.003*** 0.003*** 0.003***
(0.001) (0.001) (0.001)
tuit4yr 0.000** 0.000** 0.000**
(0.000) (0.000) (0.000)
Constant 0.342*** 0.344*** 0.344***
(0.101) (0.101) (0.101)
Probit for Bacc attainment
Baccalaureate 0.618** 0.599** 0.598** (0.255) (0.257) (0.257)
Nonative 0.194 0.171 0.169
-0.132 -0.133 -0.132
Married -0.139 -0.14 -0.132
-0.252 -0.25 -0.247
Children -0.501** -0.516** -0.507**
(0.220) (0.220) (0.221)
Black -0.247** -0.265*** -0.269***
(0.102) (0.102) (0.102)
Hispanic -0.168* -0.203** -0.206**
(0.091) (0.091) (0.092)
Asian -0.024 -0.024 -0.026
-0.137 -0.136 -0.137
Female 0.182*** 0.175*** 0.176***
(0.049) (0.049) (0.049)
Nodisabi -0.082 -0.078 -0.079
-0.07 -0.071 -0.071
Urban90 0.094 0.093 0.091
-0.062 -0.062 -0.061 By2xcomp 0.000 0.000 0.000***
(0.000) (0.000) (0.000) Expectations 0.279*** 0.283*** 0.297*** (0.034) (0.033) (0.079) SES 0.371***
(0.045)
SESq2 0.111 0.491
(0.094) (0.403)
SESq3 0.342*** 0.052
SESq4 0.438*** 0.42
(0.093) -0.405
SESq5 0.737*** 1.001**
(0.104) (0.468)
SESq2*expectations -0.092
-0.099
SESq3*expectations 0.07
-0.097
SESq4*expectations 0.004
-0.098
SESq5*expectations -0.061
-0.109
Constant 0.342*** 0.344*** 0.344***
Appendix V.
Instrumental Variable approach with a first-step probit estimation.
Variables IV with first-step probit
With SES Quintiles
With Interactions
Pr(bacc) 0.707*** 0.699*** 0.699***
(0.222) (0.220) (0.220)
Nonative 0.146 0.125 0.126
(0.123) (0.123) (0.123)
Married -0.412 -0.405 -0.400
(0.256) (0.252) (0.251)
Children -0.559*** -0.578*** -0.568***
(0.208) (0.209) (0.209)
Black -0.119 -0.139 -0.141
(0.112) (0.111) (0.111)
Hispanic -0.098 -0.131 -0.137
(0.094) (0.095) (0.095)
Asian 0.098 0.095 0.089
(0.128) (0.128) (0.127)
Female 0.174*** 0.168*** 0.168***
(0.051) (0.051) (0.051)
Nodisabi -0.118* -0.113 -0.112
(0.070) (0.071) (0.071)
Urban90 0.137** 0.135** 0.134**
(0.060) (0.060) (0.059)
By2xcomp 0.000*** 0.000*** 0.000***
(0.000) (0.000) (0.000)
Expectations 0.423*** 0.426*** 0.394***
(0.034) (0.033) (0.085) SES 0.413***
(0.047)
SESq2 0.131 0.232
(0.102) (0.407)
SESq3 0.390*** -0.161
(0.104) (0.410)
SESq4 0.497*** 0.302
(0.100) (0.411)
SESq5 0.842*** 0.961**
(0.107) (0.477)
SESq2*expectations -0.025
(0.103)
SESq3*expectations 0.133
(0.104)
SESq4*expectations 0.046
(0.103)
SESq5*expectations -0.025
(0.116)
Constant -3.058*** -3.423*** -3.289***