http://dx.doi.org/10.4236/gep.2015.36003
Mesocosm Assessment of Stability
Habitat for Halophyte
Sunghoon Ryu, Incheol Lee
Department of Ocean Engineering, Pukyong National University, Busan, South Korea Email: firesinger@gmail.com
Received 10 June 2015; accepted 19 August 2015; published 25 August 2015
Abstract
In this paper, we constructed the halophyte Mesocosm experimental group which was used as a substrate material that consisted of tidal flat and dredged sediment. Depending on whether the ingredients of vegetation and substrate material of Mesocosm, we constructed Mesocosm A (tidal flat sediment + Salicornia herbecea), Mesocosm B (only dredged sediment), Mesocosm C (dredged sediment + Salicornia herbecea). Monitoring was carried out of seawater quality factors (Chemical Oxygen Demand (COD), Total Nitrogen (T-N), Total Phosphorus (T-P), temperature, salinity), se-diment factors (Chemical Oxygen Demand (COD), Total (T-N), Total Phosphorus (T-P) and growth of Salricornia herbecea) in each Mesocosm. Habitat Stability Index of vegetation was calculating by using the monitoring results. HSI of Mesocosm C was calculated from 0.87 to 0.95 as compared to the relatively high HSI Mesocosm A, it was evaluated to be able to be used in the restoration of the coastal salt marsh with dredged sediment.
Keywords
Salt Marsh, Dredged Sediment, Mesocosm, Halophyte, Habitat Stability Index (HSI)
1. Introduction
Coastal salt marsh has a value that is related to its flood and coastal defense function and ecosystem and con-servation importance, as well as its role in pollution control, waste disposal and the maintenance of water quality, fisheries, agriculture, recreation and tourism.
It is the most common and extensive intertidal habitat along many temperate coastlines [1]. However, some coastal marshes were lost through land reclamation and recreation.
Coastal marshes in South Korea were under escalating development pressure until recently. The natural coastal area in South Korea was 3203 km2 in 1987, but 2487 km2 in 2013 [2]. Salt marshes are now protected legally in many countries to preserve these ecologically important habitats.
[3] defines Mesocsom is an enclosed system which is partially permeable to their surroundings. It is an avail-able method to assess effects of particular variavail-able on the system by eliminating that variavail-able and observing the subsequent system response [4].
applied to analyze the effect of a controlled variation to the environment, such as nutrient [5], pH [6], restoration. In spite of these literatures, Mesocosm have a number of demerits. There is also always the question of whether the ecosystem succession found in a Mesocosm experiment actually represents what occurs in natural conditions or is an artifact of the controlled environment of the Mesocosm [7].
The dredged sediment generation amount and treatment cost in South Korea have been increasing rapidly since 2000, reaching 40 million cubic meters and 180 million dollars in 2005 [8]. Some of these dredged sedi-ments are uncontaminated and invaluable resources for stabilizing or restoring coastal marshes. Some published reports have documented the environmental recycling method of the dredged sediment. [9] restored salt marshes that was used dredged sediment for substrate material and then investigated them to quantify ecological restora-tion success. Others are mechanical and germinarestora-tion characteristics of stabilized dredged soil [10].
It is difficult to evaluate the success of coastal marsh restoration for lack of scientifically based criteria of restoration success. So how to develop scientifically based criteria to objectively judge the suitable habitat of salt marsh Mesocosm?
Until recently, little attention was given to quantify the suitability of habitat with respect to habitat function. There are few studies have developed and applied success criteria objectively and followed through with the re-quisite assessment and evaluation [11] [12] developed indicators of chosen habitat functions and then created statically representations of natural, local reference sites for comparison to the functional development of res-tored habitats.
[9] suggest restoration index (RI) for evaluation of bio-chemical factor on the creation of ecological environ-mental zone in coastal area. It is available to judge quantitative evaluation of constructed salt marsh.
The purpose of this study is to present results from salt marsh Mesocosm study whose ultimate objective is to assess stability habitat for halophyte. Our particular interest is in calculating Habitat Stability Index (HSI) by using environmental factors.
2. Mesocosm Experimental Settings
2.1. Initial Design and Planting
[image:2.595.129.506.449.701.2]To assess habitat stability of halophyte, we designed three types of experimental systems which were involved seawater tank, Mesocosm and recirculation tank (Figure 1). Nine, 65-L polypropylene tanks were installed in-doors. Each Mesocosm engineered with adjustable tidal level. All tanks were flooded simultaneously through
PVC piping system controlled by an electrical solenoid valve with a 24-h interval timer. We adjusted the timer setting daily so that flood/ebb cycles corresponded to 6-h. When the solenoid interrupted seawater flow, meso-cosm drained by gravity over the 6-h ebb tide phase to the prescribed depth below the soil surface before the next flood cycle began.
Our experimental design involved flooding all tanks with nature seawater (35 ppt salinity) and then allowing them to drain a prescribed depth below the soil surface on a continuous cycle basis that corresponded with the nature tidal cycle in the same geographic area.
It was constructed the halophyte Mesocosm experimental which was used tidal flat and dredged sediment as a substrate material. With the experimental plot we constructed three Mesocosms of the following conditions: 1) tidal flat sediment with Salicornia herbaria 2) only dredged sediment 3) dredged sediment with Salicornia herbaria.
2.2. Monitoring of Water Quality Factors
When ebb-tide, each Mesocosm discharged the seawater to the recirculation tanks. Sampling was performed twice in a week during a month. Seawater temperature and Salinity were measure by using CT (COMPACT CT ACT-HR, ALEC). Chemical Oxygen Demand (COD) was analyzed by Potassium Permanganate test. Total Ni-trogen (T-N) was analyzed by Cd-cu reduction method. Total Phosphorus was analyzed by ascorbic acid test.
2.3. Monitoring of Sediment Factors
We monitored the variation of chemical oxygen demand (COD), total nitrogen (T-N) and total phosphorous (T-P) in the sediment of Mesocosm. Samples of 10 cm depth collected at three points in each Mesocosm using core samplers. Sampling performed twice in a week during a month. The samples kept at 4˚C until their arrival at the laboratory.
COD analyzed using the potassium permanganate method [13]. T-N analyzed using the kjeldahl procedure and T-P analyzed using the molybdenum blue method after pretreatment with the ashing method [13].
2.4. Monitoring of Plant Growth
The emergence of each new aerial shoot was recorded every week throughout the experimental period. When ebb tide drain, we measured the shoot height from the surface of sediment. Actually, it was necessary to analyze biomass but we didn’t analyze. We plotted thirty Salicornia herbeceas in Mesocosm A and C.
2.5. Habitat Suitability Index
The Habitat Suitability Index (HSI) contains nine variables for halophyte (Salicornia herbecea) growth. The Habitat Stability provides an objective quantifiable method of assessing the habitat conditions for Salicornia
herbecea within a Mesocosm by measure how well each habitat variable meets the habitat requirements of the
species by life stage. The index thus provides an objective basis for predicting impacts, guiding habitat protec-tion, mitigation and enhancement and management decisions.
The task of evaluating the success of coastal marsh restoration has been difficult for lack of scientifically based criteria of habitat suitability for halophyte. An evaluation procedure based on proposed in this study. The following steps are taken to estimate the value of HSI in this mesocosm experiment.
1) Select mesocosm
For the coastal salt marsh in Mesocosm A, Mesocosm C is constructed salt marsh with dredged sediment. 2) Monitor physico-chemical and bio-chemical indicators
Second step in the HSI development process is to measure chemical and biological characteristics to compare the mesocosm A and C. Sea water temperature, salinity, COD, IL, TN and TP were selected as the chemical in-dicators in Seawater. Then COD, IL, TN, TP were chosen to evaluate the changes of organic matters and nu-trients of the sediment in the Mesocosm A and C. Nitrogen and phosphorus are primary macronunu-trients for plants. Soil organic matters are important for soil quality because they are nutrient sink and source, enhance soil physical and chemical properties, and promote biological activity [14] [15].
The values of COD affect availability of soil nutrients, and solubility of toxic nutrient elements in the soil. 3) Calculate HSI for each qualified indicator
Z-score calculated by Equation (1). Then weight of each factor that influence to plant growth calculated by Equ-ation (2).
4) Do the sum of weight for each physico-chemical factors and Z-score, Habitat Stability Score in Mesocosm A and C calculated by Equation (3).
5) [9] suggest Equation (4), it is a quantifiable method of assessing the habitat conditions for Salicornia
her-becea within a Mesocosm by measuring how well each habitat variable meets the habitat requirements of the
species by life stage.
(
)
i i
Z = x −
µ σ
(1)1
i i i
n i
D D
γ
=∑
= (2)1 i n
i
i Z
HSS=
∑
= ⋅γ
(3)2 2
1
( ) (
1 Ri Ci n Ri Ci)
i
H IS = − V −V
∑
= V −V (4)Where xi: raw data, μ: mean value, σ: S.D., Zi: Standing value of environmental factors in mesocosm, γi: weight
value of environmental factors, Di: measured value of environmental factors, n: number of environmental factors in
mesocosm (n = 9), VRi: initial value of HSS in mesocosm, VCi: measured value of HSS in mesocosm at each time.
To analyze the variation of HSI according to the time, it base on initial HSI value. If HSI value is close to one, it is possible to judge the more proper habitat for halophytes.
3. Results
3.1. Temperature & Salinity in Seawater
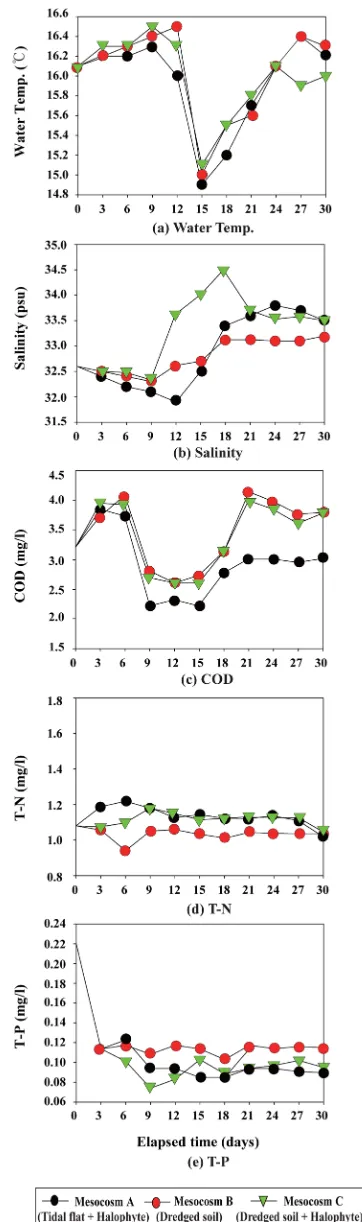
Initial temperature of inflow seawater is 16.1˚C. After one month, temperatures in each Mesocosm are 16.2˚C, 16.3˚C, 16.0˚C. There is no significant variance in Mesocosm (Figure 2(a) and Figure (b)). Seawater tempera-ture shows rapidly variance between 15 and 27 days which is effected indoors laboratory experiments, it is easi-ly effected by indoors temperature. Salinity reduced until 12 days and then stabilized after 21 days.
3.2. COD Concentration of Seawater
Inflows seawater of COD concentration is 3.25 mg/l. After one month, outflow seawater of COD concentrations ranged from 2.99 to 3.38 mg/l in Mesocsom (Figure 2(c)). The lowest COD concentration was observed at Me-socsom A, whereas the highest concentrations was recorded at Mesocosm B. Mesocosm A only reduced COD concentration, however, Mesocosm B and C were little increased. Reduction ratios of COD of the influent water in Mesocosm A and C that planted vegetation are higher than mesocosm B. When organic matter in sea-water flowing into the Mesocosm tanks, it can settle to the sediment or absorbed by vegetation so that the re-moval of organic matter in decomposition process is carried out by microorganisms in the Mesocosm A and C. While Mesocosm B does not have any vegetation, COD removal rate is lower than other Mesocosms.
3.3. T-N & T-P Concentration of Seawater
Inflows seawater of T-N concentration is 1.08 mg/l. After a month, outflows seawater concentrations ranged from 1.026 to 1.037 mg/l in Mesocosm (Figure 2(d) and Figure 2(e)). Nitrogen release can stimulate primary production in both the emergent marsh [16] and in downstream receiving waters [17]. T-N may be removed from the salt marsh completely via denitrification, which occurs under anaerobic conditions and are more likely to be found in water-logged sediments [18]-[21].
In case of T-P concentration, after a month 68.2%, 48%, 57% were reduced in Mesocosm A, B, C. The high productivity of natural salt marsh is largely dependent on the abundance and availability of primary plant nu-trients, N and P, within the sediment. Phosphorus release can also stimulate production under conditions of high N or low salinity [22].
3.4. COD Concentration in Sediment
Figure 3(a) represents the variance of COD in Mesocosm with time. COD concentration in sediment is reduced 44%, 28%, 8% in Mesocosm A, B, C in a month. Generally, COD concentration is reduced with time. Reduced rates of COD concentration in Mesocosm B and C are lower than that in Mesocosm A.
3.5. T-N & T-P Concentration in Sediment
[image:6.595.220.410.290.696.2]Initial T-N concentration is the lowest in Mesocosm A, the concentration in Mesocosm B and C are similar. Generally, T-N concentration is reduced compare with initial concentration except Mesocosm B (Figure 3(b)). In case of T-P concentration reduced generally but there was no significant variance (Figure 3(c)). Denitrifica-tion rates can be limited by carbon availability and in this way, vegetaDenitrifica-tion can influence denitrificaDenitrifica-tion rates in directly [23] [24]. Vegetation may also influence nitrification and denitrification by influencing the oxygen concentration of the salt marsh substrate within the rhizosphere [25] or by providing bacteria which can fix N in root nodules. There is evidence that N removal efficiency is not affected by the length of time the salt marsh has received N pollution, while, in contrast, the ability of a salt marsh to remove P is known to decline with time [26]. As a result, salt marsh have been associated primarily with a reduction in N loading, rather than functioning to re-duce P loading to water bodies.
3.6. Plant Growth
Shoot height of Salicornia herbecea was recorded about every week in a month. Average shoot height in Meso-cosm A is changed from 7.3 cm to 7.9 cm, MesoMeso-cosm C is changed from 6.8 cm to 7.1 cm (Table 1). Generally, variance of shoot height is smaller than natural salt marsh, it seems that Mesocosm system is an enclosed system.
3.7. Habitat Suitability Index
[image:7.595.86.538.231.400.2]Habitat Stability Index is calculated by using the results of indicators in Mesocosms. Compare with Mesocosm A and C, average HSI value is 0.89 in Mesocosm A and 0.91 in Mesocosm C (Table 2). Average HSI value in Mesocosm C is higher than that in Mesocosm A.
Table 1. Variation of shooting height of halophytes.
Days Mesocosm A Mesocosm C
Initial Condition
MAX 18.1 MAX 13.5
AVG. 7.3 AVG. 6.8
MIN 3.2 MIN 3.1
6 / 11 ~ 30 / 10
MAX 18.1 MAX 13.0
AVG. 7.4 AVG. 6.8
MIN 3.2 MIN 3.1
12 / 11 ~ 6 / 11
MAX 18.1 MAX 13.5
AVG. 7.5 AVG. 6.9
MIN 3.3 MIN 3.2
18 / 11 ~ 12 / 11
MAX 18.1 MAX 13.5
AVG. 7.5 AVG. 6.9
MIN 3.3 MIN 3.2
Table 2. HSI index and Grade at Mesocosm Tank A and C.
TYPE Days HSI
MESOCOSM A
0 -
3 0.93
6 0.92
9 0.92
12 0.88
15 0.82
18 0.85
21 0.88
24 0.89
27 0.90
30 0.88
MESOCOSMC
0 -
3 0.95
6 0.93
9 0.87
12 0.87
15 0.88
18 0.90
21 0.91
24 0.92
27 0.92
[image:7.595.86.535.427.723.2]4. Conclusions
In this paper, we constructed the halophyte Mesocosm experimental group which was used as a substrate ma-terial that consisted of tidal flat and dredged soil oil. Depending on whether the ingredients of vegetation and substrate material of Mesocosm, we constructed Mesocosm A (tidal flat soil + Salicornia herbecea), Mesocosm B (only dredged material), Mesocosm C (dredged soil + Salicornia herbecea). Monitoring was carried out of Warter quality factors (Chemical Oxygen Demand (COD), Total Nitrogen (T-N), Total Phosphorus (T-P), water temperature, salinity), Soil factors (Chemical Oxygen Demand (COD), Total (T-N), Total Phosphorus (T-P) and growth of Salricornia herbecea) in each Mesocosm. Habitat Stability Index of vegetation was calculated by us-ing the monitorus-ing results.
The results of this study are summarized as follows.
1) Characteristics of soil variance: COD is reduced with time, Mesocosm B and C are higher than Mesocosm A. T-N also reduces with time except Mesocosm B. In case of T-P, it shows low reduced rate generally.
2) Characteristics of seawater variance: Temperature is no significant variance in each Mesocosm. Salinity is more higher than initial condition in all Mesocosms. COD concentration is little increased in Mesocosm B and C, and reduced in Mesocosm A. T-N concentration is reduced within 4% - 5% range with time. However, T-P concentration shows lower reduced rate in Mesocosm.
3) Habitat Stability Index: Habitat Stability Index is calculated by using the results of indicators in Mesocosm. Compare with Mesocosm A and C, average HSI value is 0.89 in Mesocosm A and 0.91 in Mesocosm C. Aver-age HSI value in Mesocosm C is higher than that in Mesocosm A.
When restoring the coastal salt marshes through the evaluation of stability of halophytes Mesocosm, it is available to provide basic data for the effect of the vegetation in accordance with the characteristics of the phys-ic-chemical factors. If we monitor the long-term data of field experiment, it is possible to derive a more sophis-ticated result.
References
[1] Chapman, V.J. (1977) Wet Coastal Ecosystem. Elsevier, New York, 1-27.
[2] Ministry of Land (2014) Transport and Maritime Affairs, Korea. http://www.mltm.go.kr
[3] Odum, E.P. (1984) The Mesocosm. BioScience, 34, 558-562.
[4] Ingham, E.R., Trofymow, J.A., Ames, R.N., Hunt, H.W., Morley, C.R., Moore, J.C. and Coleman, D.C. (1986) Troph-ic Interactions and Nitrogen Cycling in a Semi-Arid Grassland Soil MTroph-icrobes or Fauna. Journal of Applied Ecology, 23, 615-630. http://dx.doi.org/10.2307/2404040
[5] Aksnes, D.L., Egge, J.K., Rosland, R. and Heimdal, B.R. (1994) Representation of Emiliania huxleyi in Phytoplankton Simulation Models: A First Approach. Sarsia, 79, 291-300.
[6] Chen, C.Y. and Durbin, E.G. (1994) Effects of pH on the Growth and Carbon Uptake of Marine Phytoplankton. Mar. Ecol. Prog. Ser., 109, 83-94. http://dx.doi.org/10.3354/meps109083
[7] Watts, M.C. and Bigg, G.R. (2001) Modelling and the Monitoring of Mesocosm Experiments: Two Case Studies. Journal of Plankton Research, 23, 1081-1093. http://dx.doi.org/10.1093/plankt/23.10.1081
[8] Ministry of Land (2010) Transport and Maritime Affairs, Korea. http://www.mltm.go.kr
[9] Lee, I., Park, S., Ryu, S. and Kobayashi, N. (2011) Ecological Restoration Index for Evaluation of Artificial Salt Marsh. Journal of Coastal Research, 27, 959-965. http://dx.doi.org/10.2112/JCOASTRES-D-10-00133.1
[10] Lee, M.J., Mun, K.J., Yoon, G.L., Eum, H.M. and Kim, Y.T. (2014) Mechanical and Germination Characteristics of Stabilized Dredged Soil. Journal of the Korean Geo-Environmental Society, 15, 33-40.
http://dx.doi.org/10.14481/jkges.2014.15.3.33
[11] Race, M.S. and Fonseca, M.S. (1996) Fixing Compensatory Mitigation: What Will It Take? Ecological Applications, 94-101. http://dx.doi.org/10.2307/2269556
[12] Short, F.T., Burdick, D.M., Short, C.A., Davis, R.C. and Morgan, P.A. (2000) Developing Success Criteria for Res-tored Eelgrass, Salt Marsh and Mud Flat Habitats. Ecological Engineering, 15, 239-252.
http://dx.doi.org/10.1016/S0925-8574(00)00079-3
[13] Ministry of Maritime Affairs and Fisheries, Korea (2005) Testing Methods in Ocean Environments, 280 p (in Korean).
http://dx.doi.org/10.2136/sssaspecpub35.c1
[15] Gregorich, E.G., Carter, M.R., Angers, D.A., Monreal, C. and Ellert, B.H. (1994) Towards a Minimum Data Set to Assess Soil Organic Matter Quality in Agricultural Soils. Canadian Journal of Soil Science, 74, 367-385.
http://dx.doi.org/10.4141/cjss94-051
[16] Valiela, I. and Teal, J.M. (1974) Nutrient Limitation in Salt Marsh Vegetation. In: Rheimold, R.J. and Queen, W.H., Eds., Ecology of the Halophytes, 547-563.
[17] Howarth, R.W. (1988) Nutrient Limitation of Net Primary Production in Marine Ecosystems. Annual Review of Ecol-ogy and Systematics, 19, 89-110. http://dx.doi.org/10.1146/annurev.es.19.110188.000513
[18] Jordan, T.E., Correll, D.L. and Weller, D.E. (1993) Nutrient Interception by a Riparian Forest Receiving Inputs from Adjacent Cropland.Journal of Environmental Quality, 22, 467-473.
http://dx.doi.org/10.2134/jeq1993.00472425002200030010x
[19] Machefact, S.E., Dise, N.B., Goulding, K.W.T. and Whitehead, P.G. (2002) Nitrous Oxide Emission from a Range of Land Uses across Europe. Hydrology and Earth System Science, 6, 325-337. http://dx.doi.org/10.5194/hess-6-325-2002
[20] Mortimer, C. (1941) The Exchange of Dissolved Substances between Mud and Water in Lakes. Journal of Ecology, 30, 147-201. http://dx.doi.org/10.2307/2256691
[21] Valiela, I., Costa, J., Foreman, K., Teal, J.M., Howes, B. and Aubrey, D. (1990) Transport of Groundwater Born Enu-trients from Watersheds and Their Effects on Coastal Waters. Biogeochemistry, 10, 177-197.
http://dx.doi.org/10.1007/BF00003143
[22] Caraco N, Tamse A, Boutros O & Valiela I (1987) Nutrient Limitation of Phytoplankton Growth in Brackish Coastal Ponds. Canadian Journal of Fisheries and Aquatic Sciences, 44, 473-476. http://dx.doi.org/10.1139/f87-056
[23] Ambus, P. and Christensen, S. (1993) Denitrification Variability and Control in a Riparian Fen Irrigated with Agricul-tural drainage Water. Soil Biology and Biochemistry, 25, 915-923. http://dx.doi.org/10.1016/0038-0717(93)90094-R
[24] Broadbent, F.E. and Clark, F.E. (1965) In: Bartholomew, W.V. and Clark, F.E., Eds., Soil Nitrogen, Agron, 344.
[25] Amstrong, W. (1964) Oxygen Diffusion from the Roots of British Bog Plants. Nature, 204, 801-802.
http://dx.doi.org/10.1038/204801b0