A Novel Feature Clustering Algorithm for Evaluation of
Descriptive Type Examination
A Krishna Mohan
Associate ProfessorDepartment of CSE JNTUKakinada
MHM Krishna Prasad Associate Professor
Department of CSE JNTUKakinada
ABSTRACT
Objective type of Examination evaluation is easy in Computer world, but the descriptive type of question evaluation is more complex and there is no significant research has been taken place. So many descriptive type examinations like University Exams, GRE etc., have been conducting from long time which is being evaluated manually by sending these types of questions and answers to the experts. This kind of exams needs automatic evaluation instead of manual correction to bring accuracy and reduce the evaluation time. In this paper, authors propose CosInfo algorithm a new solution to the above problem which can evaluate the papers automatically. This algorithm implemented the feature clustering for evaluation purpose that calculate the similarity between two documents and cluster the relevant documents in to different groups. Proposed algorithm uses the expected information function and parts of speech in English grammar as parameters to cluster the data, and also builds a model to classify the testing documents using SVM classification to assess the degree of similarity which will help to award the marks automatically. Experimental results show that the proposed method obtains better and accurate results to allocate marks compared with manual evaluation.
General Terms
Feature Clustering, cosine similarity, Split distribution, fuzzy clustering.
Keywords
Text classification, Document clustering, Information retrieval, Feature Clustering, cosine similarity
1.
INTRODUCTION
Every descriptive answer is evaluated manually because there is no proper alternative for manual evaluation. The volume of evaluation increased a lot and become difficulty to handle all the corrections in a manual way. And also it becomes tough to deliver the results within the time. The evaluators are facing the stressful situations to correct many papers within short time. Because of these conditions the evaluators sometimes cannot do the better justification to the students in showing the difference between relevant answer and irrelevant answer, which may not reach the expectations of the good students who wrote the exam well and it leads to the revaluation. They need many resources like persons, material, storage of papers, time etc., In order to overcome all these challenges this paper introduce an automatic evaluation with the data mining techniques such as feature clustering, high dimensional reduction, classification rules and information extraction. So many researches [1][2][3][4][5] are going on automatically classifying text documents for online descriptive evaluation. This research is novel idea and uses the data mining techniques. This paper suggested a solution through feature
clustering and text classification methods. Due to the rapid development of the Internet technology, the increasing volume of digital textual data become more tedious to manage and get the knowledge out of that textual data, therefore the importance of text classification has gained significant attention. There are so many challenges in text classification, high dimensionality is one of the biggest challenge in which each and every document (data point) consists of common words and those common words represent multiple labels at the same time. High dimensionality is another concept handled in this paper. Feature clustering is an effective method to reduce high dimensionality, many researchers worked on this for efficient text classification.
Text classification is different from conventional classification approach in construction of text documents. Each and every word in the document becomes one dimension. There are so many words in a document and thus there is a problem of high dimensionality. The high dimensionality is a severe problem for text classification algorithms which needs to reduce features in the document. So many algorithms were introduced to alleviate this problem. All these algorithms proposed to reduce the features before document classification tasks are performed. The main purpose of Feature Reduction is to reduce the classifiers computation load and to Increase data consistency. There are two types of techniques available for feature reduction, one is feature selection and another is feature extraction. Feature selection algorithm takes subset of features to reduce the high dimensionality. Feature extraction algorithm takes the smaller set of synthesized features.
world data sets show the efficiency of the proposed method in terms of accuracy, and evaluation time when compared to the manual evaluation. The Stanford NLP Maxint Tagger was used for identifying the parts of speech for each sentence in grammatical manner and word Net2.0 to find out the similarities between the words.
The remaining part of this paper is organized as follows: Section: 2 deals with the literature survey, brief background about feature reduction and the document clustering. Section: 3 gives the proposed CosInfo based feature clustering technique. Section: 4 give the Experimental results. Finally section: 5 give the conclusion.
2.
LITERATURE SURVEY
In literature, [2] proposed a methodology to enhance the evaluation tools in semantic learning systems. He proposed two types of exam patterns. Out of those first one is Multi Operations Question (MOQ) uses the matrix concept for fuzzy score and second one is Proof Open Question (POQ).Both exams need to maintain Ontology database and Ontology technology. So, This is complicate and not suitable for our work.
Papri [3] proposed a measure of metric with limited spelling relaxation and for particular patterns of grammar. His work applicable only for few type of grammar structures. So, his work cannot be implemented in this research.
Archana [4] provides web- based testing tool for open source exams. This tool is built on XML files and uses as data storage tier (PostgreSQL). All the Question papers are stored in XML format.
The references [2],[3],[4] proposed some tools with different techniques according to their evaluation purposes for hybrid exams but not applicable to fully descriptive answers [2].where as in reference [3]is applicable for limited spell checker and only for simple sentences. In ref [4] simply testing the answer by maintaining xml files for evaluation. In ref [3] by using vector concept they can only make the logical correction but that implementation is so complex.
Wojciech Bieniecki et al. [5] proposed an algorithm function plot for evaluating the scanned exam papers. The technology used was image processing. The answers are processed through the bitmaps. This process is time consuming process. Rein [6] proposed an intelligent system to evaluate the mathematical problems. He developed an Intelligence technology which is similar to the ‘programming languages’ technology. His research is not applicable to text type answers. Amarjeet et al. [7] proposed a model to represent the descriptive answer in the graphical form. His work is compared with standard answer by using the similarity measures for subject evaluation using tree notation.. This was implemented in graphical representation it takes more computational time. George Forman[8] focused on to build a model with support vector machines, on a single dataset .He could not achieve better accurate results and this is not flexible. The reference [8], concentrated on feature selection, text classification using data mining techniques. But their methodologies are not flexible for large data sets.
Akinori et al. [9] propose a document clustering algorithm based on formal concept analysis. This research was not taken the meaning of the text content in to consideration and the document cluster is done for only numerical data. Qinbao et.al [10] proposed and experimentally evaluated the FAST algorithm which works in two steps. In the first step, features
are divided into clusters by using graph-theoretic clustering methods. In the second step, the most representative feature is selected from each cluster to form a subset of features. Almuallim and T.G. Dietterich [11] Baker and McCallum [12] employed the distributional clustering of words to reduce the dimensionality of text data. All those methods are complex and suitable for our work.
3.
BACKGROUND
AND
RELATED
WORK
The bag-of-words model [3] is usually used to process documents. Let S be a set of n documents. S = {f1, f2….fn}. fi is
one of the documents in the set S. Let M be the set of features/words which contains all the words in each and every documents of set S. M = {m1, m2…mn}. Each document fi ,
where 1 ≤i ≤ n, can contain occurrences of different words. It can be represented as fi = <ti1, ti2…tim}, where each tij denotes
the number of occurrence of mj in document fi. The feature
reduction task is to reduce the number of features in the new word set. The new word set M’= {m’1, m’2…m’m}, such that
M and M’ will work equally well and shows the results for all the desired properties and applications with the document set S. Let S’ be the converted and reduced feature set after feature reduction. So, that S’= {f’1,f’2….f’k }. If k is much smaller
than m, then it can be assumed that the computation cost of text classification is drastically reduced. Calculating the similarity of text documents can be done with Cosine similarity measure. This is one of the most popular similarity measure applied to text documents. The documents are represented as term vectors. The angle between the two vectors can be taken as similarity measurement in Cosine similarity. This is quantified as the cosine of the angle between vectors.
The Cosine Similarity of two vectors (v1 and v2) is defined as:
Cos (v1,v2) = (v1.v2) / || v1||. || v2||
Where (v1,v2) = { v1[0] x v2[0] + v1[1] x v2[1] … }
And Where || v1|| = square-root (v1 [0] + v2 [1] …)
As a result, the cosine similarity gives the non-negative result and the result value is bounded between 0 and 1. For example, compare two identical copies of two documents d0 and d1, the
cosine similarity between d0 and d1 is 1, which means that two
documents are identical and equal. If the cosine similarity between d0 and d1 is 0, then the two documents are dissimilar
to each other.
3.1 Our Proposed Method
All the previous discussed methods of feature clustering have some problems. In the first one the number of clusters is fixed at the beginning. The second one is the computational time. The third is the accuracy. Hence, in this paper, authors presents an approach to deal with these problems and develop a feature clustering procedure, by utilizing the parts of speech components like Nouns, Pronouns, Verbs, Adverbs and Adjectives as the pre specified clusters. Later an information retrieval function is used to calculate the importance of each feature in the each specified cluster. Then unimportant features are removed from the clusters based on pre specified threshold value which can be identified based on experiments.
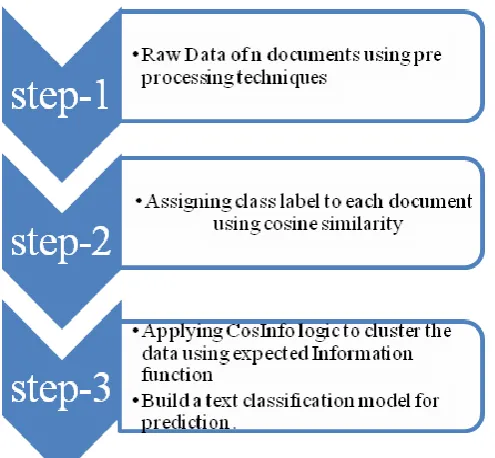
3.2 Pre-processing
Nouns, Pronouns, Verbs, Adverbs and Adjectives. All the remaining words are ignored. Next step is to assign the class labels to each document. The class labels are of two types. First class label is assigned to C1 if the answer document is
closer to the Original Answer document and second is assigned to classes C2, C3 and C4 for not related. The
closeness is decided based on Cosine similarity measure. Later expected information will be calculated to remove the less important words. The flow chart of the logic was shown in Fig: 1
[image:3.595.54.302.195.424.2]
Figure 1: Flow Chart of CosInfo Algorithm
3.3 Method explanation
First get the training documents for different set of categories. Then build a model for that category. A test document will run on that model to get the prediction. Prepare a training document d such that it contains all the important information related to that category or class.
Suppose, D is a set of n training documents d1, d2 . . . dn
together with the feature vector W of m words w1; w2; . . . ;
wm. Then divide each document in to sentences.
Find the grammar pattern in each sentence. Pattern P = Subject + verb + Object. (SVO pattern) (Or)
P = Object + verb + Subject. (OVS pattern) D0 contains {P01, P02… P0n}
D1 contains {P11, P12 … P1n}
Apply similarity process which will find the similar words in the sentences. Ignore the tenses in the verbs. Calculate the document similarity between two documents only with grammar word patterns, using cosine similarity formula. Cosine Similarity of SVO pattern
Sp =
Sim
(
do
,
dj
)
COS
(
do
,
dj
)
d
0
.
dj
|
d
0
|
.
|
dj
|
Where 0.21.0Calculate Cosine Similarity of Nouns (Sn), Pronoun, verb (Sv),
adjectives (Sadj) and adverbs (Sadv) as per eq (5).
Calculate the average Cosine similarity £ as per eq. (6). £ = (0.6 x Sp+ 0.1 x Sn+ 0.1 x Sadv+ 0.1 x Sv+ 0.1 x Sadj) ÷
5.
All the documents which average cosine value £ is more than 0.2 and less than 1.0 are sub divided in to three more classes as most similar, medium similar and less similar. The answer documents which cosine value is less than 0.2 would be classified as irrelevant document.
Construct one grammatical word POS (Parts of Speech) pattern for each sentence which are in the SVO pattern (or) OVS pattern in each document. For each sentences in documents, its grammatical word pattern Gpxi is defined as,
Gp
(7) Let S be the set of training samples, where the class label of each sample is known. Suppose there are m classes, Let S contains Sisamples of class Ci for i = 1...m, an arbitrary sample belongs to class Ci with probability Si/S, where S is the total number of samples in set S. The expected information needed to classify a given sample is.
Where I(Gpxij)
s
s
ilog2
s
s
i(7a)
Then construct one grammatical word POS pattern for each word of Nouns in W. Identify the Pronouns and assign them to the adjacent Nouns and change all the Pronouns in to respective Nouns. For word wi, its grammatical word POS
pattern of Nouns Npxi is defined as,
Np
Calculate the expected information as per eq. (8) as explained below.
Where
s
s
ilog2
s
s
i(8) Let S be the total number of nouns in all the classes from 1 to m. And Si is the total repetition of nouns in that particular class.
Construct one grammatical word POS pattern for each word of adverbs in W. For word wi, its grammatical word POS
pattern of Adverbs Advxi is defined as,
Adv
Calculate the expected information as per eq. (9) as explained below.
Where
s
s
i log2s
s
i (9) Let S be the total number of adverbs in all the classes from 1 to m. And S is the total number of adverbs in that particular class.Construct one grammatical word POS pattern for each word of Verbs in W by ignoring the tenses. For word wi, its
grammatical word POS pattern of Verbs Vxi is defined as,
V
Calculate the expected information as per eq.(10) as explained below. Where
s
s
i log2s
s
i (10)Let S be the total number of verbs in all the classes from 1 to m. And S is the total number of verbs in that particular class. Construct one grammatical word POS pattern for each word of Adjectives in W. For word wi, its grammatical word POS
pattern of Adjectives Adjxi is defined as,
Adj
Calculate the expected information as per eq. (11) as explained below. Where
s
s
i log2s
s
i (11) Let S be the total number of Adjectives in all the classes from 1 to m. And S is the total number of Adjectives in that particular class.Our task is to divide the words into clusters, based on the calculated value of expected information. A cluster contains a certain number of words, and is characterized by fixing the threshold of each word was clustered in to the various clusters based on its grammatical parts of speech. The high dimensionality reduced by calculating the expected information of that particular word and removing that word by fixing a threshold value.
3.4 Algorithm
Input: Set of Documents d0, d1, d2 ...dn
d0should be the ideal document. It contains all the necessary information. The categorization and clustering is done based on the content of d0.
Output: Set of feature clusters.
Process: Calculate the document similarity between two documents only with grammar word patterns, using cosine similarity formula. Convert the pronouns into nouns based on situation and identify the subject of sentence from each noun. Get all the nouns from each document. Get the cosine similarity for all the nouns. In the same way get cosine
similarity for adverbs, verbs, adjectives. Ignore the remaining parts of speech and words.
Calculate cosine average similarity between each document. Compare the document
0
d withd1..
n
d .Categorize all the documents as per the average cosine similarity value as C1,
C2, C3and C4.
2 . 0 0 . 0 5 . 0 2 . 0 9 . 0 5 . 0 0 . 1 9 . 0 4 3 2 1 C C C C
Divide the words of W into four clusters based on its parts of speech.
Calculate the expected information I of each word as per equation (8).
Initial expected information β = 0.6 Loop (1 to end of all the word patterns) If (the I is < β) {
Add word pattern to the cluster } else {
Remove the word pattern from W. }
end if; end loop;
Return with the created clusters; End procedure
This algorithm is used to create clusters based on the CosInfo.
4. TEXT CLASSIFICATION
At the beginning, prepare the set of D training documents which are similar, medium similar, less similar and irrelevant answer to the original answer. Then apply the CosInfo method and categories them as different classes. Later take all the words in all the documents and cluster them using CosInfo method. The clustered documents were taken as training data to the linear SVM and a classifier based on Support vector machines (SVM) is built. Note that any classifying technique other than SVM can be used. A test document will be fed in to SVM to classify the class of that document. The SVM takes a set of input data and predicts the class label of the test data. At the beginning it takes the input data as training data and prepares a model. There are two possible classes’ forms the input, making the SVM a non- probabilistic binary linear classifier. Given a set of training examples, each marked as belonging to one of two categories, an SVM training algorithm creates a model that assigns new examples into one category or the other.
Then feed d to the classifier to obtain n values, one from each SVM. Then the unknown document d belongs to those classes with SVM output 1. For example, consider our example with four classes’ C1, C2, C3and C4. If the four SVMs output is 1,
-1,-1 and -1, respectively, then the predicted classes will be c1 for this document. If the four SVMs output is 1, -1, -1, 1 respectively, the predicted classes will be c1 and c4 .
5. EXPERIMENTAL RESULTS
Experimental results were conducted the test using test data to find the accuracy of our CosInfo clustering method. A confusion matrix was built to find the Precision and Recall. A confusion matrix contains information about actual and predicted classification done by our classification model. Performance of the model is evaluated using the data in matrix. The table no: 1 and Table No: 2 shows the confusion matrix and error report of our classification model for training data. The table No: 3 and Table No: 4 shows the confusion matrix and error report of our classification model for test/validation data. The table No:5 is used for explanation of the formulae. The excel miner tool was used in the analysis of experimental results.
[image:5.595.319.536.161.514.2]Training Data scoring - Summary Report
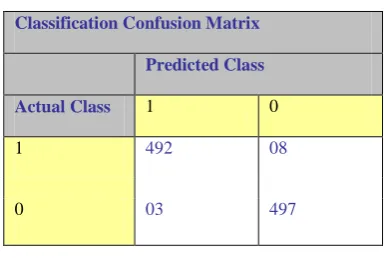
Table 1: Confusion matrix of classification model
Classification Confusion Matrix
Predicted Class
Actual Class 1 0
1 492 08
0 03 497
[image:5.595.70.263.332.461.2]492 are the 1’s correctly classified as “1” 08 are the incorrectly classified as “0” 03are the 0’s incorrectly classified as “1” 497 are the 0’s correctly classified as 0
Table 2: Error report of classification model
Error Report
Class Cases Errors % Error
1 500 8 1.60
0 500 3 0.06
Overall 1000 11 1.10
Accuracy: (Acc) this is the most common and simplest measure to evaluate a classifier. It is just defined as the degree of right predictions of a model (or conversely, the percentage of misclassification errors). [13]
m
)
j
,
i
(
C
)
j
,
i
(
f
Acc
c
1 j m
1
i
The overall error rate = 1.10 Accuracy = 1- error rate = 98.90
Which is very high and it was proved that as our method is good.
Validation Data scoring - Summary Report
Table 3: Classification confusion matrix
Classification Confusion Matrix
Predicted Class
Actual
Class 1 0
1 426 74
0 34 466
Table 4: Error Report
Error Report
Class Cases Errors % Error
1 500 74 14.80
0 500 34 6.80
[image:5.595.317.539.535.652.2]Overall 1000 108 10.80
Table 5: Classification confusion matrix
Classification Confusion Matrix
Actual Class
Predicted Class 1 0
1 True positive False positive
0 False negative True negative
Precision = True positives ÷ number of predicted positives Precision = True positives ÷ (true positives + False positives) = 492 ÷ 492+8 = 0.984
[image:5.595.55.281.554.663.2]After careful observation of those two measures, our model based on CosInfo method proved best.
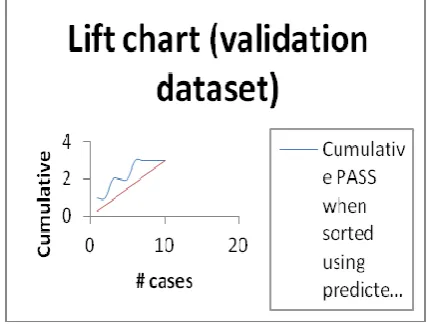
Lift is a measure of the effectiveness of a predictive model calculated as the ratio between the results obtained with and without the predictive model (classify all records as belonging to the most prevalent class).
[image:6.595.323.533.71.232.2]Lift Curve: Using the predictive of the response model, calculate the percentage of positive responses for the percentage of samples tested. And map these points to create Lift curve. The lift charts for our model is shown in Fig: 2 and Fig: 3
Figure 2: Lift chart for Training data set
The test was conducted using both training data set and test/ validation Data sets. By careful observation of both training and validation data sets, our model works very well.
Figure 3: Lift chart for test data set
CosInfo Method was compared with other method like manual evaluation. Consider four categories of documents. They are pure theoretical subjects. Semi theoretical subjects (theory subjects with diagrams), Formula based subjects (like Physics and Chemistry) and Mathematical subjects. The experimental results show that our method CosInfo works well & obtains satisfactory results.
0 1 2 3 4 5 6 7
CINF(CosInfo)
[image:6.595.56.278.204.393.2]Manual Evaluation
Figure 4: Comparative chart
6. CONCLUSION
This paper presents a novel approach to evaluate the descriptive type answers using proposed CosInfo Method. Authors proposed a novel clustering algorithm for text classification by utilizing Information retrieval function that solves the problem of descriptive type Exams evaluation.But this method is good for only essay type exams and this is not working well for formula based type questions and Mathematical type questions.
7.
REFERENCES
[1] Jung-Yi Jiang, et al. “A Fuzzy Self-Constructing Feature Clustering Algorithm for Text Classification” - IEEE, Vol. 23, March 20011, No 3, 335-348.
[2] Elsayed et al. “Automatic evaluation technique for certain types of open questions in semantic learning systems”. Journal of Human-centric Computing and Information, Springer Berlin Heidelberg, 2013, Vol.3(1), 1-15.
[3] Papri Chakraborty. “Developing an Intelligent Tutoring System for Assessing Students' Cognition and Evaluating Descriptive Type Answers”-International Journal of Modern Engineering Research (IJMER) Vol.2, May-June 2012, Issue.3.
[4] Archana et al..” A Tool for Managing Descriptive Type Examinations” – In: International Conference on Management Technology for Educational Practices. 29th & 30th July 2009, Jnana Jyothi Auditorium, Central College Camous, Bengaluru India.
[5] Wojciech et al. “Automatic evaluation of examination tasks in the form of function plot” - proc. MEMSTECH’2010, 20-23 April 2010, Polyana-Svalyava (Zakarpattya), UKRAINE.
[6] Rein P. “Prospects of automatic assessment of step-by-step solutions in algebra “ Proceedings of the ninth IEEE international conference on advanced learning technologies. IEEE Computer Society, Washington, DC, USA, 2009,535–537. 10.1109/ICALT.2009.123. [7] Amarjeet et al. “Algorithm for Automatic Evaluation of
Single Sentence Descriptive Answer” International Journal of Inventive Engineering and Sciences (IJIES) , August 2013, ISSN: 2319–9598, Volume-1, Issue-9. [8] George Forman. “An Extensive Empirical Study of
[image:6.595.59.276.456.618.2][9] Akinori et al. ”Order-based clustering using formal concept analysis” - World Automation Congress, TSI Press. 2010.
[10]Qinbao et al. “A Fast Clustering-Based Feature Subset Selection Algorithm for High-Dimensional Data “- IEEE transactions on knowledge and data engineering, vol. 25, no. 1, January 2013.
[11]H. Almuallim et al. “Algorithms for Identifying Relevant Features”- Proc. Ninth Canadian Conf. Artificial Intelligence, 1992, 38-45.