http://dx.doi.org/10.4236/ojtr.2015.34016
Body Mass Index and Health Related
Physical Fitness in Saudi Girls and
Adolescents Aged 8 - 15 Years
Zahra A. Al-Asiri
1, Afaf A. M. Shaheen
21Department of Physical Therapy, Prince Sultan Military Medical City,Riyadh, Kingdom of Saudi Arabia 2Department of Basic Sciences, Faculty of Physical therapy, Cairo University, Cairo, Egypt
Received 23 August 2015; accepted 1 November 2015; published 4 November 2015
Copyright © 2015 by authors and Scientific Research Publishing Inc.
This work is licensed under the Creative Commons Attribution International License (CC BY). http://creativecommons.org/licenses/by/4.0/
Abstract
Health related physical fitness (HRPF) is considered to be an indirect marker of a person’s health and wellbeing, reflecting the interplay and integration of many persons’ systems and body func-tions. Purpose: To investigate the relationship between body mass index (BMI) and HRPF in a na-tional cross-secna-tional sample of Saudi girls and adolescents. Methods: Weight, height and four components of HRPF (body fat composition, strength and endurance, flexibility and cardio-respir- atory fitness) were measured in three age groups [(8 - 10), (11 - 12) and (13 - 15) years]. Pearson correlation coefficient and regressions analysis using a non-linear quadratic model were used to evaluate the relationship between BMI and HRPF in three age groups. Results: The results revealed variable relationships among tests. Lower scores in body fat composition and cardio-respiratory fitness were associated with higher body mass indexes in each age group. Also lower scores in muscle strength and endurance were recorded in girls aged from 11 to 15 years. Relationships between BMI and flexibility differed among age groups. Conclusion: BMI significantly and diffe-rentially influenced individual HRPF, but effects varied with age. Higher body mass indexes were generally associated with lower HRPF. The level of HRPF determined by this study may serve as an indicator of potential health risks that overweight and obese children girls and adolescents faced.
Keywords
Body Mass Index, Saudi Children Girls and Adolescents, Health-Related Physical Fitness
1. Introduction
reflecting the interplay and integration of many persons’ systems and body functions (musculoskeletal, cardio- respiratory, hemato-circulatory, psycho neurological and body composition) [1]. The concept of HRPF is opera-tionalized as a composite of cardio-respiratory fitness (CRF), musculoskeletal function of the lower trunk (ab-dominal muscle strength and endurance and lower back and hamstring flexibility) and body fat composition (fat %), specifically adiposity. Also, HRPF includes a morphological (body mass for height, subcutaneous fat distribution, abdominal visceral fat, and bone density) and metabolic (glucose tolerance, insulin sensitivity, lipid and lipoprotein metabolism, substrate oxidation characteristics) component [2]. Over the past decades there has been a decline in HRPF, accompanied by a decrease in physical activity (PA) levels and an increase in the pre-valence of overweight and obesity [1].
The worldwide epidemic of obesity in children and adolescents has heightened interest in relationships be-tween elevated BMIs, interpreted as excess fatness, and HRPF [3]. The prevalence of childhood obesity is rising rapidly and had raised the concern in Kingdom of Saudi Arabia (KSA). The overall prevalence of overweight and obesity in otherwise Saudi healthy children and adolescents aged from 5 to 18 years is 23.1% and 9.3% re-spectively [4]. Childhood and adolescents are crucial periods of life, since dramatic physiological and psycho-logical changes take place at these ages. Childhood obesity often persists into adulthood, 50% - 80% of obese children will grow up to become obese adults and it is harder to treat obesity in adults than in children [5].
Understanding the relationship between BMI and HRPF, measured by valid and reliable tests, will provide key information to aid the design of strategies to reduce the prevalence of cardio metabolic risk factors among children and adolescents. However, relatively few studies deal with HRPF components across a broad range of BMI in children and adolescents. Moreover no planned attempt had been made to study HRPF in KSA. Data on the relationship between BMI and HRPF among children and adolescents in Riyadh city could thus provide a valuable insight for KSA. This study aimed to investigate the relationship between BMI and four components of HRPF in a national sample of Saudi children’ girls and adolescents 8 - 15 years of age.
2. Method
Data were collected in period from September until the end of December 2013. The study was approved by eth-ical committee of Collage of Applied Medeth-ical Science (CAMS), King Saud University (KSU), and by ministry of education. It was funded by King Abdul-Aziz City for Science and Technology.
2.1. Subjects
This cross-sectional study included 304 Saudi girls aged between 8 - 15 years. They were recruited from prima-ry and intermediate governmental schools in Riyadh city using geographical cluster method. The sample was di-vided into three age groups that approximated different developmental stages: group І (8 - 10 years: late child-hood, transition into adolescence), group ІІ (11 - 12 years: adolescent spurt) and group III (13 - 15 years: late adolescence) [3]. Within each age group, girls were classified into four BMI categories based on age and sex- specific percentiles, into underweight ≤ 5th percentile,normal weight > 5thto ≤85th percentile, overweight > 85th
to ≤95th percentile and obese >95th percentile [6]. The girls were free from musculoskeletal, metabolic or cardio
respiratory problems that would prevent carrying out the fitness test.
2.2. Procedures
After granted permission from officials at each school, a self-assessment of health status checklist was distri-buted to all students for the purpose of identifying those not able to participate in fitness testing. The simple and clear Arabic checklist was completed and signed by girls in the higher grades and by parents/guardians of girls in the lower grades. Parents/guardians and girls were provided with contact information to answer any question or query regarding the self-assessment checklist. Girl and/or parent signatures were accepted as informed con-sent.
respiratory fitness (CRF): queen college step test (QCST). Individual test protocols were as follows:
SFT was measured on right side (right biceps and calf muscles) from sitting position and girls were instructed to relax. The triceps and calf skin folds have been chosen for because they are easily measured and highly cor-related with total body fatness. The caliper measures a double layer of subcutaneous fat and skin. Firmly grasp skin fold between the thumb and forefinger and lift it away from the other body tissue. Be sure the caliper is in the middle of the fold. Each measurement was taken three times, and the mean value was taken. Each reading was recorded to the nearest 0.5 millimeters (mm). The body fat % was determined according to age and gender [7] andwas calculated using the specific equation for girls = 0.610 × (triceps SFT [mm] + calf SFT [mm]) + 5.1. The protocol is described in the Fitness gram Test Administration Manual [8].
Muscular endurance is defined as the ability of specific muscle groups to sustain muscular force through re-peated contractions to a point of fatigue [9]. Abdominal muscle endurance can be evaluated using repeated curl-ups performed to exhaustion (number/min). Tell subject to extend arms forward with fingers resting on legs and pointing toward knees. The curl-up was selected because it does not involve the assistance of the hip flexor muscles and minimizes compression in the spine compared with a full sit-up with the feet held .All subjects had 5 minutes of standardized explanation and practice time; the protocol is described in the Fitness gram Test Ad-ministration Manual [8].
The flexibility test was administered using a specially constructed box with a slide ruler attached to the top of the box. The height of the box was 33 cm. The girl was seated on the floor with both legs fully extended, shoul-der width apart, and feet placed flat against the box. With one hand on top of the other and the knees fully ex-tended, the participant slowly reached forward (without jerking) as far away as possible, sliding the hands across the top of the ruler, and held the final position for at least two seconds. The SRT score in centimeters was regis-tered as the final position of the fingertips on or towards the ruler. Higher scores indicated better performance. A reach distance of 15 cm corresponded with the position of the feet against the box. The score was negative if the girl could not touch the front of the box with her fingertips, where the “0” point is located. The test was per-formed twice, and the average was calculated and recorded [10].
Step test was performed using a step of 41.3 cm height. Stepping was done for a total 3 minutes at a rate of 22 cycles per minute which was set by metronome. After completion of the exercise, the subjects were asked to remain standing comfortably and the carotid pulse rate was measured from the fifth to the twentieth second of the recovery period. This 15 second pulse rate was converted into beats per minute and the following equation was used to predict VO2 max for girls. VO2 max (ml/kg/min) = 65.81 − (0.1847 × pulse rate in beats per min)
[11].
The scores of HRPF tests were used to classify girls as fit or unfit depending on their success or failure to reach the healthy fitness for a given test according to the healthy zone reported in Fitness Gram Test Adminis-tration Manual.
2.3. Data Analysis
Means (M), standard deviations (SD) of age, weight, height, BMI and fit rates (Fit/Unfit) of different tests were calculated according to age. Pearson correlation coefficient (r) and regressions analysis using non-linear qua-dratic model were used to evaluate the relationship between BMI and each HRPF component. HRPF component was the dependent variable and BMI, and BMI squared were independent variables: fitness item = a × BMI2 + b × BMI + c, where a, b and c, were constants. The confidence interval 95% was assigned therefore P value ≤ 0.05 was considered. Statistical package for social sciences (SPSS) program (version 19) was used for statistical analysis.
3. Results
The girls’ anthropometric characteristics for the entire sample were presented in Table 1.
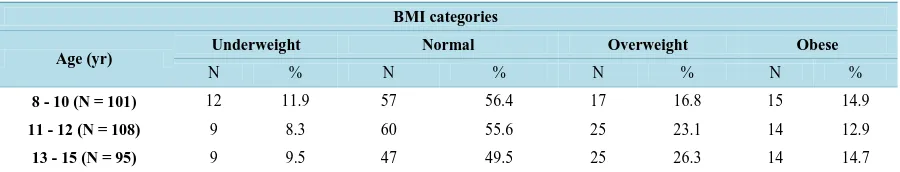
According to the set criteria about 9.9% of the girls were underweight, 54.13% had a normal BMI, 21.12% were overweight and 14.19% were characterized as obese. Regarding to age groups, the prevalence was rela-tively high in adolescents aged 13 to 15 years where 26.3% and 14.7% are overweight and obese respecrela-tively Table 2.
Table 1. Anthropometric characteristics of participated of girls (N = 304).
Anthropometric Characteristics M± SD Max Min
Age (Yr) 11.39 ± 1.78 15.00 8.00
Weight (kg) 44.47 ± 13.85 88.30 18.70
Height (cm) 145.78 ± 10.82 169.00 116.00
BMI (%) 63.55 ± 31.23 99.00 1.00
[image:4.595.89.539.231.317.2]M: Mean, SD: Standard deviation, Min.: Minimum, Max.: Maximum, Yr: Year, kg: Kilogram, cm: Centimeter, BMI: Body mass index, %: Percen-tile.
Table 2. Sample size and percentage of children’ girls and adolescents within BMI categories defined by percentiles in each age group
BMI categories
Age (yr) Underweight Normal Overweight Obese
N % N % N % N %
8 - 10 (N = 101) 12 11.9 57 56.4 17 16.8 15 14.9
11 - 12 (N = 108) 9 8.3 60 55.6 25 23.1 14 12.9
13 - 15 (N = 95) 9 9.5 47 49.5 25 26.3 14 14.7
[image:4.595.85.540.357.448.2]Yr: Year, %: Percentage, N: Number.
Table 3. Mean, standard deviation and percentage (95% CI) of success in the different tests of HRPF
Age (Yr)
SFT (Fat%) PCUT (Count/min) SRT (in)
QCST (Predicted VO2 max ml/kg/min)
M ± SD % Fit (95% CI) M ± SD % Fit (95%CI) M ± SD % Fit (95%CI) M ± SD
8 - 10 28.74 ± 8.16 67.3% (27.10 - 30.39) 26.01 ± 4.90 95% (25.06 - 26.96) −0.06 ± 2.95 26.7% (−0.66 - 0.6) 39.05 ± 3.74
11 - 12 32.57 ± 8.80 54% (30.95 - 34.25) 26.20 ± 5.65 89.7% (26.16 - 28.39) −0.94 ± 3.41 15.9% (−1.59 - 0.31) 38.65 ± 3.36
13 - 15 34.96 ± 8.25 41.6% (33.27 - 36.68) 27.51 ± 4.81 68.5% (26.51 - 28.48) −0.66 ± 3.67 6.7% (−1.38 - 0.10) 38.64 ± 2.77
[image:4.595.87.540.497.566.2]Yr: Year, M: Mean, SD: StandardDeviation, SFT: skin fold thickness, %: percentage, PCUT: partial curl up test, Count/min: number/minute, SRT: sit- and- reach test, in: inch, QCST: Queen Collage step test, ml/kg/min: milliliter/kilogram/minute.
Table 4. Correlations (r) and R2 between BMI and HRPF tests depend on age group.
Age SFT(fat %) PCUT (count/min) SRT (in) QCST (predicted VO2 max)
r R2 r R2 r R2 r R2
8 - 10 0.77* 0.63* 0.32* 0.10 −0.17 0.05 −0.39* 0.18*
11 - 12 0.76* 0.62* 0.09 0.08* 0.19* 0.05 −0.15 0.17*
13 - 15 0.74* 0.65* −0.06 0.09* 0.12 0.14* −0.04 0.19*
*
Correlations and relationships are significant at P < 0.05; R2 values are derived from the full, non-linear quadratic model.
68.5% to 95% of girls being fit. In the SFT the fit rates were lower where 41.6% to 67.3% were fit. The lowest rates of fitness were found in SRT where only 6.7% to 26.7% were fit. With increasing age, the average perfor-mance of nearly all tests increases, although this was not the case of fit rates.
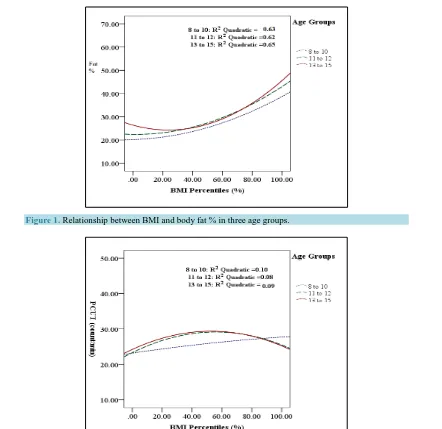
Correlations and R2 values between BMI and HRPF components derived from the non-linear quadratic model were summarized in Table 4. Correlations and relationships are highest between BMI and SFT and lowest be-tween BMI and SRT. Relationships bebe-tween BMI and HRPF components, including results of modeling, were illustrated in Figures 1-4.
Figure 1. Relationship between BMI and body fat % in three age groups.
Figure 2. Relationship between BMI and abdominal muscles strength and endurance in three age groups.
[image:5.595.180.450.82.288.2]The relationship between BMI and abdominal muscles strength and endurance was significant in girls aged 11 - 15 years. In younger age group, the relationship between BMI and abdominal muscles strength and endurance was linear. While in older age groups, best PCUT performances were apparent in girls with BMI 40th to 60th percentile (normal weight), performances then decline with an increase in BMI in girls aged 11 - 15 years (Figure 2). Across all age groups, the lowest relationship occurs in girls aged 8 - 10 years with 5% were unfit and the highest relationship occurs in adolescents aged 13 - 15 years where 31.5% were unfit (Table 4).
Table 4 and Figure 3 illustrated that the relationship between BMI and lower back and hamstring muscles flexibility increase as age increase and non- significant relationship between BMI and muscles flexibility in girls aged 8 - 12 years. With increasing age, the relationship becomes parabolic and peak of parabola shifts to right. The best SRT scores were apparent with BMI of 40th to 80th percentile (normal weight) and muscles flexibility was significantly poorest at the high and low extremes of BMI in girls aged 13 - 15 years old. The percentage of unfit in each age group was 73.3%, 84.1% and 93.3% respectively.
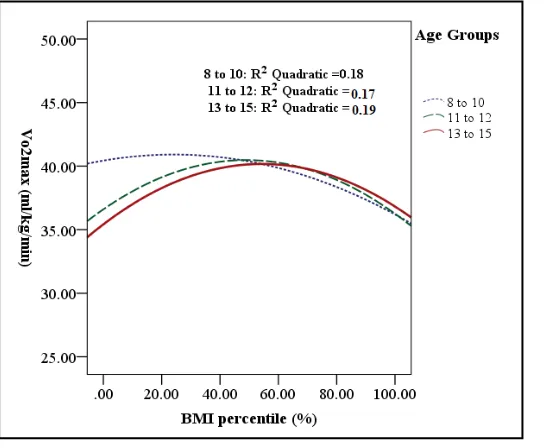
Figure 4 and Table 4 showed a significant relationship between BMI and CRF (predicted VO2 max) across
[image:5.595.183.446.316.513.2]Figure 3. Relationship between BMI and lower back and hamstring muscle flexibility in three age groups.
Figure 4. Relationship between BMI and CRF in three age groups.
8 - 10 years. In the tow older age groups, VO2 max was reasonably similar in underweight, and obese. Across all
age groups, poorest predicted VO2 max occur with highest BMIs and best predicted VO2 max occur with normal
weight.
4. Discussion
To our knowledge, it is the first study to investigate the relationship between BMI and different components of HRPF in a national sample of Saudi girls 8 - 15 years of age. The results of this study provide data on the preva-lence of underweight, normal weight, overweight and obesity among Saudi children’ girls and adolescents.
[image:6.595.182.455.335.559.2]our findings are of concern and represent a serious public health problem that should be addressed within this unique population in future studies.
Based on the prevalence of underweight, overweight and obesity in the sample, we found that the normal weight girls generally had better HRPF than their underweight, overweight and obese peers. Such an association between weight status and HRPF has also been observed by Mak et al., 2010 [13] and Monyeki et al., 2012 [14] and was described as inverted association.
Relationship between BMI and HRPF vary with test item, among age groups. HRPF scores were lower in children with increase BMI. An inverse relationship was found between BMI and HRPF components except lower back and hamstring muscles flexibility.
Body fat % is very important component of HRPF. People whose body fat % is optimal tend to be healthier. Hence, more attention should be placed on the way of healthy lifestyle among Saudi children and adolescents. The current study showed that overweight and obese girls had higher fat % mean than did normal weight in all age groups. Body fat % increased with age where obese adolescents 13 - 15 showed the highest fat % mean. As expected, there are strong positive correlation and relationship between BMI and body fat % in all age groups. The results are consistent with previous literature [15]-[17].
Probably the negative lifestyle coupled with increased energy intake seems to be the reason for this type of trend in the present study. The trend of increase in fatness in the girls of the present study is a signal for the health planners and if remedial measures are not planned in time, the consequences of this will be bad. The ob-servation needs to be taken seriously because increased body fat is known to be associated with a wide variety of health problems.
For all over essential basic activities both muscle strength and endurance are required, as well as preventing and controlling various disease and the implications for reducing functional impairments and disability [18]. The relationship between BMI and abdominal muscles strength and endurance was linear in girls aged 8 - 10 years. The fitness rates of abdominal muscles strength and endurance in children aged 8 - 10 years were 95% with in-creasing age the lower fit rate was observed where 68.5% of adolescents aged 13 - 15 years are considered fit, which in line with Pereira et al., 2011 [1].
One of the reasons of this suggested that PA was significantly higher in the children than in the adolescent [19]. Recent research also indicates that during adolescence PA sharply decline and sedentary behaviors signifi-cantly increase [20][21].
In girls 11 - 15 years of age, the relationship between BMI and abdominal muscles strength and endurance was parabolic, Above a BMI ~ 60th percentile, the scores of PCUT decline with increasing BMI. The decline was initially slight but accelerates with increasing BMIs. Obese performed poorer in abdominal muscles strength and endurance compared with normal weight. The results are in agreement with previous studies from Portu-guese [1], Hong Kong [13], Malaysia [22], Greek [23], Taiwanese [24], and Flemish [25].
In line with previous studies conducted by Mak et al.[3] and Aboshkair et al.[22] the underweight children and adolescents demonstrated a decreasing trend of performance in PCUT compared to normal weight. However, some previous studies indicated no significant differences in performance for abdominal muscles strength and endurance between underweight and normal children and adolescents [26].
Muscle strength and endurance becomes more important if it is related to the abdominal region. Flabby mus-cles of the abdomen having low tone invite deposition of fat in the abdominal adipose area along with protrusion of belly that can lead to the development of biomechanical problems related to posture and can affect the spinal nerves. The poor abdominal muscles strength and endurance exhibited by girls of the present study, point to the negative lifestyle being lead by them. In order to have a healthy adult population, it is important to create awareness among the general public about the importance of HRPF among the girls of KSA.
With regard to lower back and hamstring muscles flexibility, literature [3][15] [17] [24] [27] indicates no significant differences between children 8 - 12 years old in different BMI categories, and these findings are con-firmed by the results of this study, although there is a decreasing tendency of fitness rate present with an in-crease of BMI. Also, another study has shown that BMI was significantly associated with SRT in Taiwan child-ren and adolescents aged 7 - 18 years [24]. We cannot assert causality from the results of this study, but further research is needed to explore flexibility in children and adolescents and what factors may be influencing them to be more flexible.
lower BMI in adolescents which similar to results obtained by Aboshkair et al.[22] and Wu et al.[28] where the individual differences in timing of the growth spurt are a potential confounder.
In disagreement with the results of current study, Deforche et al. [25] found that lower back and hamstring muscles flexibility did not differ between obese and non- obese Flemish adolescents in both sexes aged 12 to 18 years. The difference between our result and result of Deforche et al. may be due to many factors such as sex, PA and differences in maturational status which should be further investigated.
In the present study CRF was the strongest factor that influenced by BMI. The girls of normal weight have higher predicted VO2 max mean than the overweight or obese. The predicted VO2 max therefore decreased
pro-gressively as BMI increased. These results are in agreement with several studies showing low level of CRF in obese children and adolescents [1][3][7][13] [15] [22] [26]-[31].
The lower level of CRF in obese children and adolescents of the present study reflects on their habitual life style. In addition, the results of this study showed that the underweight had significant decreasing trend of per-formance in CRF from normal weight. These finding was in agreement with the results reported by Monyeki et al., [4] Mak et al., [13], and Aboshkair et al., [22].
Low levels of HRPF among overweight and obese Saudi children’ girls and adolescents indeed are alarming because childhood HRPF is linked with the adult HRPF status. The HRPF is negatively affected to a great de-gree in children between the ages of 8 and 15 years who are overweight and obese. Although the negative health effects of poor HRPF are not necessarily present at this age as a sickness or a disease, it is apparent that child obesity is the precursor of various chronic diseases in adulthood, which includes hypertension, type II diabetes mellitus, coronary heart disease and hyperlipidaemia. Statistics worldwide also indicate that the obesity rates seen among young children will most probably not improve in the future.
5. Strength and Limitation of the Study
The findings of the present study should be interpreted in light of its strengths and limitations. The information stemming from this study may add to existing knowledge about the relationship between BMI and HRPF among children and adolescents in Riyadh city and may provide a valuable insight for KSA. In addition, HRPF tests used in this study are valid and reliable.
However, we must also acknowledge some of the limitations of the present study. Firstly, only four HRPF tests were measured which were not able to assess the overall HRPF. Secondly, we only collected the informa-tion on girls aged 8 - 15 years in Riyadh city which make difficulty in generalizainforma-tion of the results of current study. The study was applied on girls only due customs and traditions of KSA. The HRPF is a function of both PA and non-modifiable factors such as genetics. Because we didn’t measure PA and other factors, we cannot determine their relative contribution. In addition, the cross-sectional design of the study does not permit us to distinguish whether low HRPF precedes or follows excess body weight. Longitudinal studies are needed to de-termine the directionality of the relationship between HRPF and obesity.
6. Conclusion
In summary, the relationship between BMI and HRPF varies with test item and among age groups. Lower fit-ness level in SFT and QCST is evident in each age group with higher BMIs. Also, lower PCUT scores recorded in girls aged 11 to 15 years with higher BMIs. Results for SRT vary among age groups. BMI significantly af-fects HRPF of children girls and adolescents. This study may serve as guidelines for physiotherapists when conducting HRPF assessment, in clinical decision making, designing and compilation of intervention programs for school children and adolescents who are between the ages of 8 and 15 years.
Acknowledgements
The study was supported and funded by King Abdul-Aziz City for Science and Technology (No: 35-244)— Riyadh—Kingdom of Saudi Arabia.
References
http://dx.doi.org/10.3109/17477161003792549
[2] Ujevic, T., Sporis, G., Milanovie, Z. and Neljak, B. (2013) Differences Between Health-Related Physical Fitness Pro-files of Croatian Children in Urban and Rural Areas. Collegium Antropologicum, 1, 75-80.
[3] Huang, Y. and Malina, R. (2010) Body Mass Index and Individual Physical Fitness Tests in Taiwanese Youth Aged 9-18 Years. International Journal of Pediatric Obesity, 5, 404-411. http://dx.doi.org/10.3109/17477160903497902 [4] El-Mouzan, M.I., Foster, P.J., Al-Herbish, A.S., Al-Omer, A.A., Qurachi, M.M. and Kecojevic, T. (2010) Prevalence
of Overweight and Obesity in Saudi Children and Adolescents. Annals of Saudi Medicine, 30, 203-208.
http://dx.doi.org/10.4103/0256-4947.62833
[5] Shah, C., Diwan, J., Rao, P., Bhabhor, M., Gokhle, P. and Mehta, H. (2008) Assessment of Obesity in School Children.
CMJ, 6, 1-8.
[6] WHO (2009) Global Health Risks: Mortality and Burden of Disease Attributable to Selected Major Risks.
http://www.who.int/healthinfo/global_burden_disease/GlobalHealthRisks_report_full.pdf
[7] Ostojic, S.M., Stojanovic, M.D., Stojanovic, V., Maric, J. and Njaradi, N. (2011) Correlation between Fitness and Fat-ness in 6-14-Year-Old Serbian School Children. JHPN, 29, 53-60.
[8] Meredith, M.D. and Welk, G.J. (1999) Fitness Gram Test Administration Manual. 2nd Edition, Human Kinetics, Champaign, IL, 3-32.
[9] Docherty, D. (1996) Field Tests and Test Batteries. In: Docherty, D., Ed., Measurement in Pediatric Exercise Science, Human Kinetics, Champaign, IL, 294.
[10] Castro-Piñero, J., Chillón, P., Ortega, F.B., Montesinos, J.L., Sjöström, M. and Ruiz, J.R. (2009) Criterion-Related Va-lidity of Sit-and-Reach and Modified Sit-and-Reach Test for Estimating Hamstring Flexibility in Children and Adoles-cents Aged 6-17 Years. International Journal of Sports Medicine, 30, 658-662.
http://dx.doi.org/10.1055/s-0029-1224175
[11] Chatterjee, S., Chatterjee, P. and Bandyopadhyay, A. (2005) Cardio Respiratory Fitness of Obese Boys. Indian Journal of Physiology and Pharmacology, 49, 353-357.
[12] El-Mouzan, M.I., Al-Herbish, A.S., Al-Salloum, A.A., Al-Omar, A.A. and Qurachi, M.M. (2012) Regional Variation in Prevalence of Overweight and Obesity in Saudi Children and Adolescents. SJG, 18, 129-132.
http://dx.doi.org/10.4103/1319-3767.93818
[13] Mak, K., Ho, S., Lo, W., Thomas, G., McManus,M.A., Day, R. andLam, T. (2010) Health Related Physical Fitness and Weight Status in Hong Kong Adolescents. BMC Public Health, 88, 1-5.
http://dx.doi.org/10.1186/1471-2458-10-88
[14] Monyeki, M.A., Neetens, R., Moss, S.J. and Twisk, J. (2012) The Relationship between Body Composition and Physi-cal Fitness in 14 Year Old Adolescents Residing within the Tlokwe LoPhysi-cal Municipality, South Africa: The PAHL Study. BMC Public Health, 12, 374. http://dx.doi.org/10.1186/1471-2458-12-374
[15] Erdmann, L. and McMillan, C. (2011) Longitudinal Relations of Body Composition Field Measures to Health-Related Physical Fitness Components in Children. International Journal of Body Composition Research, 9, 11-18.
[16] Tremblay, M.S., Shields, M., Laviolette, M., Craig, C.L., Janssen, I. and Connor Gorber, S. (2010) Fitness of Canadian Children and Youth: Results From the 2007-2009 Canadian Health Measures Survey. Statistics Canada—Health Re-ports, 21, 7-20.
[17] Truter, L., Pienaar, A. and Du Toit, D. (2010) Relationships between Overweight, Obesity and Physical Fitness of Nine to Twelve-Year-Old South African Children. South African Family Practice, 52, 227-233.
http://dx.doi.org/10.1080/20786204.2010.10873979
[18] Seguin, R. and Nelson, M. (2003) The Benefits of Strength Training for Older Adults. American Journal of Preventive Medicine, 25, 141-149. http://dx.doi.org/10.1016/S0749-3797(03)00177-6
[19] Chung, A.E., Skinner, A.C., Steiner, M.J. and Perrin, E.M. (2012) Physical Activity and BMI in a Nationally Repre-sentative Sample of Children and Adolescents. Clinical Pediatrics, 51, 122-129.
http://dx.doi.org/10.1177/0009922811417291
[20] Al-Hazzaa, H.M., Al-Nakeeb, Y., Duncan, M.J., Al-Sobayel, H.I., Abahussain, N.A., Musaiger, A.O., Lyons, M., Col-lins, P. and Nevill, A. (2013) A Cross-Cultural Comparison of Health Behaviors between Saudi and British Adoles-cents Living in Urban Areas: Gender by Country Analyses. International Journal of Environmental Research and Pub-lic Health, 10, 6701-6720. http://dx.doi.org/10.3390/ijerph10126701
[21] Mitchell, J.A., Pate, R.R., Dowda, M., Mattocks, C., Riddoch, C., Ness, A.R. and Blair, S.N. (2012) A Prospective Study of Sedentary Behavior in a Large Cohort of Youth. Medicine & Science in Sports & Exercise, 44, 1081-1087.
http://dx.doi.org/10.1249/MSS.0b013e3182446c65
[23] Tokmakidis, S.P., Kasambalis, A. and Christodoulos, A.D. (2006) Fitness Levels of Greek Primary Schoolchildren in Relationship to Overweight and Obesity. European Journal of Pediatrics, 165, 867-874.
http://dx.doi.org/10.1007/s00431-006-0176-2
[24] Chen, L.J., Fox, K.R., Haase, A. and Wang, J.M. (2006) Obesity, Fitness and Health in Taiwanese Children and Ado-lescents. European Journal of Clinical Nutrition, 60, 1367-1375. http://dx.doi.org/10.1038/sj.ejcn.1602466
[25] Deforche, B., Lefevre, J., De Bourdeaudhuij, I., Hills, A.P., Duguet, W. and Bouckaert, J. (2003) Physical Fitness and Physical Activity in Obese and Non Obese Flemish Youth. Obesity Research, 11, 434-444.
http://dx.doi.org/10.1038/oby.2003.59
[26] Shang, X., Liu, A., Li, Y., Hu, X., Du, L., Ma, J., Xu, G., Li, Y., Guo, H. and Ma, G. (2010) The Association of Weight Status with Physical Fitness among Chinese Children.International Journal of Pediatrics, 2010, 1-6.
http://dx.doi.org/10.1155/2010/515414
[27] Malina, R.M., Pena Reyes, M.E., Tan, S.K. and Little, B.B. (2011) Physical Fitness of Normal, Stunted and Over-weight Children 6-13 Years in Oaxaca, Mexico. European Journal of Clinical Nutrition, 65, 826-834.
http://dx.doi.org/10.1038/ejcn.2011.44
[28] Wu, M., Lin, C., Chen, S. and Wang, C. (2012) Three Year Evolution of Physical Fitness and BMI in Schoolchildren Aged 12-16 Years with Extreme Body Mass Index. Kinesiology, 1, 39-46.
[29] Heroux, M., Onywera, V., Tremblay, M.S., Adamo, K.B., Lopez, J.T., Jauregui, E. and Janssen, I. (2013) The Relation between Aerobic Fitness, Muscular Fitness, and Obesity in Children from Three Countries at Different Stages of the Physical Activity Transition. ISRN Obesity, 2013, 1-10. http://dx.doi.org/10.1155/2013/134835
[30] Sugiyama, K. and Hamlin, M. (2013) Relationships between Physical Fitness and Body Mass Index in 11 and 12 Year Old New Zealand and Japanese School Children. Journal of Development Studies, 1, 195-206.
[31] Puder, J., Schindler, C., Zahner, S.L. and Kriemler, S. (2011) Adiposity, Fitness and Metabolic Risk in Children: A Cross-Sectional and Longitudinal Study.International Journal of Pediatric Obesity, 6, e297-e306.