2018 International Conference on Physics, Computing and Mathematical Modeling (PCMM 2018) ISBN: 978-1-60595-549-0
An Algorithm of Improved Optimum Index Factor Band Selection from
Hyperspectral Remote Sensing Image
Li-shuan HU
1,2, Qun WANG
1,*and Ting-yan XING
11
School of Information Engineering, China University of Geosciences (Beijing), Beijing 100083, China
2
College of Urban Rail Transit and Logistics, Beijing Union University, Beijing 100101, China
*Corresponding author
Keywords: Hyperspectral image classification, Band selection, Optimum index factor, Support vector machines.
Abstract. Hyperspectral remote sensing sensors can capture hundreds of narrow contiguous bands and provide plenty of valuable information. Due to the high-dimension characteristics of hyperspectral data, band selection plays an important role in the field of Hyperspectral Image (HSI) classification. In this paper, a HSI classification method based on Improved Optimum Index Factor (IOIF) band selection is proposed. First, we review the standard OIF and its shortcoming for processing huge bands. Then we introduce the proposed feature selection method based on IOIF. Experiments are conducted on the Indian Pines dataset. The evaluation results show that the proposed approach can select those bands with more discriminative information rapidly and improve the classification accuracy effectively.
Introduction
Hyperspectral Image (HSI) analysis has been an emerging research topic in recent years. Hyperspectral sensors divide the electromagnetic spectrum into hundreds of spectral bands, which can provide the potential and detailed land-cover distinction and identification [1]. The highly correlated spectral bands of hyperspectral images contain a large amount of redundancy, which brings extra time-consuming for hyperspectral data transmission, storage and processing. Additionally, these highly spectral bands may produce the "Hughes phenomenon" [2]. Therefore, dimensionality reduction is crucial for hyperspectral image classification. The commonly-used dimensionality reduction methods can be divided into two categories: feature selection [3] and feature extraction [4]. With feature extraction methods, the high-dimensional feature space is mapped to a low-dimensional space by linear or nonlinear transformations. As a result some crucial information may have been distorted [5]. Otherwise, feature selection methods select appropriate bands from the original set of spectral bands that can preserve the physical meaning of original spectral bands. Distance measure or mutual information measure is adopted as the criterion for selecting bands which show greater agreement with the ground truth [6]. In [7], Chavez et al. proposed the Optimum Index Factor (OIF) which can be calculated to obtain multivariate statistical information on a data set. In [8], Patel et al. employed features selected through OIF from both the individual years’ and stacked images to classify the satellite images. In this paper, a novel dimensionality reduction method based on improved OIF (IOIF) is presented. IOIF can select the most informative and the least correlative bands for classification rapidly. Experiments performed on the Indian Pines dataset demonstrate the effectiveness of the proposed method.
The remainder of this paper is organized as follows. In Section II, we review Optimum Index Factor (OIF)). In Section III, we formulate the framework of our proposed method. We present the experimental results in Section IV, and conclude our work in Section V.
Preliminaries: OIF
OIF was proposed by Richard Horowitz Chavez in 1982 [10]. The OIF is an unsupervised feature selection method which can select the most informative features. OIF considers that the larger standard deviation between bands of HSI, the more abundant amount of information, and the smaller the correlation coefficient between the bands, the smaller the redundancy of information between bands. The OIF to find out the most informative three-band combination is determined by the following formula:
3 1 3
1
( )
max( )
( ) i
j
i OIF
r i
(1)Where ( ) i is the standard deviation of i-th band, and r(j) is the value of correlation coefficient between any two bands. The method has some limitations. For example, the method simply selects the optimal combination of the band only from standard deviation and correlation coefficient. It’s possible to make combinations of the selected bands adjacent to each other, so it maybe not the optimal combination. In addition, when processing hundreds of bands, OIF needs a great amount of computation, especially for calculating the correlation coefficient between bands [11].
Proposed Method
In this section, we address the proposed method: an improved OIF (IOIF) method for HSI classification dimension reduction. This method involves three steps: subspace partition of whole data space, subspace feature selection and feature combination based on IOIF.
Subspace Partition
In statistics, the correlation coefficient indicates the departure of two random variables from independence. Equation (2) shows the calculation of the correlation coefficient between two variables x and y.
1
2 2
2 2
1 1
m
i i i
xy m m
i i
i i
x y mx y r
x mx y m y
11 12 1
21 22 2
1 2
n
n
n n nn
r r r
r r r
R
r r r
(3) Where n is the total number of HSI bands. Values distribution of the correlation coefficient matrix has obvious “block” characteristic. The "block" is used to divide all bands into several subspaces.
Band Selection for Subspace
Within each subspace, band selection are conducted. The selection criterion are two aspects: one is the most informative, and the other is the least correlation among the selected bands. Band index value descripted by equation (4) is adopted to find out the most appropriate bands to be selected.
1, , 1 ( ) / 2
i i
i i i i
Index r r (4) 1 2 2 1 1 [ ( ) ] m i l l x x m
(5)Where ri1,i is the correlation coefficient between (i-1)-th and i-th bands, and i is mean square deviation of i-th band. Top K band index values of each subspace are taken into account, and the corresponding specific band sets which have rich amount information and weak correlation are established.
Improved OIF Method
In our proposed approach, IOIF is adopted based on the specific band sets achieved from above stage. IOIF is given by equation (6).
3
1 1 1
max( )
K K K
i j k
N
i j k ij ik jk
IOIF C
r r r
(6)Where N is the subspace number, and
3
N
C
means any three subspaces selected from the whole N subspaces. K is the band number of each specific band set. The time complexity of standard OIF and
our proposed IOIF are
3 ( )
O n and O N(( K) )3 respectively. Usually n is far greater than NK
and therefore IOIF can improve the efficiency greatly. In addition, IOIF ensures that the combination bands come from different subspaces so as to avoid the choice of the case adjacent bands.
Experimental Results and Discussion
Data Set Description
Experimental Result and Discussion
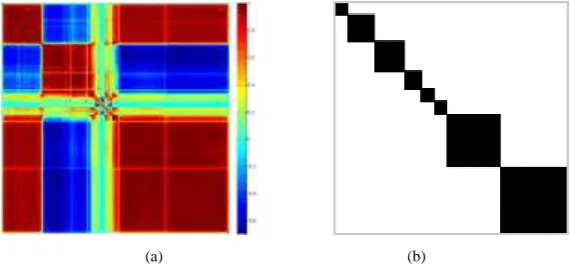
According to our proposed method, first, subspace partition is performed based on the correlation coefficient matrix of the India Pines dataset. Figure 1 (a) and (b) show the correlation coefficient matrix of this dataset and the subspace partition of the whole space respectively. We compare OIF with IOIF to verify our proposed method. Table 1 shows values calculated by OIF and IOIF. Table 2 shows the most valuable bands sequence of OIF and IOIF achieved from Table 1. By comparing the selected bands sequence, we find out that IOIF can avoid the choice of the case adjacent bands effectively. Figure 2(a), (b) and (c) show the whole bands, selected bands by OIF and selected bands by IOIF. From figure 2(b), we can see that the bands selected by OIF have strong dependency. From figure 2(d) and table 3, we can see IOIF save a lot of time and get higher accuracy than OIF.
[image:4.595.155.441.233.365.2]
(a) (b)
Figure 1. Subspace partition: (a) the color map of the correlation coefficient matrix, (b) the achieved 8 subspace.
(a) (b) (c) (d)
[image:4.595.85.525.418.517.2]Figure 2. Bands selection of the AVIRIS Indian Pine dataset: (a) the total bands, (b) 80 bands selected by OIF, (c) 80 bands selected by IOIF, and (d) The contrast of OIF and IOIF.
Table 1. Calculated values of OIF and IOIF.
Combination OIF Combination OIF Combination OIF Combination IOIF Combination IOIF Combination IOIF
1, 13, 90 490060 18, 91, 104 189250 12, 91, 197 144950 24, 76, 91 31248 33, 76, 91 21080 1, 91, 161 19952 1, 13, 91 229800 18, 91, 195 186840 18, 91, 200 138450 25, 76, 91 29337 1, 91, 162 20877 26, 76, 91 19950 18, 91, 197 228630 13,91, 104 175570 10, 91, 197 137520 31, 76, 91 23146 1, 31, 91 20795 1, 33, 91 19916 13, 91, 197 213280 11, 91, 104 161100 82, 91, 200 136190 11, 76, 91 22357 1, 24, 91 20686 1, 26, 89 19860 11, 91, 197 200810 11, 91, 195 159450 18, 91, 103 130020 1, 25, 91 21907 1, 91, 160 20642 1, 91, 114 19551
Table 2. The most valuable bands sequence for OIF and IOIF.
no 1 2 3 4 5 6 7 8 9 10 11 12 13 14 15 16 17 18 19 20 21 22 23 24 25 ...
OIF 1 13 90 91 18 197 11 104 195 12 200 10 82 103 187 183 35 73 101 14 182 178 189 9 179 ...
[image:4.595.64.530.583.695.2]Table 3. The number of selected bands and its classification accuracy.
bands number
method 10 20 30 40 50 60 70 80 time consuming (second)
OIF 66.23 76.71 77.52 79.19 80.39 79.96 82.17 83.01 4385.86
IOIF 72.79 80.03 81.55 82.69 82.84 83.12 83.41 84.18 2.25
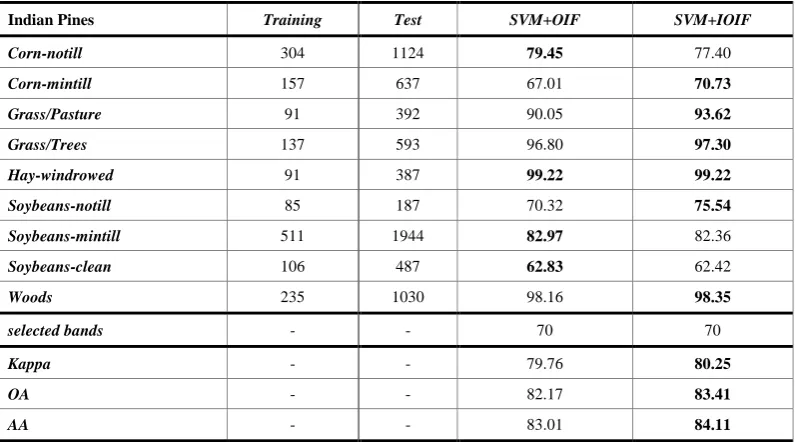
Three evaluation metrics, overall accuracy (OA), average accuracies (AA), and Kappa coefficient, are widely used to measure the statistical significance for hyperspectral image classification. From Figure 3 (c), (d) and table 4, we can easily see that, our proposed method, SVM+IOIF, obtains a higher accuracy compared with SVM+OIF. It is clear that SVM+IOIF can obtain the better performance.
[image:5.595.117.486.235.335.2]
(a) (b) (c) (d)
Figure 3. Classification maps of the AVIRIS Indian Pine dataset: (a) false color composite (bands 17, 27, and 50 for RGB), (b) ground truth, (c) classification map for the SVM+OIF method, and (d) classification map for the SVM+IOIF.
Table 4. Global and class-specific classification accuracies in percentage.
Indian Pines Training Test SVM+OIF SVM+IOIF
Corn-notill 304 1124 79.45 77.40
Corn-mintill 157 637 67.01 70.73
Grass/Pasture 91 392 90.05 93.62
Grass/Trees 137 593 96.80 97.30
Hay-windrowed 91 387 99.22 99.22
Soybeans-notill 85 187 70.32 75.54
Soybeans-mintill 511 1944 82.97 82.36
Soybeans-clean 106 487 62.83 62.42
Woods 235 1030 98.16 98.35
selected bands - - 70 70
Kappa - - 79.76 80.25
OA - - 82.17 83.41
AA - - 83.01 84.11
Conclusion
In this paper, a novel band selection method based on IOIF has been applied to hyperspectral remote sensing image classification. Our proposed method can select the bands effectively and save time noticeably. Experimental results show that the proposed method obtain higher efficiency and more accurate results than the standard OIF. The algorithm is a promising method on HSI classification.
Acknowledgement
[image:5.595.100.498.394.615.2]References
[1]C.I. Chang, Hyperspectral Data Exploitation: Theory and Applications, Hoboken, NJ, Wiley, USA, 2007.
[2]G.F. Hughes, On the mean accuracy of statistical pattern recognizers, IEEE Trans. Inf. Theory, vol. 14, no, 1, (1968) 55-63.
[3]Xue, B., Nguyen, S., Zhang, M.: A new binary particle swarm optimisation algorithm for feature selection. In: European Conference on the Applications of Evolutionary Computation. (2014) 501-513.
[4]A. Bal, Image feature extraction by dynamic neural filtering and phase-only joint transform correlation, Opt. Laser Technol. 39(1). 2007.
[5]M. Young, The Technical Writer's Handbook. Mill Valley, CA: University Science, 1989.
[6]J. Feng, L.C. Jiao, X. Zhang, T. Sun, Hyperspectral band selection based on trivariate mutual information and clonal selection, IEEE Trans. Geosci. Remote Sens. 52 (2014) 4092-4105.
[7]P.Chavez, G. Berlin, L. Sowers, Statistical Method for Selecting Landsat MSS Ratios, J. Appl. Photogr. Eng. 1 (1982) 23-30.
[8]N. Patel, B. Kaushal, Classification of features selected through Optimum Index Factor (OIF) for improving classification accuracy, Journal of Forestry Research 22 (2011) 99-105.
[9]V.N. Vapnik, Statistical Learning Theory, John Wiley & Sons, New York, 1998.
[10]P.Chavez, G. Berlin, L. Sowers, Statistical Method for Selecting Landsat MSS Ratios, J. Appl. Photogr. Eng. 1 (1982) 23-30.