R E S E A R C H A R T I C L E
Open Access
Knee osteoarthritis patients with more
subchondral cysts have altered tibial
subchondral bone mineral density
Wadena D. Burnett
1, Saija A. Kontulainen
1, Christine E. McLennan
2, Diane Hazel
2, Carl Talmo
2, David R. Wilson
3,
David J. Hunter
4and James D. Johnston
5*Abstract
Background:Subchondral bone cysts are a widely observed, but poorly understood, feature in patients with knee osteoarthritis (OA). Clinical quantitative computed tomography (QCT) has the potential to characterize cysts in vivo but it is unclear which specific cyst parameters (e.g., number, size) are associated with clinical signs of OA, such as disease severity or pain. The objective of this study was to use QCT-based image-processing techniques to characterize subchondral tibial cysts in patients with knee OA and to explore relationships between proximal tibial subchondral cyst parameters and subchondral bone density as well as clinical characteristics of OA (alignment, joint space narrowing (JSN), OA severity, pain) in patients with knee OA.
Methods:The preoperative knee of 42 knee arthroplasty patients was scanned using QCT. Patient characteristics were obtained, including OA severity, knee pain, JSN, and alignment. We used 3D image processing techniques to obtain cyst parameters including: cyst number, cyst number per proximal tibial volume, cyst volume per proximal tibial volume, as well as maximum and average cyst volume across the proximal tibia, as well as regional bone mineral density (BMD) excluding cysts. We used Spearman’s correlation coefficients to explore associations between patient characteristics and cyst parameters.
Results:At both the medial and lateral compartments of the proximal tibia, greater cyst number and volume were associated with higher BMD. At the lateral region, cyst number and volume were also associated with lateral OA severity, lateral JSN, alignment and sex. Pain was not associated with any cyst parameters at any region.
Conclusion:Cyst number and volume were associated with BMD at both the medial and lateral compartments. Lateral cyst number and volume were also associated with joint alignment, OA severity, JSN and sex. This is the first study to use clinical QCT to explore subchondral tibial cysts in patients with knee OA and provides further evidence of the relationships between subchondral cysts and clinical OA characteristics.
Keywords:Osteoarthritis, Tibia, Bone mineral density, Computed tomography
Background
Knee osteoarthritis (OA) is a painful and debilitating disease characterized by cartilage deterioration and altered subchondral bone. Recently, there has been increasing interest in the role of subchondral bone cysts in OA pro-gression; in particular how subchondral bone cysts may
influence pain [1–3], or how subchondral bone cysts influ-ence subchondral bone mechanical behaviour [4].
Subchondral cysts are typically spherical or ellipsoidal cavities within the subchondral bone region and are related to both altered subchondral bone and cartilage degeneration in patients with OA [5–7]. Recent studies have indicated associations between subchondral bone cysts and pain [8] as well as bone marrow lesions (BMLs) in patients with knee OA [6]; though, evidence of relation-ships between cysts and other patient characteristics (e.g., disease severity, joint space narrowing, alignment) is
* Correspondence:jd.johnston@usask.ca;james.johnston@usask.ca
5Department of Mechanical Engineering, University of Saskatchewan, 57
Campus Dr, Saskatoon, SK S7N 1G9, Canada
Full list of author information is available at the end of the article
limited. A clear understanding of disease pathogenesis is crucial for rational therapeutic targeting [9], particularly understanding of which structures contribute to pain [9]. As subchondral cysts are related to OA progression [10, 11], it is meaningful to investigate associations between subchondral cyst parameters (e.g., number and size) and OA severity and related pain.
Subchondral cysts are associated with higher localized stress [4], which could stimulate bone remodelling or bone alterations. Ex vivo studies at both the hip using high-resolution computed tomography (HR-QCT) [5], and the tibia using micro-computed tomography (micro-CT) [7] report changes in bone mineral density (BMD), especially in regions adjacent to cysts. These ex vivo stud-ies are able to evaluate cyst number and size, but are not able to correlate cyst properties with important clinical symptoms such as pain. Clinical techniques, such as mag-netic resonance imaging (MRI) and quantitative computed tomography (QCT) have the potential to offer three-di-mensional (3D) characterizations of cyst structure. Using MRI techniques, cysts can be distinguished from other bony features, such as BMLs [12,13], but it is difficult to reliably quantify BMD. Clinical QCT has potential to characterize cysts in vivo, to explore relationships with clinical OA symptoms (such as pain), to determine tibial BMD, and could potentially be used to evaluate 3D cyst development throughout disease progression to determine the role of cysts in OA. However, it is unclear which spe-cific cyst parameters (e.g., number, size) are associated with clinical symptoms, and which parameters are associ-ated with BMD.
The objective of this study was to use QCT and image-processing techniques to determine relationships between subchondral cyst parameters and subchondral BMD as well as clinical characteristics of OA (OA sever-ity, OA-related pain, alignment, joint space narrowing) in patients with knee OA.
Methods Study participants
Forty-two participants (17 M: 25F; mean age 64, SD ± 10.2 years; mean BMI 28.6 ± 3.7; 18 L:24R) with OA were recruited before total knee replacement. Study exclusion criteria included: pregnant women, patients having a revision replacement instead of primary knee replacement, and patients with a prior history of bone pathology at the knee joint. The Institutional Research Board of the New England Baptist Hospital approved the study. Informed written consent was obtained from all study participants. Patient selection, inclusion, and ex-clusion was intentionally very broad due to the explora-tory nature of this study, as well as limited availability of participants scheduled for knee replacement surgery at the participating hospital.
Participant ASSESMENT
The participating orthopaedic surgeon (CT) used standard-ized radiographs with Kellgren-Lawrence (KL) scoring [14] to classify OA severity. The participating surgeon also used standardized radiographs to classify compartment-specific joint space narrowing (JSN) and osteophyte presence. A single researcher (WDB) used compartment-specific JSN, osteophyte scores and measures of sclerosis from serial CT images to classify compartment-specific OA severity. We also included CT-measured knee alignment in our analysis. Knee alignment was categorized as varus, neutral, or valgus and measured using coronal and sagittal CT reconstruc-tions to determine an estimate of mechanical alignment [3]. In brief, medial and lateral joint space widths were evalu-ated at equal distances from the tibial spine permitting an estimation of alignment between the femoral and tibial axes. Neutral alignment was defined as 178° ± 2o (i.e., 176-180o) [3]. We defined an angle less than 176oas varus alignment and an angle greater than 180oas valgus align-ment. For this analysis, alignment was treated as a categor-ical variable, where participants exhibited either varus (−1), neutral (0), or valgus (1) alignment. Pain severity was mea-sured at the affected knee joint using the pain subsection of the Western Ontario McMasters Osteoarthritis Index (WOMAC) [15]. Participants were asked to assess the level of pain in the affected knee joint within the past 24-h while walking on a flat surface, going up or down stairs, lying down in bed at night, sitting or lying down, and standing upright using a 5-point Likert scale (0 to 4). Individual element pain scores were then summed for a possible total WOMAC pain score of 20, with scores ranging from 4 to 14. We also included pain lying down in bed at night (noc-turnal pain), scored from 0 (none) to 4 (extreme) as a pa-tient characteristic to correspond with our earlier work evaluating pain and subchondral BMD [2] We used the Self-Administered Comorbidity Questionnaire [16] to as-sess participants for any potential confounding comorbidi-ties (e.g., diabetes, heart disease).
QCT acquisition
We used a single energy clinical CT scanner (Lightspeed 4-slice, General Electric, Milwaukee, WI, USA) for bone imaging. A solid QCT spine reference phantom of known bone mineral densities (Model 3 T, Mindways Software Inc., Austin, TX, USA) was included in all CT scans. Par-ticipants were oriented supine within the CT gantry and both legs were simultaneously scanned. Scans included the distal femur, patella, proximal tibia, but only the prox-imal tibia was analyzed with this study.
(BONE) was used for CT image post-processing. Effect-ive radiation dose was ~ 0.073 mSv per scan, estimated using shareware software (CT-DOSE, National Board of Health, Herley, Denmark). For comparison, the average effective radiation dose during a transatlantic flight from Europe to North America is about 0.05 mSv [17].
Equivalent volumetric BMD (mg/cm3 K2HPO4) values were obtained by converting grayscale Hounsfield units (HU) to BMD using subject-specific linear regression equa-tions developed from known densities within the QCT phantom included in each axial image (r2> 0.99) [18].
CT image analysis Isolate subchondral region
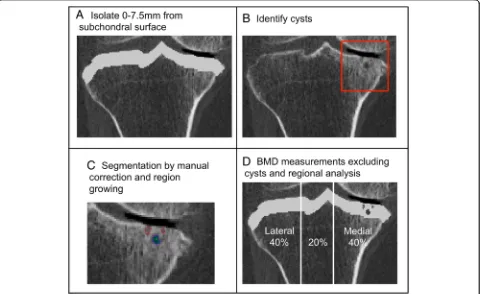
We used a custom algorithm (Matlab 2016a, Math-Works, Natick, MA, USA) to isolate the subchondral region of the proximal tibia, by measuring a depth of 7.5 mm from the subchondral surface (Fig.1a), using 3D imaged volumes of the proximal tibia from our previous work [19].
Cysts
Cysts were identified and manually segmented using com-mercial software (Analyze 10.0; Mayo Foundation, Roche
ster, MN, USA) and an interactive touch-screen tablet (Cintiq 21UX; Wacom, Krefeld, Germany). A single user (WDB), trained by senior researchers with guidance from an Atlas [20] and previous literature evaluating cysts using CT imaging [5], performed all segmentations. Cysts were considered as an elliptical or spherical volume of lower BMD (lower greyscale) surrounded entirely by an area of higher BMD (higher greyscale). Based upon Chiba et al. [5] and our previous studies evaluating cortical and trabecular subchondral bone [2] and the epiphyseal region tibia [19], we only considered cysts within the subchondral region at a depth of 7.5 mm from the subchondral surface (Fig. 1b). All identified cysts were segmented using semi-automatic region growing guided by subject-specific and cyst-specific threshold values defining the 50% mid-point intensity values between cyst interior and adjacent bone, similar to the half maximum height threshold (HMH) technique [21]. Smaller cysts were manually seg-mented (Fig.1c). Any cyst volumes smaller than 8 voxels (1.95 mm3) were not included in this analysis to mitigate any errors due to noise. For cases where cysts were par-tially inside and parpar-tially outside the 7.5 mm depth, we only included these cysts if more than 50% of their total volume was inside the 7.5 mm depth.
[image:3.595.59.539.389.683.2]We used a custom algorithm (Matlab 2016a) to measure the following cyst parameters across the subchondral region [5]: number of cysts, cyst number per total volume (number/cm3), cyst volume per total volume (%), total cyst volume (mm3), maximum cyst volume (mm3) and average cyst volume (mm3). To assess the repeatability of the cyst outcomes, a precision study was performed using recom-mended techniques (14 subjects scanned 3 times each = 42 image datasets) [22] whereby scans were randomized and cysts were re-identified and re-measured. Precision errors (root mean square coefficients of variation, C V%RMS) ranged from 0.7 to 3.6%.
BMD
We also determined relationships between cyst parame-ters and subchondral BMD, excluding cysts. Segmented cyst volumes were subtracted from the previously de-fined subchondral volume of the proximal tibia (Fig.1d), to determine mean BMD excluding cysts. To assess the repeatability of BMD outcomes, a precision study was performed using recommended techniques (14 subjects scanned 3 times each) [22]. Precision errors (root mean square coefficients of variation, CV%RMS) ranged from 0.9 to 2.4%.
Regional analysis
Proximal tibia imaged volumes were reoriented to a neu-tral position where medial and lateral plateaus were approximately parallel and divided into medial, central and lateral compartments, measured by using 40% of the maximum medial-lateral axis of each respective side (Fig. 1d). We evaluated mean BMD and cyst parameters over the total, medial, and lateral proximal tibial regions.
Statistical analysis
We report mean and standard deviation (SD) as well as median and range of cyst characteristics at total, med-ial, and lateral regions. As many of the measures exhib-ited wide and non-normal distributions, we used non -parametric Spearman’s rank correlations to determine associations between cyst parameters and participant characteristics (age, sex, BMI) and clinical characteris-tics of OA (medial and lateral JSN, alignment, OA severity, total WOMAC pain, nocturnal pain, BMD). We report associations between cyst characteristics and participant characteristics (age, sex, BMI) as these are known confounders for BMD [23, 24] and may be beneficial for future works evaluating proximal tibial subchondral cysts in patients with knee OA. Due to the exploratory nature of this study with multiple correlations, we report the level of significance for both p< 0.001 and p< 0.05.
Results
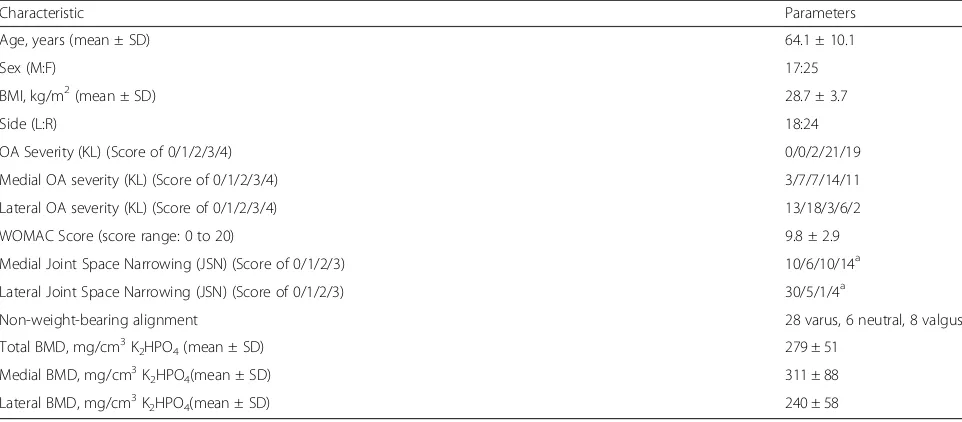
Patient characteristics are found in Table 1. Cysts were present in 88% of participants (37/42). For the entire sam-ple (n= 42), total cyst number varied from none (0) to up to 30 over the total proximal tibia and up to 29 in the medial compartment and 11 in the lateral compartment (Table2). The ratio of cyst volume to tibial volume ranged from 0 to 14.8% over the total proximal tibia, and up to 24.5% in the medial compartment and 5.3% in the lateral compartments. For many cyst volume parameters, the standard deviation was similar to or greater than mean volume, indicating a large distribution in cyst volume within this sample (Table2).
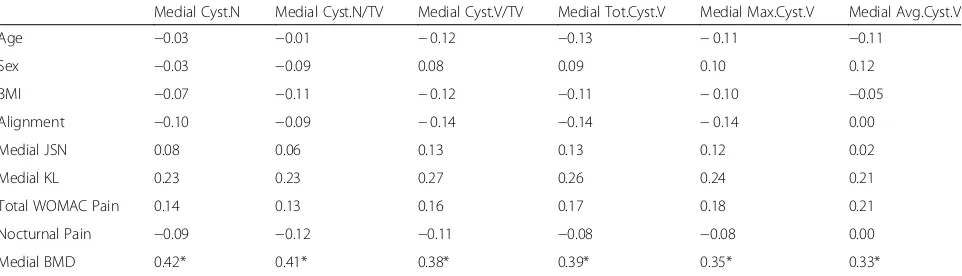
There were no significant associations between cyst parameters and age, total WOMAC pain, or nocturnal pain (Tables 3, 4 and 5). Over the total proximal tibia, we found significant positive relationships between (a) alignment and total cyst number and (b) alignment and cyst number per tibial volume (Table 3). At the medial region, higher medial BMD was associated with greater cyst number and volume (Table 4). At the lateral region (Table 5), greater cyst number and volume were also associated with higher BMD, as well as valgus alignment, lateral KL grade, lateral JSN, sex and BMI.
From the Self-Administered Comorbidity Questionnaire, four individuals had diabetes. Exclusion of these individuals did not affect or change associations. No additional comor-bidities were reported.
Discussion
In this exploratory study using 3D in vivo QCT for ana-lysis of proximal tibial subchondral cysts, we report cyst characteristics as well as associations between total, medial, and lateral cyst parameters and patient charac-teristics. At both the medial and lateral region, cyst number and volume was related to BMD. At the lateral region, cyst number and volume were also related to alignment, KL grade, JSN, sex and BMI. We found no relationships between cyst parameters and total WO MAC pain or nocturnal pain. This is the first in vivo study to use clinical QCT imaging at the knee to evalu-ate associations between cyst parameters and WOMAC pain, OA severity, and volumetric subchondral BMD. Exclusion of individuals with comorbidities did not affect study findings.
from bone remodelling, may counterbalance structural instability due to cyst presence and higher stress. Surpris-ingly, although medial and lateral BMD were associated with medial and lateral cyst parameters, total BMD was not associated with cyst parameters over the total proximal tibia. This appears to be due to opposing findings in corre-sponding medial:lateral compartments (e.g., a high medial cyst number would coincide with a high medial BMD, which would coincide with a low lateral cyst number and low lateral BMD). By combining these measures, overall density was reduced but the total cyst property changed very little. This had the effect of reducing associations be-tween total BMD and cyst properties measured over the total proximal tibia. These findings highlight the import-ance of assessing compartment-specific cyst properties.
Although the mechanism of cyst formation in patients with knee OA is still unknown, there are two primary hypotheses: the“bony contusion theory”[27,28]—which proposes that excessive loading or trauma can lead to trabecular microfractures, necrotic bone, and focal bone resorption, eventually resulting in cyst development— and the“synovial fluid intrusion theory” [29,30]—which
proposes that the calcified barrier between cartilage and subchondral bone is damaged, allowing for fluid to seep into the subchondral bone, creating a fluid-filled cyst lesion.
[image:5.595.57.538.99.310.2]In this work, there may be indications of each of these mechanisms in cyst formation, either independently or in combination. Over the total tibial region, the stron-gest associations were observed between cyst number and alignment, while at the lateral region similar associa-tions were observed between cyst parameters and align-ment as well as lateral JSN and lateral OA severity. These results suggest that cartilage degeneration may be associated with proportionally larger and more numer-ous cysts. Chen et al. [7] report similar findings, where subchondral cyst presence was associated with JSN and cartilage degeneration. Most likely, cyst development is a response to altered loading resulting in potential changes to bone congruence, contact forces, potentially changing load distribution through the proximal tibia [31, 32], possibly through JSN with disease progression or knee alignment. Although alignment was measured based on imaged reconstructions [3], it may be worthwhile Table 1Descriptive statistics for characteristics of study participants
Characteristic Parameters
Age, years (mean ± SD) 64.1 ± 10.1
Sex (M:F) 17:25
BMI, kg/m2(mean ± SD) 28.7 ± 3.7
Side (L:R) 18:24
OA Severity (KL) (Score of 0/1/2/3/4) 0/0/2/21/19
Medial OA severity (KL) (Score of 0/1/2/3/4) 3/7/7/14/11
Lateral OA severity (KL) (Score of 0/1/2/3/4) 13/18/3/6/2
WOMAC Score (score range: 0 to 20) 9.8 ± 2.9
Medial Joint Space Narrowing (JSN) (Score of 0/1/2/3) 10/6/10/14a Lateral Joint Space Narrowing (JSN) (Score of 0/1/2/3) 30/5/1/4a
Non-weight-bearing alignment 28 varus, 6 neutral, 8 valgus
Total BMD, mg/cm3K2HPO4(mean ± SD) 279 ± 51
Medial BMD, mg/cm3K2HPO4(mean ± SD) 311 ± 88
Lateral BMD, mg/cm3K2HPO4(mean ± SD) 240 ± 58
a
Data missing for 2 participants
Table 2Cyst parameters for study sample (n= 42), mean ± SD (median, range). Cysts were present in 88% of participants (37/42). Of the 37 participants with subchondral cysts, 33 had cysts medially and 18 had cysts laterally. For these reasons, in some cases the median value is 0. Cyst parameters specific to the 37 participants with subchondral cysts can be found in Additional file3: Table S3
Total Medial Lateral
Cyst Number (Cyst.N) (#) 7.0 ± 6.7 (5.5, 0–30) 3.9 ± 5.7 (2.0, 0–29) 1.9 ± 3.0 (0.0, 0–11)
Cyst #/vol (Cyst.N/TV) (#/cm3) 0.3 ± 0.3 (0.3, 0–1.3) 0.4 ± 0.6 (0.2, 0–2.6) 0.2 ± 0.3 (0.0, 0–1.3) Cyst vol/vol (Cyst.V/TV) (%) 1.3 ± 2.7 (0.0, 0–14.8) 1.9 ± 2.5 (0.0, 0–24.5) 0.2 ± 0.5 (0.0, 0–5.3)
[image:5.595.57.539.635.731.2]hypothesizing why total cyst number and lateral cyst pa-rameters were associated with valgus alignment. As the lateral compartment is predisposed to higher tibial loads in patients with valgus alignment [33,34], patients with valgus alignment may be predisposed to higher cyst numbers and volume, even before clinical signs of OA, such as pain. However, based on this finding, it would be expected that varus alignment would be associated with medial cyst num-ber and volume, but this relationship was not significant in our study. We recommend further studies using weight-bearing hip-to-toe radiographs to determine knee alignment to evaluate the effect of alignment on cyst char-acteristics and development in participants with OA.
In this study, sex and BMI were associated with cyst number and volume in the lateral compartment. To further investigate these findings related to sex, we performed comparisons to determine differences in cyst characteristics and participant characteristics between males and females (Additional file 1: Table S1 & Additional file 2: Table S2). Our results indicate that females had more and larger cysts in the lateral
compartment than males (Additional file 1: Table S1). Surprisingly, of the 18 participants with lateral cysts, 17 were female and 1 was male. As lateral cyst pa-rameters were dominated by females, an association with sex at the lateral compartment would be expected. This finding is possibly due to loading effects as females also exhibited more valgus loading (Additional file2: Table S2), which is in line with previous research by Hvid et al. [35] and Sharma et al. [36]. Accordingly, sex and align-ment may be factors to consider in future, larger scale studies evaluating proximal tibial subchondral cysts in pa-tients with knee OA. With regards to associations between lower BMI and lateral cyst parameters, this also appears to be sex-related. Specifically, because the lateral cyst param-eters were dominated by females, who had lower BMI than males (Additional file2: Table S2), a negative associ-ation with BMI would be expected.
[image:6.595.57.540.122.248.2]Interestingly, there were no associations between cyst parameters and OA severity at either the total proximal tibia or the medial compartment, but lateral OA severity was associated with all lateral cyst Table 3Correlation coefficients between cyst parameters and patient and clinical OA characteristics over the total proximal tibia. Spearman’s correlation coefficient was used for all variables. For alignment, negative relationships represent associations with varus alignment while positive relationships represent associations with valgus alignment. Significant associations are marked
Cyst.N Cyst.N/TV Cyst.V/TV Tot.Cyst.V Max.Cyst.V Avg.Cyst.V
Age 0.17 0.17 0.11 0.08 0.07 0.01
Sex 0.25 0.37 0.18 0.11 0.04 −0.03
BMI −0.20 −0.22 −0.08 −0.06 −0.02 0.05
Alignment 0.33* 0.38* 0.19 0.16 0.09 0.02
KL 0.30 −0.07 −0.08 0.37 0.32 0.31
Total WOMAC Pain 0.25 0.29 0.16 0.15 0.07 0.05
Nocturnal Pain 0.26 0.25 0.07 0.09 −0.01 −0.09
Total BMD 0.07 0.03 0.02 0.04 0.03 0.04
*p< 0.05 **p< 0.01
Table 4Correlation coefficients between cyst parameters and patient and clinical OA characteristics at the medial region. Spearman’s correlation coefficient was used for all variables. For alignment, negative relationships represent associations with varus alignment while positive relationships represent associations with valgus alignment. Significant associations are marked
Medial Cyst.N Medial Cyst.N/TV Medial Cyst.V/TV Medial Tot.Cyst.V Medial Max.Cyst.V Medial Avg.Cyst.V
Age −0.03 −0.01 −0.12 −0.13 −0.11 −0.11
Sex −0.03 −0.09 0.08 0.09 0.10 0.12
BMI −0.07 −0.11 −0.12 −0.11 −0.10 −0.05
Alignment −0.10 −0.09 −0.14 −0.14 −0.14 0.00
Medial JSN 0.08 0.06 0.13 0.13 0.12 0.02
Medial KL 0.23 0.23 0.27 0.26 0.24 0.21
Total WOMAC Pain 0.14 0.13 0.16 0.17 0.18 0.21
Nocturnal Pain −0.09 −0.12 −0.11 −0.08 −0.08 0.00
Medial BMD 0.42* 0.41* 0.38* 0.39* 0.35* 0.33*
[image:6.595.58.539.576.714.2]parameters (ρ ranged from 0.51 to 0.54, p< 0.01). As medial OA is more commonly reported [36–38], this work may highlight a select sub-group of patients (mostly female, mostly with valgus alignment, most with lateral cyst presence) with a tendency for more severe OA at the commonly overlooked lateral com-partment. As this is a small sample of participants with severe OA, we recommend further analysis in a larger sample of patients at various stages of OA to further evaluate if this observed phenomenon is a characteristic of this sample, or generalizable to a lar-ger sample of individuals with OA.
Although our previous work evaluating relationships between BMD and pain in this sample reported an association with high lateral focal BMD and pain [2], we found no relationships between cyst parameters and WOMAC pain. This was surprising as necrotic bone, which is found around cysts [10], is thought to contrib-ute to pain [39]. Intra-osseous stress concentrations associated with cysts (which could approach or exceed bone’s yield strength) are also thought to lead to pain [4]. In patients with late-stage OA, cyst presence may not be related to pain in later stages of cyst development. In these cases, bone remodelling levels may be reduced or equilibrated such that the cyst structure is well formed and resistant to the effects of high stress (higher BMD found around the cysts supports this premise). We recommend further work with patients with varying stages of OA and degrees of pain to evaluate associations between cysts, BMD and pain during disease progression.
The findings of this study present various potential clinical impacts. Using clinical QCT we were able to measure relationships between cyst parameters (number, size, volume) and participant characteristics in vivo as had previously only been done ex vivo using non-clinical im-aging tools such as micro-CT [7] and HR-QCT [5]. This
presents a promising clinical QCT-based technique for monitoring similar cyst parameters and regional BMD in a clinical sample and the ability to incorporate clinical symptoms such as pain. Clinical studies using MRI-based techniques present that cyst presence may [8, 40] or may not [12,41,42] be related to pain in patients with OA. Al-though these studies show that it is possible to distinguish cysts and cyst-like lesions using MR, resolution limitations inhibit the ability to distinguish and measure smaller subchondral cysts. QCT provides higher resolution, as well as the ability to easily quantify cyst-adjacent BMD. This work further demonstrates the complexities of cyst presence in relation to pain in patients with OA, especially in late-stage OA, but may provide a comprehensive technique able to distinguish cysts, as well as regional or localized BMD in vivo.
[image:7.595.58.539.122.261.2]This study has certain limitations to consider. First, our measurements use a larger voxel size than ex vivo approaches such as micro-CT and may ignore smaller cysts. It was difficult to reliably quantify any cysts smaller than 8 voxels (2x2x2 voxels or 1.95mm3). It was also challenging to differentiate between small cysts and surrounding bone. Second, it was challenging to deter-mine individual cysts with adjacent large cysts that would sometimes connect with one another in some participants. In these cases, these were counted as a sin-gle large cyst, but could also be regarded as multiple smaller cysts, which could have merged into a large cyst-like void. This could account for multiple large cysts within our study. Third, our alignment measure-ment was a custom in-house approach using CT recon-structions and relative joint space widths to approximate mechanical alignment. Although this technique has not been validated against full-limb radiographs, in these pa-tients with late OA malalignment was evident with values ranging from−18° to 8° from neutral position [3]. Fourth, as this was an in vivo study, we did not include Table 5Correlation coefficients between cyst parameters and patient and clinical OA characteristics at the lateral region.
Spearman’s correlation coefficient was used for all variables. For alignment, negative relationships represent associations with varus alignment while positive relationships represent associations with valgus alignment. Significant associations are marked
Lateral Cyst.N Lateral Cyst.N/TV Lateral Cyst.V/TV Lateral Tot.Cyst.V Lateral Max.Cyst.V Lateral Avg.Cyst.V
Age 0.24 0.24 0.24 0.24 0.24 0.22
Sex 0.62** 0.62** 0.62** 0.62** 0.62** 0.64**
BMI −0.35* −0.35* −0.35* −0.36* −0.36* −0.34*
Alignment 0.60** 0.60** 0.61** 0.61** 0.62** 0.62**
Lateral JSN 0.66** 0.66** 0.68** 0.67** 0.68** 0.68**
Lateral KL 0.54** 0.54** 0.54** 0.54** 0.53** 0.51**
Total WOMAC Pain 0.15 0.16 0.14 0.13 0.11 0.14
Nocturnal Pain 0.24 0.25 0.23 0.23 0.22 0.20
Lateral BMD 0.48** 0.47** 0.46** 0.46** 0.45** 0.43**
biochemical or histological analysis, and are thus uncer-tain of cyst genesis or development. Fifth, our sample has various limitations including participants at late stage of OA severity and pain measurement, as well as wide and non-normal variable distribution. Our sample represented patients at late stages of OA and findings may not be applicable to patients with early OA. Also, as this sample did not include healthy control subjects, it is difficult to determine if observed associations are spe-cific to individuals with OA, or pertain to the healthy population as well. WOMAC pain severity and assess-ment was based on the entire knee joint, including all joint surfaces (tibiofemoral and patellofemoral) and tis-sues (e.g., bone, menisci, synovium), and it is uncertain if pain originated within the proximal tibial bony struc-ture, other tissues, or a combination of tissues. It is un-certain if wide and non-normal distribution of cyst characteristics may be an element specific to this small sample of participants with severe OA and high amounts of pain, or if this is common over a larger sample with more varied pain or disease progression. Given that cyst parameters of the proximal femur reported by Chiba et al. also exhibited non-normal distributions [5], we be-lieve non-normal distributions are common. However, further prospective evidence from participants at varying initial stages of OA and OA-related pain is needed to complement these preliminary findings. Such research will help to clarify the relationship between cyst parame-ters and patient characteristics, as well as the role of subchondral cysts in knee OA and OA-related pain.
Conclusions
In this exploratory study, we used clinical QCT to analyze subchondral cysts at the proximal tibia of OA patients to determine relationships between subchondral cyst parameters and clinical characteristics of OA. There was a large range in cyst number and volume in our sample, suggesting that cyst development and progres-sion may vary from patient to patient. Greater cyst num-ber and volume were associated with higher BMD at both the medial and lateral compartments of the prox-imal tibia. At the lateral region, cyst number and volume were also strongly associated with several patient charac-teristics including joint alignment, sex, lateral OA sever-ity and lateral JSN, suggesting that there may be disease-associated changes in tibial loading distribution leading to cyst development and further joint deterior-ation. We found no associations between cyst number or cyst volume with OA-related knee pain in patients with late-stage OA. As such, it may be further worth-while to explore other bone-related outcomes (e.g., BMLs, BMD), when investigating which structures are associated with pain.
Additional files
Additional file 1:Table S1Mann-Whitney U tests determining differ-ences in cyst characteristics between male and female participants. We report medians and ranges. Significant differences (p< 0.05) are bolded. With regards to why no results are provided for Males at the lateral com-partment, this is because only 1 male had lateral cysts. (DOCX 17 kb)
Additional file 2:Table S2Differences in patient characteristics between males and females. Independent samples t-tests were used for continuous variables and Chi-squared tests were used for categorical vari-ables (noted in italics). Significant differences are bolded. (DOCX 18 kb)
Additional file 3:Table S3Cyst parameters from participants only with cysts specific to each compartment, mean ± SD (median, range). (DOCX 19 kb)
Abbreviations
BMD:Bone mineral density; BML: Bone marrow lesion; BV/TV: Bone volume per total volume; CT: Computed tomography; CV%: Coefficients of variation; FE: Finite element; HMH: Half-maximum height; HR-QCT: High-resolution quantitative computed tomography; HU: Hounsfield units; JSN: Joint space narrowing; KL: Kelgren-Lawrence score; MRI: Magnetic resonance imaging; OA: Osteoarthritis; QCT: Quantitative computed tomography;
WOMAC: Western Ontario and McMaster Universities Arthritis Index
Funding
This project was funded through support from the Natural Sciences and Engineering Research Council of Canada (NSERC grant 2015–06420) Canadian Arthritis Network (CAN Pilot Grant) and New England Baptist Hospital Research Funding Awards.
Availability of data and materials
The datasets used and analysed during the current study available from the corresponding author on reasonable request.
Authors’contributions
WDB assisted in conceiving the study, carried out the image processing, contributed to statistical analysis and interpretation of data, and composed the draft manuscript. SAK contributed to statistical analysis and interpretation of data. CEM contributed to study design and acquisition of patient data. DH contributed coordination of the study and acquisition of patient data. CT contributed to study design, participant recruitment and acquisition of patient data. DRW contributed to study design. DJH contributed to study design and coordination of the study. JDJ conceived the study, assisted in image processing, and interpretation of data. All authors revised and/or critically evaluated the draft manuscript. All authors read and approved the final manuscript.
Ethics approval and consent to participate
This study was approved by the Institutional Research Board of the New England Baptist Hospital. Informed written consent was obtained from all study participants.
Consent for publication
Not applicable
Competing interests
JDJ is a member of the Editorial Board of BMC Musculoskeletal Disorders. The other authors have nothing to declare. The corresponding author had full access to all the data in the study and had final responsibility for the decision to submit for publication.
Publisher’s Note
Springer Nature remains neutral with regard to jurisdictional claims in published maps and institutional affiliations.
Author details
1University of Saskatchewan, Saskatoon, SK, Canada.2New England Baptist
Hospital, Boston, MA, USA.3University of British Columbia, Vancouver, BC,
Mechanical Engineering, University of Saskatchewan, 57 Campus Dr, Saskatoon, SK S7N 1G9, Canada.
Received: 17 November 2017 Accepted: 19 December 2018
References
1. Javaid MK, Kiran A, Guermazi A, Kwoh CK, Zaim S, Carbone L, et al. Individual magentic resonance imaging and radiographic features of knee osteoarthritis in subjects with unilateral knee pain. Arthritis Rheum. 2012; 64(10):3246–55.
2. Burnett WD, Kontulainen SA, McLennan CE, Hazel D, Talmo C, Hunter DJ, et al. Knee osteoarthritis patients with severe nocturnal pain have altered proximal tibial subchondral bone mineral density. Osteoarthr Cartil. 2015; 23(9):1483–90.
3. Burnett W, Kontulainen S, McLennan C, Hazel D, Talmo C, Hunter D, et al. Response to letter to the editor: 'Is subchondral bone mineral density associated with nocturnal pain in knee osteoarthritis patients?'. Osteoarthr Cartil. 2015;23(12):2299–301.
4. McErlain DD, Milner JS, Ivanov TG, Jencikova-Celerin L, Pollmann SI, Holdsworth DW. Subchondral cysts create increased intra-osseous stress in early knee OA: a finite element analysis using simulated lesions. Bone. 2011; 48(3):639–46.
5. Chiba K, Burghardt AJ, Osaki M, Majumdar S. Three-dimensional analysis of subchondral cysts in hip osteoarthritis: an ex vivo HR-pQCT study. Bone. 2014;66:140–5.
6. Crema MD, Roemer FW, Marra MD, Niu J, Lynch JA, Felson DT, et al. Contrast-enhanced MRI of subchondral cysts in patients with or at risk for knee osteoarthritis: the MOST study. Eur J Radiol. 2010;75:e92–e6. 7. Chen Y, Wang T, Guan M, Zhao W, Leung F-K-L, Pan H, et al. Bone turnover
and articular cartilage differences localized to subchondral cysts in knees with advanced osteoarthritis. Osteoarthr Cartil. 2015;23:2174–83. 8. Javaid MK, Kiran A, Guermazi A, Kwoh CK, Zaim S, Carbone L, et al.
Individual magnetic resonance imaging and radiographic features of knee osteoarthritis in subjects with unilateral knee pain: the health, aging, and body composition study. Arthritis Rheum. 2012;64(10):3246–55. 9. Neogi T. Clinical significance of bone changes in osteoarthritis. Ther Adv
Musculoskelet Dis. 2012;4(4):259–67.
10. McErlain DD, Ulici V, Darling M, Gati JS, Pitelka V, Beier F, et al. An in vivo investigation of the initiation and progression of subchondral cysts in a rodent model of secondary osteoarthritis. Arthritis Res Ther. 2012;14(1):R26. 11. Tanamas SK, Wluka AE, Pelletier JP, Martel-Pelletier J, Abram F, Wang Y, et al.
The association between subchondral bone cysts and tibial cartilage volume and risk of joint replacement in people with knee osteoarthritis: a longitudinal study. Arthritis Res Ther. 2010;12(2):R58.
12. Kornaat PR, Bloem JL, Ceulemans RY, Riyazi N, Rosendaal FR, Nelissen RG, et al. Osteoarthritis of the knee: association between clinical features and MR imaging findings. Radiology. 2006;239(3):811–7.
13. Roemer FW, Eckstein F, Guermazi A. Magnetic resonance imaging-based Semiquantitative and quantitative assessment in osteoarthritis. Rheum Dis Clin N Am. 2009;35(3):521–55.
14. Kellgren JH, Lawrence JS. Radiological assessment of osteo-arthrosis. Ann Rheum Dis. 1957;16:494–502.
15. Bellamy N, Buchanan WW, Goldsmith CH, Campbell J, Stitt LW. Validation study of WOMAC: a health status instrument for measuring clinically important patient relevant outcomes to antirheumatic drug therapy in patients with osteoarthritis of the hip or knee. J Rheumatol. 1988;15(12): 1833–40.
16. Sangha O, Stucki G, Liang MH, Fossel AH, Katz JN. The self-Admininstered comorbidity questionnaire: a new method to assess comorbidity for clinical and health services research. Arthritis Rheum. 2003;49(2):156–63. 17. UNSCEAR 2000 report to the general assembly - volume 1. United Nations
Scientific Committee on the Effects of Atomic Radiation; 2000. 18. Johnston JD, Masri BA, Wilson DR. Computed tomography topographic
mapping of subchondral density (CT-TOMASD) in osteoarthritic and normal knees: methodological development and preliminary findings. Osteoarthr Cartil. 2009;17(10):1319–26.
19. Burnett W, Kontulainen S, McLennan C, Hazel D, Talmo C, Wilson D, et al. Proximal tibial trabecular bone mineral density is related to pain in patients with osteoarthritis. Arthritis Res Ther. 2017;19(1):200.
20. Altman RD, Hochberg M, Murphy WA Jr, Wolfe F, Lequesne M. Atlas of individual radiographic features in osteoarthritis. Osteoarthritis Cartilage. 1995;(3, Suppl A):3–70.
21. Spoor CF, Zonneveld FW, Macho GA. Linear measurements of cortical bone and dental enamel by computed tomography: applications and problems. Am J Phys Anthropol. 1993;91:469–84.
22. Glüer CC, Blake G, Lu Y, Blunt BA, Jergas M, Genant HK. Accurate assessment of precision errors: how to measure the reproducibility of bone
densitometry techniques. Osteoporos Int. 1995;5(4):262–70. 23. Akamatsu Y, Mitsugi N, Taki N, Ashi HK, Saito T. Medial versus lateral
condoyle bone mineral density ratios in a cross-sectional study: a potential marker for medial knee osteoarthritis severity. Arthritis Care Res. 2012;64(7): 1036–45.
24. Dore D, Ding C, Jones G. A pilot study of the reproducibility and validity of measuring knee subchondral bone density in the tibia. Osteoarthr Cartil. 2008;16(12):1539–44.
25. Pilkey WD, Pilkey DF, Peterson RE. Peterson's stress concentration factors. 3rd ed. Hoboken, N.J. Wiley; 2008.
26. Frazer LL, Santschi EM, Fischer KJ. The impact of subchondral bone cysts on local bone stresses in th emedial femoral condyle of the equine stifle joint. Med Eng Phys. 2017;48:158–67.
27. Durr HD, Martin H, Pellengahr C, Schlemmer M, Maier M, Jansson V. The cause of subchondral bone cysts in osteoarthrosis: a finite element analysis. Acta Orthop Scand. 2004;75(5):554–8.
28. Ondrouch AS. Cyst formation in osteoarthritis. J Bone Joint Surg Br. 1963;45: 755–60.
29. Resnick D, Niwayama G, Coutts R. Subchondral cysts (geodes) in arthritic disorders: pathologic and radiographic appearance of the hip joint. Am J Roentgenol Radium Ther. 1977;128(5):345–50.
30. Freund E. The pathological significance of intra-articular pressure. Edinb Med J. 1940;47:192.
31. Hertz VHH. Uber die Berührung fester elastischer Körper. J für die reine und angewandte Mathematik. 1882;(92):156–71.
32. Machado M, Flores P, Ambrosio J, Completo A. Influence of the contact model on the dynamic response of the human knee joint. Proc Inst Mech Engineers Part K: J Multi-body Dynamics. 2011;225:344–58.
33. Werner FW, Ayers DC, Maletsky LP, Rullkoetter PJ. The effect of valgus/varus malalignment on load distribution in total knee replacements. J Biomech. 2005;38:349–55.
34. Hsu H-P, Garg A, Walker PS, Spector M, Ewald FC. Effect of knee compartment alignment on tibial load distribution with clinical correlation. Clin Orthop Relat Res. 1989;248:135–44.
35. Hvid I, Andersen LI. The quardiceps angle and its relation to femoral torsion. Acta Orthop Scand. 1982;53(4):577–9.
36. Sharma L, Song J, Dunlop D, Felson D, Lewis CE, Segal N, et al. Varus and valgus alignment and incident and progressive knee osteoarthritis. Ann Rheum Dis. 2010;69:1940–5.
37. Windsor RE, Insall JN. Surgery of the knee. In: Sledge CB, Ruddy S, Harris ED, Kelley WN, editors. Arthritis surgery. Philadelphia: WB Saunders Company; 1994. p. 794–817.
38. Dieppe PA, Lim K. Osteoarthritis: clinical features and diagnostic problems. In: Klippel JH, Dieppe PA, editors. Rheumatology. London (UK): Mosby; 1998. p. 3.1–3.16.
39. Fondi C, Franchi A. Definition of bone necrosis by the pathologist. Clin Cases Miner Bone Metab. 2007;4(1):21–6.
40. Hayes CW, Jamadar DA, Welch GW, Jannausch ML, Lachance LL, Capul DC, et al. Osteoarthritis of the knee: comparison of MR imaging findings with radiographic severity measurements and pain in middle-aged women. Radiology. 2005;237(3):998–1007.
41. Torres L, Dunlop D, Peterfy C, Guermazi A, Prasad P, Hayes K, et al. The relationship between specific tissue lesions and pain severity in persons with knee osteoarthritis1. Osteoarthr Cartil. 2006;14(10):1033–40. 42. Sowers M, Karvonen-Gutierrez CA, Jacobson JA, Jiang Y, Yosef M.