Headed Anchor/Engineered Cementitious Composites (ECC) Pullout Behavior
13
0
0
Full text
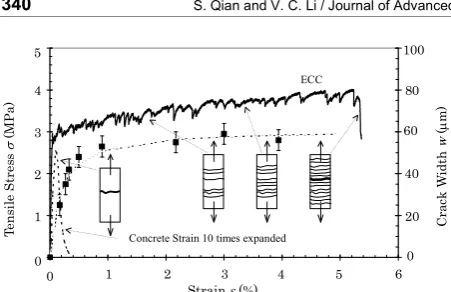
(2) 340. S. Qian and V. C. Li / Journal of Advanced Concrete Technology Vol. 9, No. 3, 339-351, 2011 100. 5 ECC. 80. 3. 60. 2. 40 20. 1. Crack Width w (μm). Tensile Stress σ (MPa). 4. Concrete Strain 10 times expanded. 0. 0 0. 1. 2. 3 Strain ε (%). 4. 5. 6. Fig. 2 Typical tensile stress-strain curve of ECC.. ECC is a class of high performance fiber reinforced cementitious composites, developed by Li and coworkers (Li 1993; Li and Kanda 1998; Kanda and Li 1999). The material reveals a metal-like strain hardening behavior under uniaxial tensile loading, normally with a tensile strain capacity of over 3 %, which is about 300 times compared with normal concrete (Fig. 2). The material is designed based on micromechanics theory, allowing maximized tensile ductility at moderate Polyvinyl Alcohol (PVA) fiber content. Due to its high tensile ductility and damage tolerance, it has been adopted in a number of infrastructural applications (Li 2003; Kunieda and Rokugo 2006). Results from previous experimental studies (Qian and Li 2006, 2009) of steel stud and anchor connections in ECC had shown great promise of using ECC in high stress concentration areas, resulting in much improved structural performance in terms of enhanced load capacity and structural ductility. Under high stress concentration, ECC typically responded in a ductile mode via microcracking process, spreading the concentrated load over a much larger surrounding region. Even in the presence of a cut notch, ECC showed extensive damage tolerance by redistributing the high stress concentration at the notch tip into a diffuse zone of microcracking (Li and Hashida 1993). High tensile ductility was found to be the dominant material property in suppressing brittle fracture behavior such as that often seen in steel anchor pullout experiments (Elfgren 1998). While the experimental findings of Qian and Li (2006, 2009) established the importance and feasibility of embedding tensile ductility in concrete material, no systematic studies have yet been performed on the details of the damage process evolution during anchor pull-out. In addition, the influence of other material properties, such as compressive strength, modulus of elasticity, and strain-hardening modulus, on anchor pull-out behavior has not been examined. Considering the high cost and long time associated with the experimental work, it is more efficient to conduct parametric studies for these material properties and/or different geometry and loading configurations, via advanced numerical simulation tools, such as FEM techniques. These tools allow the detail investigation of the complete internal damage. evolution process not easily obtainable from experiments. In the past decade a number of numerical analysis approaches have been proposed for the behavior of ECCs. Kabele (2001, 2005, 2007) has pioneered a multi-scale model linking the microscale single fiber behavior up to the macroscale structural behavior. This model has shown good applicability in modeling various structural elements. The elegancy of this model lies in its capability of simulating/predicting the ECC structural behavior based on the micromechanical parameters, which allows the tailoring of the material for improved structural performance. To accurately predict the structural performance of ECC structural components under cyclic and seismic loading, Han et al (2003) developed a constitutive model based on total strain. The model can successfully capture the unique reversed cyclic loading behavior of ECC-like material. Furthermore, Suryanto et al (2010) proposed a smeared-crack model of R/ECC membranes incorporating an explicit shear transfer model. The verification demonstrates that the model is capable of replicating various responses of the shear panels well, provided that tensile property of the ECC is calibrated against those obtained from the panel tests. While the above models have advantages in handling multi-scale problems and complicated loading conditions, the focus of this research is on the influence of material tensile ductility on the monotonic anchor pullout behavior, therefore an easier option is to adopt commercial FEM programs with embedded material strain hardening model. One of the commercially available FEM codes that includes constitutive model capable of simulating strain hardening material is FEMMASSE (2006), developed initially by Delft University of Technology. Even though this program was originally intended for simulating early age behavior of concrete materials (thermal-mechanical coupled problem), it can be adapted to the simulation of high stress concentration problems, incorporating strain-hardening behavior of ECC. The current version of FEMMASSE has the capability to handle two dimensional (2D) problems. In this paper, the FEMMASSE software code was utilized for simulating the 2D anchor pullout problem in order to gain insights into the influence of material properties on the stress concentration problem. Firstly, highlights of 2D and 3D anchor pullout experimental results pertinent to the numerical simulation study was summarized. Details of these experimental studies can be found in Qian and Li (2009). Secondly, the FEM model was then validated with the 2D anchor pullout experimental results in terms of damage process and structural response. Thirdly, the validated anchor pullout model was employed for parametric studies of several material properties including tensile strength and strain capacity. The insights gained from the parametric studies were used for proposing a design equation of anchor pullout load capacity, which was verified by the 3D anchor pullout test data..
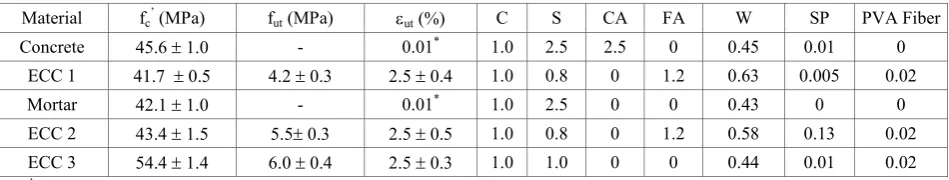
(3) 341. S. Qian and V. C. Li / Journal of Advanced Concrete Technology Vol. 9, No. 3, 339-351, 2011. 2. Experimental study of anchor pullout 2.1 Two dimensional (2D) test Two materials were investigated in the 2D test, including Concrete and ECC 1 (shown in Table 1). These materials were designed to have similar compressive strength, in order to highlight the influence of tensile ductility on anchor pullout behavior. The specimen geometry (Fig. 3) was adopted from the RILEM recommendation for anchor pull-out studies (Elfgren 1998). A steel anchor was embedded in a concrete slab with width and height set to be sufficiently large to ensure a consistent pullout failure mode. Three specimens were cast for each material. Before testing concrete specimens were cured for 28 days in a sealed condition (25 o C, RH 98%) while ECC specimens were cured in air (25 oC, RH 40%) for favorable development of tensile ductility. Testing was conducted on an MTS 810 machine. LVDTs were mounted on the front and back sides of the. specimen (Fig. 3) to measure the pullout displacement of the steel anchor from the concrete/ECC slab. Considering the very different pullout displacement capacities for ECC and concrete, the tensile load was applied at 0.3 and 0.03 mm/min for ECC and concrete, respectively, so that the loading times to failure were comparable. The overall performance of ECC pullout specimens was enhanced greatly compared with that of the concrete ones. Figure 4 revealed that the anchor pullout failed by a more gentle ductile damage (multiple cracking) process in ECC specimens as opposed to a sudden brittle fracture in concrete. The switch of failure mode led to an order of magnitude higher displacement capacity of ECC/anchor connections at about two times peak load compared with those of the concrete specimens, as indicated in Fig. 5 and Table 2. Concrete showed typical brittle fracture failure, with no crack observed during the initial loading stage. As the peak load was reached, a large crack suddenly initi-. Table 1 Material properties and mix proportion of different concrete materials for anchor pullout test (Mix proportions by weight except for fiber which is specified by volume)). Material. fc’ (MPa). εut (%). fut (MPa). *. C. S. CA. FA. W. SP. PVA Fiber. Concrete. 45.6 ± 1.0. -. 0.01. 1.0. 2.5. 2.5. 0. 0.45. 0.01. 0. ECC 1. 41.7 ± 0.5. 4.2 ± 0.3. 2.5 ± 0.4. 1.0. 0.8. 0. 1.2. 0.63. 0.005. 0.02. Mortar. 42.1 ± 1.0. -. 0.01*. 1.0. 2.5. 0. 0. 0.43. 0. 0. ECC 2. 43.4 ± 1.5. 5.5± 0.3. 2.5 ± 0.5. 1.0. 0.8. 0. 1.2. 0.58. 0.13. 0.02. ECC 3 1.0 1.0 0 0 0.44 0.01 0.02 54.4 ± 1.4 6.0 ± 0.4 2.5 ± 0.3 (fc’: compressive strength; fut: ultimate tensile strength; εut: tensile strain capacity; C: cement; S: sand; CA: coarse aggregate; FA: fly ash; W: water; SP: superplasticizer; PVA fiber: KURALON K-II REC15; * assumed value). F. F/2. F/2 5. Steel hinge. 15. 50 5. LVDT. 15. Anchor head 300. 100. 42.5. Thickness=50 Unit: mm. 300 (a). (b). Fig. 3 Test setup (a) and (b) geometry of the specimen for 2D anchor pullout experiment (Note: the LVDT on the front side was removed in (a) for clarity)..
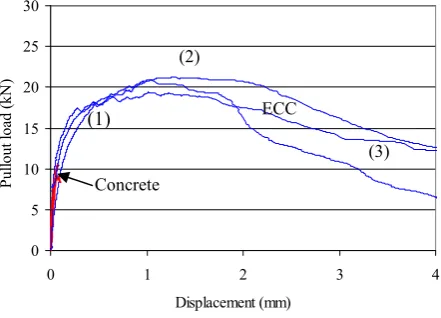
(4) 342. S. Qian and V. C. Li / Journal of Advanced Concrete Technology Vol. 9, No. 3, 339-351, 2011. O1. O2 A. B Anchor head. (b). (a). Anchor head. (c). Microcrack damage development. Localized fracture (e). (d). Fig. 4 (a) Fracture failure in anchor pullout from concrete; (b)Microcracks development process in ECC anchor pullout test showing: (c) initiation of microcracks; (d) microcracking damage development and (e) delayed fracture. The pictures (c-e) are enlarged frames of the rectangular box shown in test setup (b); 30. Table 2 Comparison of 2D anchor pullout test results with previous studies.. *. Concrete A 39.3 0.01 9.15 Concrete 45.6 ± 1.0 0.01* 9.5 ± 0.7 0.07 ± 0.01 ECC 1 41.7 ± 0.5 2.5 ± 0.4 21.2 ± 1.7 1.5 ± 0.6 (Concrete A is from Alvaredo et al (1998); *assumed value). ated near the anchor head and rapidly propagated towards the edges of the specimen, resulting in typical fracture pattern shown in Fig. 4(a). The fracture path was often asymmetrical about the mid-line of the specimen. The sudden drop after peak load (Fig. 5) indicated that the load carrying capacity of concrete anchor rapidly diminished after concrete fracturing. These observations were consistent with the findings from previous studies on 2D anchor pullout from concrete (Ohlsson and Ghasemlou 1993; Alvaredo et al 1998; Vervuurt et al 1998). Unlike concrete, ECC showed a ductile failure mode due to its strain hardening behavior (Figs. 4(c-e) and 5). During the initial loading stage, no cracks were observed on the ECC specimens. As the load increased, a few microcracks appeared on the surface, accompanied by the beginning of the inelastic range in the loaddisplacement curve. The microcracks continued to grow in number and in length with increased loading, as. 25 Pullout load (kN). Material. Comp. Tensile Pullout Pullout strength strain Load Displacement (MPa) capacity (%) (kN) (mm). (2). 20. ECC. (1). 15. (3). 10. Concrete. 5 0 0. 1. 2. 3. 4. Displacement (mm). Fig. 5 Comparison of 2D anchor pullout behavior for Concrete and ECC. The numbers (1)-(3) indicate the three stages of loading in the ECC specimens discussed in the text.. shown in Fig. 4(d). The crack width generally remained less than 80 micron. The corresponding nonlinear loaddisplacement curve (Fig. 5: stage (2)) was responsible for the majority of the pullout displacement. Eventually, the tensile strain capacity (the strain corresponding to ultimate tensile strength) of ECC near the anchor head was exhausted with one of the microcracks localized into a fracture, as shown in Fig. 4(e). The pronounced load drop was accompanied by this fracture localization. Due to the high fracture toughness of the ECC material,.
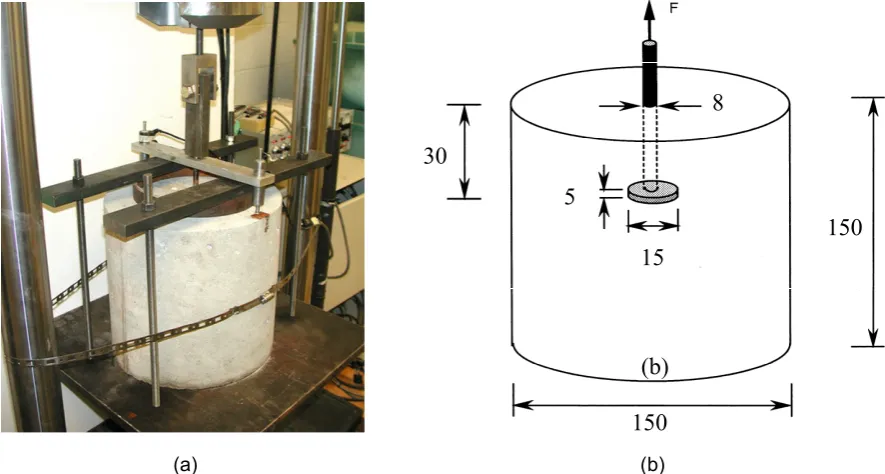
(5) 343. S. Qian and V. C. Li / Journal of Advanced Concrete Technology Vol. 9, No. 3, 339-351, 2011. however, the localized crack propagated much more gradually compared with that of the concrete specimens, resulting in a gentle descending curve. The final fracture path was typically symmetrical about the mid-line of the ECC specimens. 2.2 Three dimensional (3D) test Five materials (Table 1) were investigated in this test series, including Mortar, Concrete, ECCs 1-3. Concrete and ECC 1 were used in the anchor pullout test with 55 mm embedment length (including thickness of anchor head), while Mortar and ECCs 2-3 were investigated in the test with 30 mm embedment length. All materials except for ECC 3 had similar compressive strength, so that the influence of tensile ductility on the 3D anchor pullout behavior could be highlighted. The specimen geometry shown in Fig. 6 was adopted from RILEM recommendation for 3D anchor pullout experiments (Elfgren 1998). A steel pipe was used as mold with a steel anchor cast into a concrete cylindrical block. Similar to the 2D pullout specimens, the dimensions (diameter and height) of the concrete block were set to be sufficiently large to avoid the side-face blowout failure mode. Again three specimens were tested for each material. The curing conditions were the same as those used in the 2D pullout tests. Loading of the 3D anchor pullout specimens was also conducted on an MTS 810 machine with a loading configuration as shown in Fig. 6. Two LVDTs were mounted on diametrically opposite sides of the steel anchor to measure pullout displacement from the concrete block. The pullout load was employed by the top hydraulic grip while the reaction was provided by a steel frame system directly connected to the bottom hy-. draulic grip. To evenly distribute the reaction force, a steel ring was employed on the top surface of the specimen. For the same reason as in the 2D tests, the load was applied at a rate of 0.3 and 0.06 mm/min for ECC and concrete, respectively. Similar to the 2D pullout tests, the pullout response of ECC cylindrical specimens was greatly improved compared with those of the mortar and concrete ones for both 30 and 55 mm embedment length cases. As shown in Fig. 7(a-b), the failure mode switched from cone shaped sudden brittle fracture in the mortar/concrete specimens to a gradual ductile damage (multiple cracking) process in the ECC specimens. The switch of failure mode led to significantly higher pullout load and displacement when compared with those of the mortar/concrete specimens, as indicated in Table 3. Fig. 7(c) showed a typical symmetrical pullout cone from ECC with a cone angle of approximately 45 degree. In the case of mortar/concrete specimens, no damage was observed on the outside surfaces of the specimens during the initial loading stage up to peak load. Once reaching peak load, large cracks suddenly initiated near the anchor head and rapidly propagated towards the top surface of the specimens, resulting in very rapid load drop. Severe stress concentration induced by the steel anchor led to rapid development of cone shaped macro crack in mortar/concrete, resulting in a catastrophic failure of the mortar/concrete pullout specimens. Conversely, the ECC specimens showed a ductile failure mode due to its strain hardening behavior, as shown in Fig. 7(b). When the stress concentration induced by the anchor head exceeded the cracking strength of ECC, the specimens responded with a ductile microcracking damage process instead of a sudden. 8 30 5 150 15. (b) 150 (a). (b). Fig. 6 3D anchor pullout test with (a) loading configuration and (b) specimen profile (for 30 mm embedment length; For the 55 mm embedment length specimen, the height and diameter of the specimen are both 300 mm (unit in mm)..
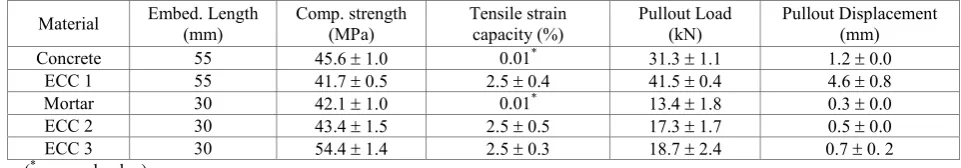
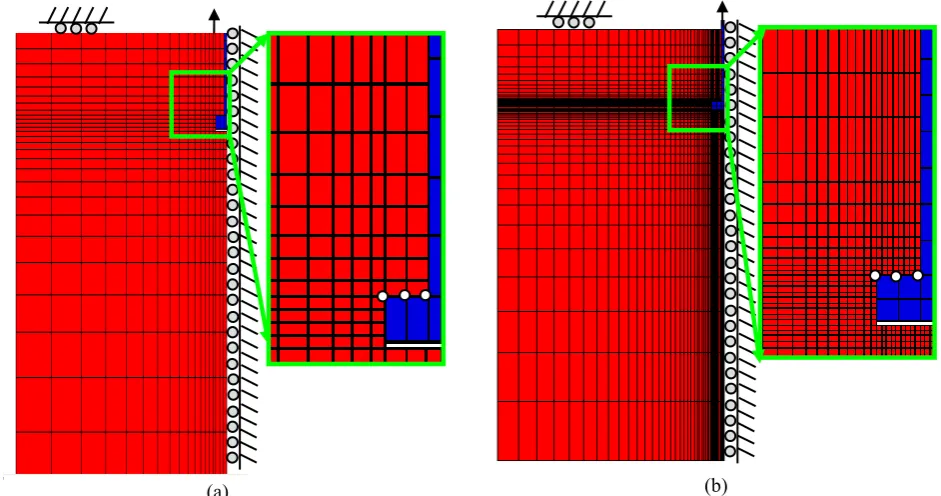
(6) 344. S. Qian and V. C. Li / Journal of Advanced Concrete Technology Vol. 9, No. 3, 339-351, 2011. (a). hem 45o (b). (c). Fig. 7 Anchor pullout test showing (a) natural fracture surface of typical cone failure in concrete; (b) final microcrack pattern in ECC and (c) typical pullout cone from ECC (specimen in (b) was cut along the section of anchor bar to expose the damage pattern). Table 3 Comparison of 3D anchor pullout test results. Material Concrete ECC 1 Mortar ECC 2 ECC 3 (*assumed value). Embed. Length (mm) 55 55 30 30 30. Comp. strength (MPa) 45.6 ± 1.0 41.7 ± 0.5 42.1 ± 1.0 43.4 ± 1.5 54.4 ± 1.4. fracture as in the case for the mortar/concrete specimens. Through this damage process, stress concentration was diffused and the load was redistributed inside the ECC specimens. As a result, the pullout load displacement curves for ECCs showed much larger inelastic deformation with enhanced load capacity (Table 3 and Fig. 8). No yielding of steel anchor was observed in any of the 3D specimens. This was expected since the maximal tensile stress in the steel shank is only about 800 MPa (maximum recorded load divided by the cross-sectional area of the steel shank), well below the tensile strength of steel shank (1100 MPa).. 3. Numerical analysis of anchor pullout 3.1 Verification of the anchor pullout model As mentioned earlier, the 2D anchor pullout experimen-. Tensile strain capacity (%) 0.01* 2.5 ± 0.4 0.01* 2.5 ± 0.5 2.5 ± 0.3. Pullout Load (kN) 31.3 ± 1.1 41.5 ± 0.4 13.4 ± 1.8 17.3 ± 1.7 18.7 ± 2.4. Pullout Displacement (mm) 1.2 ± 0.0 4.6 ± 0.8 0.3 ± 0.0 0.5 ± 0.0 0.7 ± 0. 2. tal results were employed for benchmark verification of the anchor pullout model before parametric studies were executed for a broader material properties variation. In this section, the FEM model and material inputs was briefly described. This was then followed by a comparison of experimental observations with results from the FEM analysis. Due to the symmetric loading condition (at least up to failure load), only the left half of the rectangular specimen was modeled with the symmetric plane restrained from moving horizontally (Fig. 9), with dimensions corresponding to those of the half specimen. The support portion of the specimen cannot move vertically. The load was applied at the end of anchor under displacement control, which was also the case in the actual experiment. The three nodes shown in Fig. 9(a) were directly connected between ECC and steel anchor head..
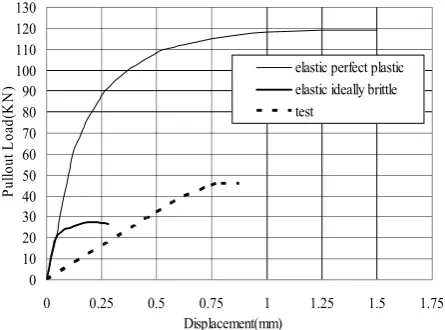
(7) 345. S. Qian and V. C. Li / Journal of Advanced Concrete Technology Vol. 9, No. 3, 339-351, 2011. 60. Table 4 Material properties used in FEM simulation of 2D anchor pullout for verification.. Pullout Load (kN). 50. ECC. 40. Material fc’ (MPa). 30. Concrete 20. COD fcr E (GPa) f (MPa) ευτ(%) (mm) (MPa) ut. Concrete. 45. 3.5. 3.5. 0. 0.0625. 25. ECC 1. 42. 3.5. 4.2. 2.5. 6. 16. Steel. -. -. -. -. 200. ’. (fc : compressive strength; fcr: first crack strength; fut: ultimate tensile strength; εut: tensile strain capacity; COD: crack opening displacement; E: modulus of elasticity). 10 0 0. 2. 4. 6. 8. 10. Pullout displacement (mm). Fig. 8 Comparison of 3D anchor pullout behavior for Concrete and ECC with 55 mm embedment length.. Considering that the vertical edges of ECC cannot penetrate but can separate from the steel anchor (the cohesion between steel and ECC, if any, is ignored), the restraint for the vertical edges was simulated as springs which can only be activated under compression. The interface between the steel and ECC at the bottom edge of the steel anchor was assumed traction free. A FEM model with finer mesh (for numerical convergence studies) was also shown in Fig. 9 (b). The material models for ECC in tension and compression were shown in Fig.10, with experimentally determined material properties summarized in Table 4. The critical crack opening displacement (COD) of 0.0625 mm when crack face traction completely ceases for concrete was adopted from Li and Li (2009). The. (a). corresponding COD for ECC was 6mm, which was equal to half of the fiber length. Prior to tension softening, ECC exhibited tensile strain hardening up to its strain capacity εut. Once the ultimate tensile strength fut was reached, the localized fracture had to be smeared over single element in order to maintain mesh size independent. In FEMMASSE, this was achieved by specifying the characteristic length (a value related to the mesh size) to be the default value, which meant that the program would automatically calculate characteristic length according to the actual mesh size. Experimental observations suggested that the final failure (associated with peak load and corresponding displacement) was governed by exhaustion of tensile ductility near the anchor head (as shown in Figs. 4(e) and 11(a)). Furthermore, no apparent shear sliding was occurred during pullout test as there was no through-edge microcrack, therefore, the shear constituent model was considered unimportant in the analysis. The comparison of experimental findings with FEM. (b). Fig. 9 2-D FEM model of anchor pull-out with (a) regular mesh and (b) finer mesh..
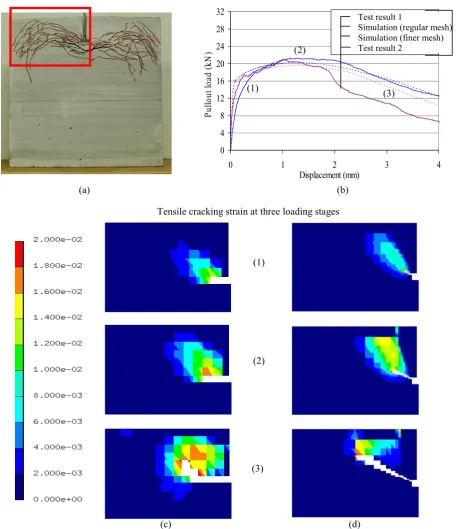
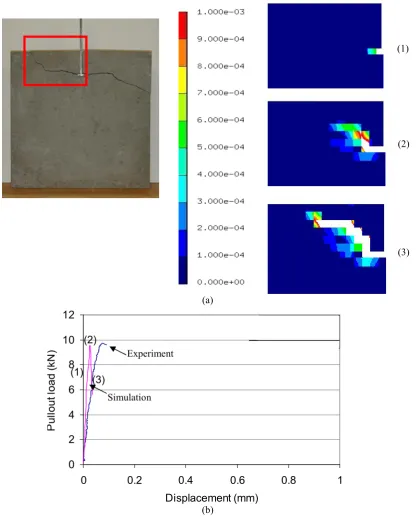
(8) 346. S. Qian and V. C. Li / Journal of Advanced Concrete Technology Vol. 9, No. 3, 339-351, 2011. σ. σ fc’. fut k. fcr E. ECC Concrete. E. ε. COD. εut (a). (b). Fig. 10 (a) Tensile and (b) compressive models for concrete and ECC in FEM analysis.. simulation results revealed good agreement in terms of microcrack pattern (Fig.s 4(c-e) and 11(c-d), shown as cracking strain in simulation) and pullout loaddisplacement response (the relationship between the pullout load and displacement of the anchor head, Fig. 11(b)) for the ECC specimens. The tensile strain capacity for ECC used in this simulation was 2.5%. Load stages 1 and 2 showed simulation results with little dependence on mesh size. At stage 3 when localization of a real fracture occurred, a finer mesh size was necessary to capture the correct fracture path. Nevertheless, the predicted load and displacement capacities were reasonably close. It should be noted that the elements showing white color in Fig. 11 had reached a tensile strain value exceeding the maximum tensile strain on the color scale bar. The comparison of concrete fracture process and pullout load-displacement response from experiment and FEM simulation generally showed good agreement (Fig. 12). In the experiment, no damage could be observed until sudden fracture takes place, resulting in rapid load drop and very limited deformation capacity. The results from FEM simulation also revealed the same trends in terms of rapid crack propagation (from stage 1-3), crack path and load capacity. It should be noted that the maximum tensile cracking strain that could be revealed in color (red) in Fig. 12 is 0.1%. In ECC anchor pullout test, the actual fracture localization was at a small distance below the anchor head, as shown in Fig. 11(a). In contrast, the fracture of concrete specimen (Fig. 12(a)) initiated directly from the edge of the anchor head. This observation demonstrated the ability of ECC to redistribute the initial highly concentrated stress near the head through a microcrack damage process, to the bulk part of the ECC material. The ECC near the anchor head might still experience higher stress compared with surrounding area. However, a more gentle stress gradient and the presence of variability of material properties such as maximum fiber bridging strength in ECC (Li and Wang 2006) determined the exact location of the initiation of fracture localization, which was not necessary at the very edge. of the anchor head. In the case of concrete, this mechanism could not occur due to the extremely high stress concentration (and steep stress gradient) that could not be redistributed to the surrounding area, even though material property variation could also exist. The stability of “plastic” deformation in the form of microcracking in ECC as opposed to unstable fracture in brittle concrete played an important role in the damage tolerant behavior of the anchor connection. The same mechanism could also explain the reason behind the observed failure path asymmetry in concrete and symmetry in ECC. In both materials, initially one side of material near the anchor head might firstly be damaged due to variability of material properties. For ECC, the other side of material near the head could quickly be activated (microcracked) due to its stress redistribution capability; eventually resulting in symmetric failure pattern after this process repeats itself for many times. For concrete, however, no such mechanism existed and therefore a sudden failure occured. Typically one side of the specimen formed a triangle (Part A in Fig. 4(a)) and the other side formed a trapezoid (Part B in Fig. 4(a)), as a result of horizontal reaction caused by the rotation of Part A around support O1. 3.2 Influence of material properties on damage mechanism Once the FEM anchor pullout model was verified by experimental results successfully, parametric studies were carried out to reveal the influence of various material properties on the anchor pullout behavior. The material properties varied in this study included: tensile strain capacity εut, strain-hardening modulus k, ultimate tensile strength fut, compressive strength fc’ and modulus of elasticity E (see Fig. 10). The influence of material tensile ductility on the anchor pullout behavior was shown in Fig. 13. Both ECCs with 2% and 4% strain capacity showed load capacity more than twice that of concrete. Accordingly, the ultimate pullout displacement (also displacement capacity: the displacement corresponding to the peak load) for.
(9) 347. S. Qian and V. C. Li / Journal of Advanced Concrete Technology Vol. 9, No. 3, 339-351, 2011. 32. Test result Test result1 1 Test result 2 (regular mesh) Simulation Simulation(regular Simulation (finermesh) mesh) Simulation mesh) Test result(smaller 2. Pullout load (kN ) .. 28 24. (2). 20 16. (1). 12. (3). 8 4 0 0. 1. (a). 2 Displacement (mm). 3. 4. (b) Tensile cracking strain at three loading stages. (1). (2). (3). (c). (3). (d). Fig. 11 (a) crack pattern in ECC1 pullout specimen; (b) pullout load-displacement relation from experiment/FEM simulation along with microcracking damage process in (c) regular mesh and (d) fine mesh.. ECCs was about an order of magnitude higher compared with that of concrete. From strain capacity 2% to 4%, the displacement capacity of ECC also increased significantly. It was interesting to note that the load capacities for these ECCs were not significantly different even though their strain capacity differed by a factor of two. It was therefore expected that the influence of tensile strain capacity on the anchor pullout load was a highly nonlinear relation.. To understand the influence of material tensile ductility on the anchor pullout behavior more clearly, the effect of strain hardening was removed by employing a zero hardening modulus (i.e. the cracking strength and ultimate tensile strength were the same, or k=0). As shown in Fig. 14, the general trend was similar to the previous case, where the strain-hardening effect was present. The relation of pullout load with material tensile ductility was shown in Fig. 15, where the x-axis.
(10) 348. S. Qian and V. C. Li / Journal of Advanced Concrete Technology Vol. 9, No. 3, 339-351, 2011. Tensile cracking strain at three loading stages. (1). (2). (3). (a). 12. Experiment Simulation. Pullout load (kN).. 10 (2) 8 (1) 6. Experiment. (3) Simulation. 4 2 0 0. 0.2. 0.4. 0.6. 0.8. 1. Displacement (mm) (b) Fig. 12 Comparison of (a) concrete fracture process and (b) pullout load-displacement relation from anchor pullout experiment with FEM simulation.. was shown in logarithmic scale. Therefore, the linear line in Fig. 15 revealed a logarithmic relation between anchor pullout load and tensile strain capacity. When ECC tensile ductility ranged from 2-4%, the anchor pullout load could be practically regarded as unchanged. The influence of ultimate tensile strength on the anchor pullout behavior was shown in Fig. 16. This figure suggested that the anchor pullout load was governed by the ultimate tensile strength when a reasonable material. tensile ductility was present (in this case, 2% tensile strain capacity is assumed). This relation between load capacity and ultimate tensile strength of ECC should be captured in any proposed design equation for anchor pullout load capacity for ECC. Additionally, the influence of compressive strength and modulus of elasticity on the anchor pullout behavior was shown in Figs. 17 and 18. Both results suggested that compressive strength and modulus of elasticity.
(11) 349. S. Qian and V. C. Li / Journal of Advanced Concrete Technology Vol. 9, No. 3, 339-351, 2011. 40. 25 20 15 10. ECC4%(harden) ECC2%(harden). 5. concrete. 0 0. 1. 2. 3. Anchor pullout load (kN).. Pullout load (kN) .. 30. 30 20 10 0 0.01%. 4. Pullout displacement (mm). Fig. 13 Influence of material ductility on the anchor pullout response (with strain-hardening effect) (for all mate’ rials: fc =40 MPa and fcr = 4 MPa; fut=4.8 MPa and E=16 GPa for both ECCs; E=25 GPa for concrete).. 0.10% 1.00% Tensile strain capacity. 10.00%. Fig. 15 Anchor pullout load capacity and tensile strain capacity relation. 35 30 Pullout load (kN) .. 30 Pullout load (kN) .. 25 20 15 10. 0 0. 1. 2. 3. 20 15. ECC2%(fut=6) ECC2%(fut=4.8). 10. ECC2%(fut=3.6) concrete(fut=5). 5. ECC4%(noharden) ECC2%(noharden) FRC0.1%(noharden) concrete. 5. 25. 0 0 4. Pullout displacement (mm). Fig. 14 Influence of material ductility on the anchor pullout response (without strain-hardening effect) (For all ’ materials: fcr = fut = 4.8 MPa and fc =40 MPa; E=16 GPa for ECC; E=25 GPa for FRC and concrete).. were not critical factors in determining the pullout load and displacement. This was expected since in 2D anchor pullout test for ECC, none of the specimen failed by exhausting compressive strength or crushing. In all cases for ECC, the specimens reached peak load when the ultimate tensile strength was exceeded (i.e., when the tensile strain capacity was exhausted). 3.3 Technical implication – anchor pullout load capacity prediction The results from 2D anchor pullout FEM simulation suggested that the anchor pullout load was mostly governed by the ultimate tensile strength when high tensile ductility is present. The anchor pullout load capacity was not sensitive to tensile ductility in the simulated range (2-4%). Nevertheless, the structural ductility (ultimate pullout displacement) was significantly influenced by the material tensile ductility. Additionally, it was confirmed that the compressive strength and modulus of elasticity were not critical factors as long as there was no crushing or compressive failure. Based on above observations, the pullout load capacity was found to be dominated by the ultimate tensile. 1 2 3 Pullout displacement (mm). 4. Fig. 16 Influence of material ultimate tensile strength on anchor pullout response (fcr=5, 4, 3 MPa for three ECCs, ’ respectively, fc =40 MPa, E=16 GPa for all ECC; E=25 GPa for concrete).. strength of ductile ECC. Furthermore, the embedment length should be present in typical equation for predicting the anchor pullout capacity of concrete (Eligehausen and Balogh 1995; Fuchs et al 1995). According to dimensional analysis, the square of embedment length should be included in order to make the prediction equation dimensionally correct. Therefore, from a practical application viewpoint, the pullout load capacity for ECC could be regarded as the summation of critical tensile stress (equal to ultimate tensile strength) acting on the projected area of failure cone formed during anchor 2 , for an observed pullout, which had an area of π hem pullout cone angle of approximate 45° (Fig. 7(c)). Hence, a simple equation for predicting anchor pullout load capacity was proposed as follows: 2 Pc = f ( hem , f ut ) = Qπ hem f ut. (1). where: Pc is nominal pullout load capacity for ECC (N); hem is the anchor embedment length (mm) (Fig. 7(c)); fut is the ultimate tensile strength (MPa) of ECC; and Q is a numerical factor of the order unity. Results from 3D anchor pullout tests were used to verify the proposed equation, as shown in Table 5. The predictions based on equation (1) matched well with the pullout load capacity from 3D experimental results, all.
(12) 350. S. Qian and V. C. Li / Journal of Advanced Concrete Technology Vol. 9, No. 3, 339-351, 2011. Table 5 Comparison of 3D pullout load capacity from test and prediction based on Equation (1). Embedment length (mm). Ultimate tensile strength (MPa). Pullout load capacity from 3D test (kN). Predicted pullout load capacity based on Eq1 (kN). ECC 1. 55. 4.2. 41.5. 39.9. -3.9. ECC 2. 30. 5.5. 17.3. 15.5. -10.4. ECC 3. 30. 6.0. 18.7. 17.0. -9.1. 4. Conclusions This paper presented the damage process and mechanism in ECC under high stress concentration near the head of embedded steel anchor under tensile loading. 2D anchor pullout experimental observations were employed to reveal the influence of material ductility on the anchor pullout behavior. The experimental data was used to verify an FEM model of the anchor pullout process in concrete and ECC. Furthermore, a parametric study on the influence of various material properties on the damage zone spreading process in ECC was investigated via the 2D anchor pullout numerical simulation, which formed the basis for a proposed equation for anchor pullout capacity. The following conclusions can be drawn: (1) The experimental results suggested that tensile ductility enhanced the pullout performance of ECC compared with that of the concrete/mortar specimens in terms of pullout load and displacement both in 2D and 3D tests. This was because the high ductility in ECC helped to redistribute the high stress concentration near the anchor head to surrounding area, thereby delaying the fracture failure and boosting the overall structural performance for ECC. (2) The FEM numerical simulation with an embedded elastic/strain-hardening constitutive model accurately captured the essential observations of damage evolution and failure modes in the ECC and concrete anchor pullout tests, with reasonable agreement of the pullout load and displacement between the experiment and simulation results. (3) Results from the 2D anchor pullout FEM simulation reinforced the experimental finding – that the material tensile ductility was the governing factor for switching the failure mode from concrete brittle fracture to ECC ductile damage process in the high stress concentration zone, resulting in a much enhanced load capacity. Pullout load (kN) .. 30 25 20 15 10 ECC2%(fc'=60MPa). 5. ECC2%(fc'=40MPa). 0 0. 1 2 3 Pullout displacement (mm). 4. Fig. 17 Influence of material compressive strength on anchor pullout behavior with same ductility (fcr=4 MPa, fut=4.8 MPa, εut=2%, E=16 GPa) . 30 Pullout load (kN) .. within 10% difference, when Q was taken as equal to 1. Furthermore, the proposed equation was also conservative and therefore safe in predicting pullout load capacity, considering the predictions were consistently smaller than the pullout load capacity from experiment. While the comparison of the pullout load capacity between experimental results and predictions showed reasonable agreement, a much larger database from 3D ECC pullout test was needed to further verify the proposed equation before it could be employed in practice, which was beyond the scope of this study.. Difference (%). 25 20 15 10 ECC2%(E=20GPa). 5. ECC2%(E=16GPa). 0 0. 1 2 3 Pullout displacement (mm). 4. Fig. 18 Influence of material modulus of elasticity on anchor pullout behavior with same ductility (fcr=4 MPa, fut=4.8 MPa, εut=2%, fc’=40 MPa).. and structural ductility for ECC. Once the ductile failure mode was assured, however, the anchor pullout capacity was found to be governed by the tensile strength of ECC. (4) The numerical simulation formed the basis for a proposed simple design equation of anchor pullout capacity in ECC, in additional to the dimensional analysis. The 3D anchor pullout tests in ECC verified the proposed equation with reasonable accuracy (within 10% difference when Q was taken as unity). Furthermore, the proposed equation was also conservative and therefore safe in predicting pullout load capacity, considering the predictions were consistently on the lower side when compared with the experiment results. (5) The 2D numerical results showed that the influence of compressive strength, modulus of elasticity on the anchor pullout behavior was minimal since the fail-.
(13) S. Qian and V. C. Li / Journal of Advanced Concrete Technology Vol. 9, No. 3, 339-351, 2011. ure mode was not associated with concrete crushing. In the case of 3D anchor pullout test, the same conclusion holds as long as no concrete crushing occurs. Otherwise, the proposed design equation needs to be modified accordingly. More detailed experiments are needed to address this issue, which is beyond the scope of this study. Acknowledgments This work was supported by a research grant from the Michigan Department of Transportation to the University of Michigan. This support is gratefully acknowledged. Partial support from US NSF MUSES Program Grant Nos CMS-0223971 and CMS-0329416 is also acknowledged. The author also would like to thank Dr Erik Schlangen at Delft University of Technology for providing guidance during the numerical study using the FEMMASSE FEM code. References ACI-318, (2008). “Building code requirements for structural concrete and commentary.” ACI Committee 318, 408. Alvaredo, A. M., Slowik, V. and Wittmann, F. H., (1998). “Experimental study on the fracture of anchorage of bolts.” Research report - Round robin analysis and tests of anchor bolts in concrete structures, Edited by Elfgren, L., RILEM TC 90FMA. Elfgren, L., (1998). “Round robin analysis and tests of anchor bolts in concrete structures.” Research report, RILEM TC 90-FMA. Eligehausen, R. and Balogh, T., (1995). “Behavior of fasteners loaded in tension in cracked reinforced concrete.” ACI Structural Journal, 92(3), 365-379. Eligehausen, R. and Clausnitzer, W., (1983). “Analytisches modell zur beschreibung des tragverhaltens von befestigungs-elementen.” Report 4/1-83/3, Institut fur Werkstoffe im Bauwesen, Universitat Stuttgart. Femmasse user manual, (2006). “MLS version 8.5 of Femmasse B. V.” Femmasse B. V., The Netherlands, October. Fuchs, W., Eligehausen, R. and Breen, J. E., (1995). “Concrete capacity design approach for fastening to concrete.” ACI Structural Journal, 92(1), 73-94. Han, T. S., Feenstra, P. H. and Billington, S. L., (2003). “Simulation of highly ductile fiber-reinforced cement-based composite components under cyclic loading.” ACI Structural Journal, 100(6), 749-757. Kabele, P., (2001). “Assessment of structural performance of engineered cementitious composites by computer simulation.” CTU Reports, 5(4), 2001, 99 pp. Kabele, P., (2005). “Fracture behavior of shear-critical reinforced HPFRCC members.” Proceedings of the International Workshop on HPFRCC in Structural Applications, May, US.. 351. Kabele, P., (2007). “Multiscale framework for modeling of fracture in High Performance Fiber Reinforced Cementitious Composite.” Engineering Fracture Mechanics, 74(1-2), 194-209. Kanda, T. and Li, V. C., (1999). “A new micromechanics design theory for pseudo Strain Hardening Cementitious Composite.” ASCE J. of Engineering Mechanics, 125 (4), 373-381. Kunieda, M. and Rokugo, K., (2006). “Recent progress on HPFRCC in Japan.” Journal of Advanced Concrete Technology, 4(1), 19-33. Li, M. and Li, V. C., (2009). “Influence of material ductility on the performance of concrete repair.” ACI Materials J., 106(5), 419-428. Li, V. C., (1993). “From micromechanics to structural engineering--The design of cementitous composites for civil engineering applications.” JSCE J. of Structural engineering and Earthquake Engineering, 10(2), 37-48. Li, V. C., (2003). “On Engineered Cementitious Composites (ECC) – A review of the material and its applications.” Journal of Advanced Concrete Technology, 1(3), 215-230. Li, V. C. and Hashida, T., (1993). “Engineering ductile fracture in brittle matrix composites.” J. of Materials Science Letters, 12, 898-901. Li, V. C. and Kanda, T., (1998). “Engineered cementitious composites for structural applications.” Innovations Forum in ASCE, J. Materials in Civil Engineering, 10(2), 66-69. Li, V. C. and Wang, S. X., (2006). “Microstructure variability and macroscopic composite properties of high performance fiber reinforced cementitious composites.” J. Probabilistic Engineering Mechanics, 21(3), 201-206. Ohlsson, U. and Ghasemlou, F., (1993). “Anchor bolts tests – Plane and axisymmetric stresses.” Technical report 1993:04 T, Lulea University of Techinology, Division of Structural Engineering, ISSN 0349-3571, Lulea, 60. Qian, S. Z. and Li, V. C., (2006). “Influence of concrete material ductility on shear response of stud connections.” ACI Material Journal, 103(1), 60-66. Qian, S. Z. and Li, V. C., (2009). “Influence of material tensile ductility on headed anchor pullout performance.” ACI Material Journal, 106(1), 72-81. Suryanto, B., Nagai, K. and Maekawa, K., (2010). “Smeared-crack modeling of R/ECC membranes incorporating an explicit shear transfer model.” Journal of Advanced Concrete Technology, 8(3), 315326. Vervuurt, A. H. J. M., Schlangen, E. and van Mier, J. G. M., (1998). “ Pullout of steel anchors embedded in concrete.” Research report - Round robin analysis and tests of anchor bolts in concrete structures, Edited by Elfgren, L., RILEM TC 90-FMA..
(14)
Figure
+7

Related documents