R E S E A R C H A R T I C L E
Open Access
Difference in whole spinal alignment
between supine and standing positions in
patients with adult spinal deformity using a
new comparison method with
slot-scanning three-dimensional X-ray imager
and computed tomography through digital
reconstructed radiography
Kazuhiro Hasegawa
1*, Masashi Okamoto
1, Shun Hatsushikano
1, Gabriel Caseiro
2and Kei Watanabe
3Abstract
Background:A precise comparison of supine and standing whole spine alignment in both the coronal and sagittal planes, including the pelvic parameters, has not been reported. Furthermore, previous studies investigated positional differences in the Cobb angle only in young patients with idiopathic scoliosis. The difference in alignment has never been investigated in a population of patients with adult spinal deformity (ASD). In most cases, ASD patients are aware of the symptoms when standing and tend to stoop with back pain, whereas the symptoms disappear when lying on a bed. Therefore, it is important to elucidate the positional differences in the deformity in older adults. The purposes of this study are to establish a method for comparing whole spine alignment between supine and standing, and to clarify the positional difference of the alignment in the patients with ASD.
Methods:Twenty-four patients with ASD (mean age: 60.1 years, range 20–80 years; 24 women) were evaluated. A slot-scanning three-dimensional X-ray imager (EOS) was used to assess the whole spine in the standing position. Computed tomography was used to assess the whole spine in the supine position. The computed tomography DICOM dataset of the whole spine in the supine position was transformed to two-dimensional (coronal and sagittal) digital reconstructed radiography images. The digital reconstructed radiography images were input for three-dimensional measurement by the EOS software and compared with the standing whole spine alignment measured by EOS.
Results:The mean intraclass correlation coefficients (supine, standing) of intra-rater / inter-rater reliabilities for the measured parameters were 0.981, 0.984 / 0.970, 0.986, respectively. The Cobb and rotation angles of the major curve, mostly the thoracolumbar area, were significantly greater in the standing position than in the supine position. Lumbar lordosis during standing was significantly kyphotic. With respect to the pelvic parameters, the sacral slope was significantly smaller in the standing position than in the supine position. Pelvic tilt and pelvic incidence were significantly greater in the standing position than in the supine position.
(Continued on next page)
* Correspondence:[email protected]
1Niigata Spine Surgery Center, 2-5-22 Nishi-machi, Niigata City 950-0165,
Japan
Full list of author information is available at the end of the article
(Continued from previous page)
Conclusions:The lumbar to pelvic parameters and the major curve in standing position significantly deteriorate compared with the supine position in patients with ASD.
Keywords:Adult spinal deformity, Computed tomography, Digital reconstructed radiolography, Slot-scanning 3D X-ray imager (EOS), Supine and standing position, Whole spinal alignment
Background
Spinal deformity is a three-dimensional abnormality. Alignment is usually assessed in standing radiographs in both the sagittal and coronal planes using the Cobb angle [4]. When a patient presents with neurologic symptoms, details of the abnormality are usually assessed by referring to computed tomography (CT) im-ages or magnetic resonance imim-ages (MRI) obtained with the patient in a supine position. Previous studies of ado-lescent idiopathic scoliosis (AIS) report major Cobb an-gles 7–10° smaller in the supine position than in the standing position due to changes in the gravitational loading direction [1, 21, 28, 30]. Therefore, to under-stand the pathology of the whole spine, it is important to determine the difference in the curve measurement between the supine and standing positions, including alignment. A drawback of previous reports is the poten-tial error related to different measurement methods used for X-ray and other imaging modalities (CT or MRI) to compare the Cobb angle, which may lead to misinterpretation or controversy [1,20,21,28,30].
To our knowledge, a precise comparison of supine and standing measurements using the same modality and measurement method to overcome this drawback has not been reported. Whole spine alignment in both the coronal and sagittal planes, including the pelvic parame-ters, with regard to a positional difference has not been investigated. Furthermore, previous studies investigated positional differences in the Cobb angle only in young patients with AIS. The difference in alignment has never been investigated in a population of patients with adult spinal deformity (ASD). In contrast to AIS, the chief complaint of patients with ASD is usually mechanical back pain with or without radicular pain to the lower ex-tremities. In most cases, the patients are aware of the symptoms when standing and tend to stoop with back pain, whereas the symptoms disappear when lying on a bed. Therefore, it is important to elucidate the positional differences in the deformity in older adults.
The purposes of this study were to: 1) Establish a method of comparing whole spine alignment between the supine and standing positions with minimal meas-urement error; and 2) Clarify the difference in the whole spine alignment between the supine position and the weight-bearing standing position in adult-to-elderly pa-tients with spinal deformity.
Methods
Measurement of standing whole spine alignment with the EOS system
Comparison of whole spine alignment between the supine and standing positions necessitates high re-producibility of the imaging technology. Conven-tional X-ray measurement with a cone-beam X-ray provides significant magnification of the subject within the margin of the cassette. Therefore, we used the EOS system (EOS Imaging, Paris, France) as a principal device for measuring whole spine alignment [16]. The EOS system is a slot-scanning three-dimensional (3D) X-ray imager developed in collaboration by multidisciplinary partners, radiation physics engineers, biomechanical engineers, medical radiologists, and orthopedic pediatric surgeons to overcome the limitations of conventional X-ray measurement. From the simultaneous anteroposterior and lateral X-rays of the whole body to the 3D bone external envelope technique, 3D reconstruction is possible at every level of the osteoarticular system and especially the spine in the standing position. The EOS allows for more precise bone reconstruc-tion in orthopedics, especially at the level of the spine, pelvis, and lower limbs, with limited X-ray ex-posure compared with conventional X-rays and CT scans [6, 7, 9, 19].
Radiographs with the EOS system [3,9] were routinely obtained, as follows: 1) EOS radiographs were made from the head, including the center of the auditory canal, to the feet. 2) Each patient was asked to stand comfortably on a force plate while placing their hands on their cheeks. 3) A mirror placed at eye level in the inner wall of the EOS cabin helped the patient maintain a horizontal gaze [16].
Measurement of supine whole spine alignment with CT-generated digital reconstructed radiographs
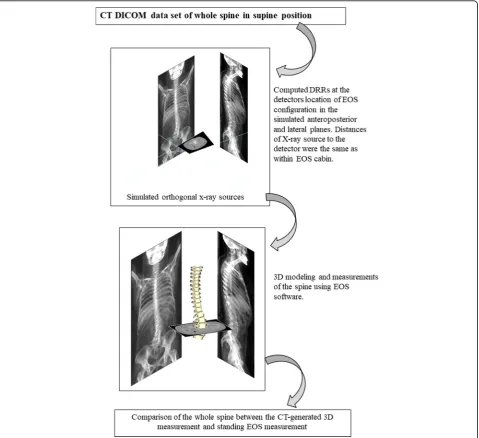
Following EOS scanning, the whole spine, including the head and pelvis of the patient, was also scanned in the su-pine position with CT (Activion16, TSX-031A, Toshiba Medical Systems Corp., Tochigi, Japan). Currently, the most accurate 3D bone information may be obtained with CT imaging. To eliminate software-related bias and to guarantee equivalent computational methods during spi-nopelvic parameter comparisons between the supine position in the CT and the standing position in the EOS, the same analysis software must be used. Therefore, we chose to transform the CT dataset into an EOS-like data-set using the digitally reconstructed radiograph (DRR)
technique. The DRR technique consists of simulating X-rays passing through the reconstructed CT volume based on an absorption-only optical model, thus generat-ing an X-ray-like image. These biplanar projections were reconstructed using the same calibration parameters and geometry as the EOS cabin (Fig. 1). These projected an-teroposterior and lateral DRRs, as well as those performed with the EOS system, were used as inputs for stereoradio-graphic spine modeling. Thus, for each position, 3D spine modeling was obtained using sterEOS software (sterEOS 1.6, EOS Imaging, Paris, France) [15] with both the EOS data (standing position) and the CT-generated DRRs (supine position), and compared between the two posi-tions (Fig.2).
[image:3.595.60.540.276.714.2]Spino-pelvic parameters for comparison
Using the full-spine workflow of the sterEOS soft-ware, the following spinopelvic parameters were cal-culated: kyphosis T1–T12 and T4–12, lumbar lordosis (LL) with respect to L1–L5 and L1–S1, pel-vic tilt (PT), sacral slope (SS), and pelpel-vic incidence (PI). PI is the angle between the line perpendicular to the sacral plate at its midpoint and the line con-necting the midpoint of the sacral plate to the cen-ter of the axis connecting both acetabulae. PT is the angle defined between the line connecting the mid-point of the sacral plate to the center of the axis of both acetabulae and the vertical axis. SS is the angle between the sacral plate and the horizontal line. Re-garding the deformity, the Cobb angle of the major curve (Cobb angle) and the axial vertebral rotation of the apex in the major curve (Rotation) were mea-sured. All of the parameter results were compared between the supine (CT-generated DRR) and stand-ing (EOS) positions.
Clinical subjects
After obtaining institutional review board approval (Approval number 2, 27th Dec., 2013, Institutional Re-view Board of Kameda Daiichi Hospital, Niigata, Japan), we prospectively enrolled patients with ASD under the following criteria: 1) diagnosis: degenerative and idiopathic spinal kyphoscoliosis with Cobb angle more than 30° or degenerative kyphosis with PI-LL mismatch more than 20°,2) age: > 20 years old, 3) sex: woman, 4) candidate for surgical treatment, 5) a full-spine CT scan (acquired from auditory canals to the proximal third of the femur) and a full-spine EOS image in both preoperative and postoperative states, 6) study term: from April 2014 to March 2016. The following demographic characteristics were obtained for each patient: age, sex, weight, and height. The body mass index was calculated as the weight in kilo-grams divided by the square of the height in meters. Patients with transitional vertebrae were excluded for precise measurement and comparison between supine
[image:4.595.60.539.86.432.2]and standing positions. Regarding the gender differ-ence, we found a significant difference between men and women in PT, pelvic thickness, SVA, and lower extremity alignment in the previous study [17]. If men are included, the result may be affected. Therefore, men are excluded in this study. Consequently, a total of 24 cases with a mean age of 60.1 years (range: 20– 80 years; 24 women) were analyzed after obtaining of informed consent for participation in the study. We used the Japanese version of the Oswestry Disability Index (ODI) [12,13] and Scoliosis Research Society-22 score (SRS-22) [2, 18] to assess the health-related quality of life. ODI and SRS-22 are the principal condition-specific outcome measures used in the man-agement of low back disorders and spinal deformities, respectively. Normal values without symptoms are 0 (%) in the ODI and 5 in the SRS-22, with the worst values being 100 (%) in the ODI and 0 in the SRS-22.
Statistical analysis
JMP (version 9; SAS Institute, Cary, NC) and SPSS (IBM SPSS Statistics for Windows, Version 24.0, IBM Corp., Armonk, NY) were used for all statistical analyses. Mean, range, standard deviation (SD), standard error (SE), and the interquartile range, 25%/75%, were calculated for all the demographic and radiographic parameters. All variance-dependent variables were checked for normality and homogeneity of variance. Alpha was set atp< 0.05.
An intra-class correlation coefficient (ICC) was calcu-lated to explore consistency within and between exam-iners for measurements with the original EOS images and the CT-generated DRRs. To evaluate intra-rater reliability, we compared the measurements obtained by two exam-iners who completed the EOS measurement training and had worked with these measurements for 3 years, and measured all the parameters of the 24 subjects twice with a 1-week interval. To evaluate inter-rater reliability, we compared the measurements obtained by the two exam-iners of all the parameters of the same 24 subjects in 1 week. An ICC value approaching 1.0 indicates less vari-ability, better consistency, and a value over 0.8 is consid-ered sufficiently reliable.
The values of all the alignment spinopelvic parameters were normally distributed, thus a paired-t-test was per-formed to compare between supine (CT-generated DRR) and standing (EOS) positions. Type I error (α), power (1-β), and post-hoc sample size for the statistical signifi-cance were calculated.
Results
Patient demographic data
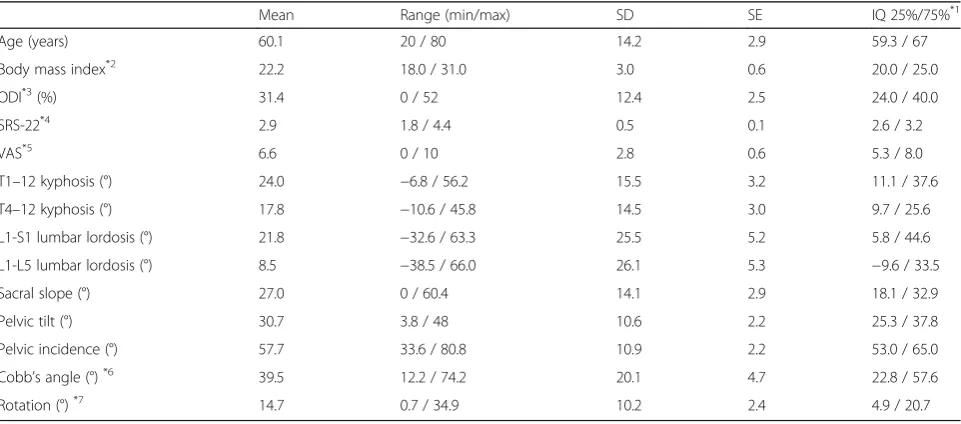
[image:5.595.58.539.462.674.2]Mean age and body mass index were 60.1 years (20–80) and 22.2 kg/m2 (18.0–31), respectively. Mean value with SD, SE, and 25%/75% interquartile range of all the demo-graphic and radiologic standard parameters are reported in Table 1. The mean ODI score was 31.4% (0–52%) and the mean SRS-22 (subtotal) score was 2.9 (1.8–4.4).
Table 1Demographics of the subject and spinal alignment parameters in standing position measured by EOS (24 women)
Mean Range (min/max) SD SE IQ 25%/75%*1
Age (years) 60.1 20 / 80 14.2 2.9 59.3 / 67
Body mass index*2 22.2 18.0 / 31.0 3.0 0.6 20.0 / 25.0
ODI*3(%) 31.4 0 / 52 12.4 2.5 24.0 / 40.0
SRS-22*4 2.9 1.8 / 4.4 0.5 0.1 2.6 / 3.2
VAS*5 6.6 0 / 10 2.8 0.6 5.3 / 8.0
T1–12 kyphosis (°) 24.0 −6.8 / 56.2 15.5 3.2 11.1 / 37.6
T4–12 kyphosis (°) 17.8 −10.6 / 45.8 14.5 3.0 9.7 / 25.6
L1-S1 lumbar lordosis (°) 21.8 −32.6 / 63.3 25.5 5.2 5.8 / 44.6
L1-L5 lumbar lordosis (°) 8.5 −38.5 / 66.0 26.1 5.3 −9.6 / 33.5
Sacral slope (°) 27.0 0 / 60.4 14.1 2.9 18.1 / 32.9
Pelvic tilt (°) 30.7 3.8 / 48 10.6 2.2 25.3 / 37.8
Pelvic incidence (°) 57.7 33.6 / 80.8 10.9 2.2 53.0 / 65.0
Cobb’s angle (°)*6 39.5 12.2 / 74.2 20.1 4.7 22.8 / 57.6
Rotation (°)*7 14.7 0.7 / 34.9 10.2 2.4 4.9 / 20.7
*1
Interquartile range, 25%/75% values *2
The body mass index was calculated as the weight in kilograms divided by the square of the height in meters (kg/m2 ) *3
The Oswestry Disability Index [12,13] *4
Scoliosis Research Society–22, subtotal [2,18] *5
Visual analog scale, 0 is no pain and 10 is most severe pain *6
Cobb’s angle of the major curve *7
Reliability of the measurements in the supine (CT-generated DRR) and standing (EOS) positions
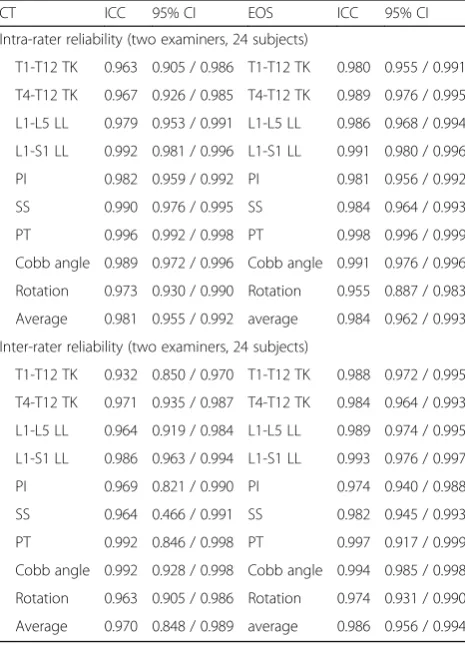
The mean ICCs of intra-rater reliabilities for supine and standing positions were 0.98 (0.96–1.00) and 0.98 (0.96– 1.00), respectively. The mean ICCs of inter-rater reliabilities for supine and standing positions were 0.97 (0.93–0.99) and 0.99 (0.97–1.00), respectively. Overall, the ICC data sug-gested excellent measurement consistency and reliability in both the standing and supine positions (Table2).
Comparison of spinal and pelvic parameters between the supine and standing positions
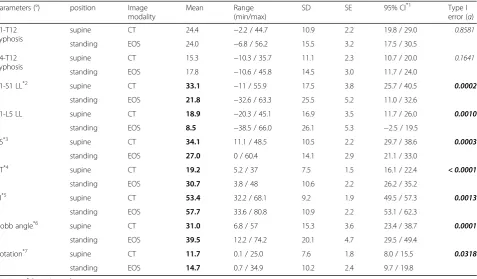
Thoracic kyphosis in the standing position was not different from that in the supine position (Table 3, Fig. 3). On the other hand, LL at both in L1-L5 and L1-S1 levels was signifi-cantly smaller in the standing position than in the supine position. This means that the lumbar spine is more kyphotic in the standing position than in the supine position.
With regard to pelvic alignment, SS was significantly smaller in the standing position than in the supine position. In contrast to the SS value, PT was significantly greater in the standing position than in the supine position. PI was
significantly greater in the standing position than in the su-pine position (Table3, Fig.3).
The Cobb and rotation angles of the major curve were significantly greater in the standing position than in the supine position. Statistical power was at least 0.8 in all parameters. Post hoc calculated sample size necessary for sufficient power was less than 24 for all parameters except for T1-T12 / T4-T12 kyphosis and Rotation.
Discussion
Adults with spinal deformities generally have a lower health-related quality of life. The present findings are con-sistent with findings of previous studies in that the patients in our population had poor low-back pain-related quality of life. Fairbank et al. [12] reported that the mean ODI score in a normal Caucasian population is 10.2. In addition, Tonosu et al. [27] reported that the mean ODI in a normal Japanese population is 8.73 (8.80 in men, 8.66 in women) when cor-rected for age, and a tendency for the ODI to gradually in-crease with advancing age. The mean ODI score in the present study (31.4%) was much greater than these values and mean SRS-22 score in our study (2.9) was lower than the normal value [5]. To clarify the pathology leading to the lower quality of life in patients with ASD, a precise compari-son of supine and standing measurements using the same modality and measurement method is needed.
The difference in curve magnitude between standing and supine positions was studied previously in AIS pa-tients. Keenan et al. [20] investigated the difference in the Cobb angle between the supine position (reconstructed CT) and standing position (conventional X-ray) in 52 pa-tients with AIS having a mean age of 14.6 years. They re-ported a mean Cobb angle on standing radiographs of 51.9°, which was a significantly greater value than the mean Cobb angle on supine CT images of 40.5° [20]. The Cobb angle measurement, however, includes a fundamen-tal error related to the selection of the vertebral endplates. In another study [24], spinal parameters were measured on 50 anteroposterior radiographs of scoliotic spines, on 6 separate occasions each by 4 orthopedic surgeons using the Cobb method; they reported that the 95% confidence limit for intraobserver variability was 4.9° and that for in-terobserver variability was 7.2°. Thus, due to the inherent inter- and intra-observer error in conventional X-ray mea-surements, it is difficult to conclude whether there are quantitative differences in the curve magnitude due to the positioning of the subjects.
[image:6.595.57.290.410.733.2]In the present study, we transformed the CT dataset (supine position images) into an EOS-like dataset with the DRR technique, which generates two-dimensional X-ray-like images using the same calibration parameters and geometry as the EOS cabin. The projected antero-posterior and lateral DRRs were used as inputs for routine-like EOS stereoradiographic spine modeling with Table 2Comparison of Intra-Class Correlation Coefficient (ICC)
and 95% confidential interval for all the parameters between supine (CT-based DRR) and standing (original EOS)
CT ICC 95% CI EOS ICC 95% CI
Intra-rater reliability (two examiners, 24 subjects)
T1-T12 TK 0.963 0.905 / 0.986 T1-T12 TK 0.980 0.955 / 0.991
T4-T12 TK 0.967 0.926 / 0.985 T4-T12 TK 0.989 0.976 / 0.995
L1-L5 LL 0.979 0.953 / 0.991 L1-L5 LL 0.986 0.968 / 0.994
L1-S1 LL 0.992 0.981 / 0.996 L1-S1 LL 0.991 0.980 / 0.996
PI 0.982 0.959 / 0.992 PI 0.981 0.956 / 0.992
SS 0.990 0.976 / 0.995 SS 0.984 0.964 / 0.993
PT 0.996 0.992 / 0.998 PT 0.998 0.996 / 0.999
Cobb angle 0.989 0.972 / 0.996 Cobb angle 0.991 0.976 / 0.996
Rotation 0.973 0.930 / 0.990 Rotation 0.955 0.887 / 0.983
Average 0.981 0.955 / 0.992 average 0.984 0.962 / 0.993
Inter-rater reliability (two examiners, 24 subjects)
T1-T12 TK 0.932 0.850 / 0.970 T1-T12 TK 0.988 0.972 / 0.995
T4-T12 TK 0.971 0.935 / 0.987 T4-T12 TK 0.984 0.964 / 0.993
L1-L5 LL 0.964 0.919 / 0.984 L1-L5 LL 0.989 0.974 / 0.995
L1-S1 LL 0.986 0.963 / 0.994 L1-S1 LL 0.993 0.976 / 0.997
PI 0.969 0.821 / 0.990 PI 0.974 0.940 / 0.988
SS 0.964 0.466 / 0.991 SS 0.982 0.945 / 0.993
PT 0.992 0.846 / 0.998 PT 0.997 0.917 / 0.999
Cobb angle 0.992 0.928 / 0.998 Cobb angle 0.994 0.985 / 0.998
Rotation 0.963 0.905 / 0.986 Rotation 0.974 0.931 / 0.990
Table 3Comparison of the values of standard parameters between supine (CT-generated DRR) and standing (original EOS) positions by paired t-test
Parameters (°) position Image
modality
Mean Range
(min/max)
SD SE 95% CI*1 Type I
error (α)
T1-T12 kyphosis
supine CT 24.4 −2.2 / 44.7 10.9 2.2 19.8 / 29.0 0.8581
standing EOS 24.0 −6.8 / 56.2 15.5 3.2 17.5 / 30.5
T4-T12 kyphosis
supine CT 15.3 −10.3 / 35.7 11.1 2.3 10.7 / 20.0 0.1641
standing EOS 17.8 −10.6 / 45.8 14.5 3.0 11.7 / 24.0
L1-S1 LL*2 supine CT 33.1 −11 / 55.9 17.5 3.8 25.7 / 40.5 0.0002
standing EOS 21.8 −32.6 / 63.3 25.5 5.2 11.0 / 32.6
L1-L5 LL supine CT 18.9 −20.3 / 45.1 16.9 3.5 11.7 / 26.0 0.0010
standing EOS 8.5 −38.5 / 66.0 26.1 5.3 −2.5 / 19.5
SS*3
supine CT 34.1 11.1 / 48.5 10.5 2.2 29.7 / 38.6 0.0003
standing EOS 27.0 0 / 60.4 14.1 2.9 21.1 / 33.0
PT*4 supine CT 19.2 5.2 / 37 7.5 1.5 16.1 / 22.4 < 0.0001
standing EOS 30.7 3.8 / 48 10.6 2.2 26.2 / 35.2
PI*5 supine CT 53.4 32.2 / 68.1 9.2 1.9 49.5 / 57.3 0.0013
standing EOS 57.7 33.6 / 80.8 10.9 2.2 53.1 / 62.3
Cobb angle*6 supine CT 31.0 6.8 / 57 15.3 3.6 23.4 / 38.7 0.0001
standing EOS 39.5 12.2 / 74.2 20.1 4.7 29.5 / 49.4
Rotation*7 supine CT 11.7 0.1 / 25.0 7.6 1.8 8.0 / 15.5 0.0318
standing EOS 14.7 0.7 / 34.9 10.2 2.4 9.7 / 19.8
*1
95% confidence interval *2
Lumbar lordosis *3
Sacral slope *4
Pelvic tilt *5
Pelvic incidence *6
Cobb’s angle of major curve (°) *7
Vertebral rotation of the apex in the major curve (°)
Mean values with bold letters indicate statistically significance (p< 0.05) between supine (CT) and standing (EOS)
[image:7.595.58.540.517.702.2]sterEOS software. The EOS data (standing position) and the CT-generated DRRs (supine position) were then com-pared. In the present study, we confirmed the reliability of this comparison method using repeatability tests with ICC in the 24 subjects, and found that the ICCs were excellent in all the values, both in CT-generated DRRs and EOS measurements. Thus, the inherent error due to measure-ment and different imaging modalities was overcome by the comparison with the EOS 3D measurement system.
In adult-to-elderly patients with spinal deformity, sagittal malalignment is more important than coronal alignment [14]. In contrast to AIS, adult-to-elderly patients with spinal deformity complain that they tend to stoop with back pain or radicular pain of the lower extremities, and the symptoms disappear when they lie down. Therefore, the positional change of the 3D whole spine alignment should be clarified, especially in aging adults. In the present study with patients having a mean age of 60.1 years, the Cobb angle and Rotation angle of the major curve, mostly the thoracolumbar area, were significantly greater in the standing position than in the supine position. Lumbar lor-dosis in the standing position was significantly more ky-photic and the pelvis was significantly more retroverted, with a smaller SS and greater PT, compared with that in the supine position. The axial skeleton of human beings is aligned as a chain of balance in the standing position with the “cone of economy” in healthy subjects [8]. The
standing full-body sagittal alignment and balance in refer-ence to the gravity line were recently described in a healthy adult population using EOS radiographs [17]. The results of the present study suggest that the “cone of economy” principle deteriorates in patients with spinal deformity, making it difficult to maintain the standing position due to back pain with or without radicular pain.
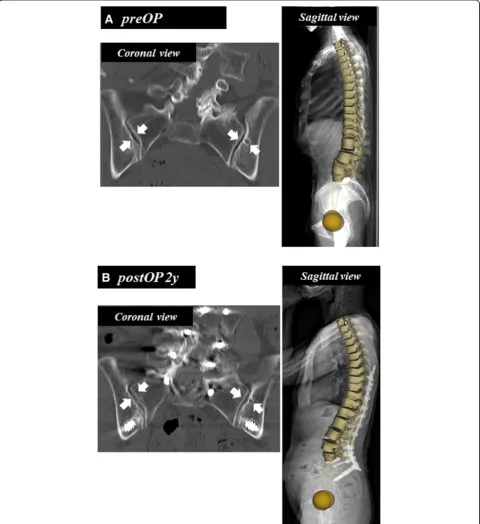
PI is a fundamental parameter for spinopelvic standing alignment [10, 11, 22], and is believed to be a constant value in each individual. The value was, however, signifi-cantly greater in the standing position than in the supine position. Mangion et al. [23] measured PI on radiographs of 30 fetuses, 30 children, and 30 adults, and found that PI considerably increases during the first few months of life, continues to increase during the early years, and stabilizes at around the age of 10 years. In our previous study [16], PI was positively correlated with age, even in healthy adult subjects. PI increased around 10° on average from 20 to 70 years of age, probably due to sacroiliac osteoarthritis [16]. This finding is compatible with a previous review article on sagittal pelvic alignment parameters, which described that PI tends to increase with age in both normal and scoliotic subjects [29]. In the present study, we demon-strated a significant difference in PI between the supine and standing positions. The reconstructed coronal CT image of a case with degenerative kyphoscoliosis (Fig.4a) shows osteoarthritis of the sacroiliac joint with a vacuum
[image:8.595.59.538.420.704.2]phenomenon, subchondral osteosclerosis, and cyst forma-tion (Fig. 5a). The preoperative PI was 57.1° in standing EOS (49.8° in supine CT) and the PI decreased to 50.2° in standing EOS (52.2° in supine CT) following spinopelvic correction surgery with bilateral S2 alar-iliac fixations
(Fig. 4b) [25]. Furthermore, the vacuum in the sacroiliac joint disappeared and the cyst became smaller after sur-gery as a result of fixation by the screws stabilizing the sacroiliac joints (Fig.5b). Sacroiliac joints are the only sites that can move between the base of the sacrum and the
Fig. 5Reconstructive coronal reconstructed CT images of bilateral sacro-iliac joints and corresponding EOS images of the patient (Figs.2and4).
[image:9.595.58.539.167.692.2]acetabulum, thereby affecting the PI value. Therefore, our data suggest that the sacroiliac joint moves abnormally due to osteoarthritic changes in ASD cases, leading to changes in the PI between the supine and standing posi-tions. The high ICC for both the supine and standing position values suggests that the difference is a true differ-ence, and not due to measurement variability. PI is consid-ered a set characteristic of the individual spinopelvic shape, but it can change due to degenerative processes of the spine. Thus, it is important to remember that the aging and degenerative processes affect the whole spino-pelvic alignment and balance in reference to patient positioning.
The findings in the present study offer a basic path-ology of ASD with positional change in thoraco-lumbar to pelvic alignment, suggesting that a main focus of the correction and fusion surgery is the lumbar to pelvic area and further extension of the fusion to upper thor-acic area is not necessary. Furthermore, we believe that the results contribute not only for spine surgeons but also for the professionals involved in the conservative management of patients with back pain and spine de-formities by keeping in mind the sagittal spinopelvic profile in the supine position which could represent a starting point. Potential limitations of this study are, however, the wide age range of the patients but relatively small sample size. Aging and spondylotic change affect the spino-pelvic flexibility. Thus, although the results in the present study is statistically accurate, we need to continue the investigation with further sample size.
Conclusion
We established a method for comparing spinopelvic align-ment between the supine and standing positions by con-verting CT DICOM data into an EOS-like dataset, a DRR technique. Comparison revealed that the Cobb angle and axial apical rotation of the major curve, mostly in the thoracolumbar area, were significantly greater in the standing position than in the supine position. Lumbar lor-dosis in the standing–weight-bearing–position was sig-nificantly less lordotic and the pelvis was sigsig-nificantly more retroverted, with a smaller SS, greater PT, and even greater PI, compared with that in the supine position.
Abbreviations
AIS:Adolescent idiopathic scoliosis; ASD: Adult spinal deformity; Cobb angle: The Cobb angle of the major curve; CT: Computed tomography; DRR: Digitally reconstructed radiograph; ICC: Intra-class correlation coefficient; LL: Lumbar lordosis; MRI: Magnetic resonance image; ODI: Oswestry disability index; PI: Pelvic incidence; PT: Pelvic tilt; Rotation: The apical vertebral rotation in the major curve; SD: Standard deviation; SE: Standard error; SRS-22: Scoliosis Research Society-22 score; SS: Sacral slope
Acknowledgments
The authors are deeply grateful to the great mentor, Prof. Jean Dubousset (Académie Nationale de Médecine, Paris, France), for his thoughtful advice.
Funding
None of the authors has received any grant or financial support for the present study.
Availability of data and materials
The datasets supporting the conclusions of this article are included within the article. The raw data underlying the conclusions made in this study can be inquired to the first author.
Authors’contributions
KH: Protocol/project development, Data analysis, Manuscript writing/editing. MO: Data collection and management, Data analysis. SH: Data collection and management, Data analysis. GC: Data analysis, Manuscript editing. KW: Protocol/project development, Manuscript editing. All authors read and approved the final manuscript.
Ethics approval and consent to participate
All procedures performed in studies involving human participants were in accordance with the ethical standards of the institutional research committee and with the 1964 Helsinki declaration and its later amendments or comparable ethical standards.
The present study was reviewed by the institutional review board and approved before starting the research (Approval number 2, 27th Dec., 2013, Institutional Review Board of Kameda Daiichi Hospital, Niigata, Japan). All the images used in this article were completed following obtaining a written informed consent from each participant.
Consent for publication
Not applicable.
Competing interests
The authors declares that they have no competing interests.
Publisher’s Note
Springer Nature remains neutral with regard to jurisdictional claims in published maps and institutional affiliations.
Author details
1Niigata Spine Surgery Center, 2-5-22 Nishi-machi, Niigata City 950-0165,
Japan.2EOS imaging, Paris, France.3Department of Orthopaedic Surgery, Niigata University Medical and Dental Hospital, Niigata, Japan.
Received: 2 November 2017 Accepted: 22 November 2018
References
1. Adam C, Izatt M, Askin G. Design and evaluation of an MRI compatible axial compression device for 3D assessment of spinal deformity and flexibility in AIS. Stud Health Technol Inform. 2010;158:38–43.
2. Asher M, Lai SM, Burton D, et al. The reliability and concurrent validity of the Scoliosis Research Society-22 patient questionnaire for idiopathic scoliosis. Spine. 2003;28:63–9.
3. Carreau JH, Bastrom T, Petcharaporn M, et al. Computer-generated, three-dimensional spine model from biplanar radiographs: a validity study in idiopathic scoliosis curves greater than 50 degrees. Spine Deformity. 2014;2:81–8.
4. Cobb J. Outline for the study of scoliosis. Instr Course Lect. 1948;5:261–75. 5. Daubs MD, Hung M, Neese A, et al. Scoliosis Research Society-22 results in
3052 healthy adolescents aged 10 to 19 years. Spine. 2014;39:826–32. 6. Delin C, Silvera S, Bassinet C, et al. Ionizing radiation doses during lower
limb torsion and anteversion measurements by EOS stereoradiography and computed tomography. Eur J Radiol. 2014;83:371–7.
7. Deschenes S, Charron G, Beaudoin G, et al. Diagnostic imaging of spinal deformities: reducing patients radiation dose with a new slot-scanning X-ray imager. Spine. 2010;35:989–94.
8. Dubousset J. Three-dimensional analysis of the scoliotic deformity. In: Weinstein SL, editor. Pediatric spine: principles and practice. New York: Raven Press; 1994. p. 479–83.
10. Duval-Beaupère G, Schmidt C, Cosson PH. A Barycentremetric study of the sagittal shape of spine and pelvis: the conditions required for an economic standing position. Ann Biomed Eng. 1992;20:451–62.
11. Duval-Beaupère G, Legaye J. Composante sagittale de la statique rachidienne. Rev Rhumatisme. 2004;71:105–19.
12. Fairbank JCT, Pynsent PB. The Oswestry disability index. Spine. 2000;25: 2940–53.
13. Fujiwara A, Kobayashi N, Saiki K, et al. Association of the Japanese Orthopaedic Association Score with the Oswestry disability index, Roland-Morris disability questionnaire, and short-form 36. Spine. 2003;28:1601–7. 14. Glassman SD, Bridwell K, Dimar J, et al. The impact of positive sagittal
balance in adult spinal deformity. Spine. 2005;30:2024–9. 15. Glaser DA, Doan J, Newton PO. Comparison of 3-dimensional spinal
reconstruction accuracy. Spine. 2012;37:1391–7.
16. Hasegawa K, Okamoto M, Hatsushikano S, et al. Normative values of spino-pelvic sagittal alignment, balance, and health-related quality of life in relation to age in a cohort of healthy adult subjects. Eur Spine J. 2016;25:3675–86. 17. Hasegawa K, Okamoto M, Hatsushikano S, et al. Standing sagittal alignment
of the whole axial skeleton in reference to the gravity line in humans. J Anat. 2017;230:619–30.https://doi.org/10.1111/joa.12586.
18. Hashimoto H, Sase T, Arai Y, et al. Validation of a Japanese version of the Scoliosis Research Society-22 patient questionnaire among idiopathic scoliosis patients in Japan. Spine. 2007;32:E141–6.
19. Hui SC, Pialasse JP, Wong JY, et al. Radiation dose of digital radiography (DR) versus micro-dose x-ray (EOS) on patients with adolescent idiopathic scoliosis: 2016 SOSORT- IRSSD“John Sevastic award”winner in imaging research. Scoliosis Spinal Disord. 2016;11:46.
20. Keenan BE, Izatt MT, Askin GN, et al. Supine to standing cobb angle change in idiopathic scoliosis: the effect of endplate pre-selection. Scoliosis. 2014;9:16. 21. Lee MC, Solomito M, Patel A. Supine magnetic resonance imaging cobb measurements for idiopathic scoliosis are linearly related to measurements from standing plain radiographs. Spine. 2013;38:E656–61.
22. Legaye J, Duval-Beaupere G, Hecquet J, et al. Pelvic incidence: a fundamental pelvic parameter for three-dimensional regulation of spinal sagittal curves. Eur Spine J. 1998;7:99–103.
23. Mangione P, Gomez D, Senegas J. Study of the course of incidence angle during growth. Eur Spine J. 1997;6:163–7.
24. Morrissy RT, Goldsmith GS, Hall EC, et al. Measurement of the cobb angle on radiographs of patients who have scoliosis. Evaluation of intrinsic error. J Bone Joint Surg Am. 1990;72:320–7.
25. O’Brien JR, Yu WD, Bhatnagar R, et al. An anatomic study of the S2 iliac technique for lumbopelvic screw placement. Spine. 2009;34:E439–42. 26. Simon AL, Ferrero E, Noelle Larson A, et al. Stereoradiography imaging motion
artifact: does it affect radiographic measures after spinal instrumentation? Eur Spine J. 2016.https://doi.org/10.1007/s00586-016-4462-z.
27. Tonosu J, Takeshita K, Hara N, et al. The normative score and the cut-off value of the Oswestry disability index (ODI). Eur Spine J. 2012;21:1596–602. 28. Torell G, Nachemson A, Haderspeck-Grib K, et al. Standing and supine cobb
measures in girls with idiopathic scoliosis. Spine. 1985;10:425–7. 29. Vrtovec T, Janssen MMA, Likar B, et al. A review of methods for evaluating
the quantitative parameters of sagittal pelvic alignment. Spine J. 2012;12: 433–46.