2019 International Conference on Artificial Intelligence and Computing Science (ICAICS 2019) ISBN: 978-1-60595-615-2
Fan Noise Control and Heat Dissipation Optimization of Commercial
Vehicle Cooling System
Rong-jiang TANG
1, Miao ZHANG
1,*, Bin-fei HU
1and Zeng-jun LU
21School of Mechanical and Electrical Engineering, Guilin University of Electronic Technology, Guilin 541004, China
2Dongfeng Liuzhou Motor Co. LTD, Liuzhou 545005, P.R. China
*Corresponding author
Keywords: Engine compartment, Noise of fan reduction, Computational fluid dynamics, Experimental test.
Abstract. Aiming at the problem of matching fan noise and heat dissipation in a commercial vehicle cooling system, it is proposed to reduce noise by changing the fan structure and to increase the windshield to block the hot air reflux. By changing the number of blades, wheel hub ratio, blade bending angle fan performance parameters, and the cooling fan mass flow rate and aerodynamic noise were simulated by CFD, the fan performance parameters were optimized. Then, the flow field and temperature field of engine cabin are analyzed. According to the analysis, the hot air reflux exists in the radiator, and the baffle is added to the upper part of the radiator and to the left and right sides of the radiator to block the reflux. The results show that the fan noise is reduced by 2.7 dB and the maximum temperature in the engine cabin is reduced from 417k to 392k.
Introduction
In recent years, with the increase of engine power and the compactness and complexity of front cabin parts arrangement, in order to meet the requirement of engine front cabin heat dissipation, the engine cooling fan load increases and the speed increases [1]. With the increase of the speed of the cooling fan, the noise will increase obviously and become one of the main sources of vehicle noise [2], and the ride comfort of the occupants will be greatly reduced. Therefore, on the basis of ensuring that the cooling fan meets the basic aerodynamic performance requirements, reducing the aerodynamic noise has become a new research hotspot.
In this paper, the cooling fan of a commercial vehicle is studied. The fan noise is reduced by changing the blade number, wheel hub ratio and bending angle of the fan. The flow field of the engine cabin is analyzed, the local flow “dead zone” caused by the reflux of the heat flow in the engine room is reduced by adding the windshield, and the heat dissipation inside the cabin is improved, which makes the whole vehicle achieve the optimal effect.
Test and Simulation of Fan Noise
Noise Testing
When a commercial vehicle fan is rotating, a large noise is generated, which seriously affects the performance of the whole vehicle of the commercial vehicle, and the noise at the front part of the fan is measured at a gear of 4 gear and an engine speed of 2250 r/ min, and the overall noise of the fan at this position is 82.2dB (A). Much higher than other aspects of the commercial vehicle.
Fan noise is generated by fan rotation, mainly by air turbulence generated by the fan blade cutting air or by the components behind the fan, by changing the blade diameter, number, wheel hub ratio, Both shape and shape can reduce fan noise[3].
Simulation Calculation of Prototype Fan
Fundamental Theory. Fluid flow must be controlled by the conservation laws of physics, which must satisfy the conservation laws of mass, momentum and energy [4]. Since the Mach number of air flowing through the cooling fan is less than 0.3, air can be treated as an incompressible fluid. The Reynolds number in fluid domain Re=8.3×10⁶ is far larger than the critical value of turbulent
Reynolds number, so it can be determined that the flow state is turbulent, and the k−ε turbulence
model is used to deal with the engine room model.
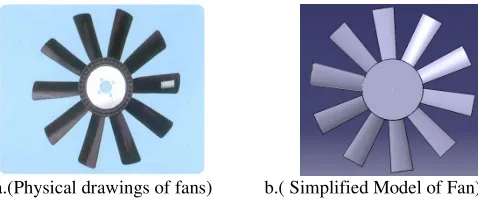
Simplification of Model. The engine cooling fan used in a commercial vehicle introduced in this paper, such as figure 1, simplifies the prototype fan without affecting the performance of the fan. Only when the digital model is the same as the physical size, can the simulation result be more accurate. The fan is modeled by CAD software such as figure 1(b). The diameter of the fan is 625mm, the diameter of hub is 231mm, and the ratio of hub to hub is 0.37mm.
[image:2.612.187.426.247.348.2]
a.(Physical drawings of fans) b.( Simplified Model of Fan)
Figure 1. Physical objects and simplified diagrams of fans.
CFD Simulation. The fan simulation is a complete simulation of the fan bench experiment, and the corresponding area size is drawn according to the test channel of the test bench. The whole calculation model consists of four parts: import region, outlet region, rotating fluid region and pipeline region. Considering the variation of flow field in different regions of the engine cooling fan simulation model, the method of partition grid is adopted. The mesh size in the rotating fluid region is smaller, the grid size in the pipeline region is slightly larger, and the grid in the inlet and outlet regions is the largest. Where the gradient is large, for example, the fan blade edge is encrypted to ensure mesh accuracy. The mesh division between the flow zone and the rotating fluid region is shown in Figure 2 and Figure 3.
[image:2.612.98.515.502.625.2]
Figure 2. Computational domain. Figure 3. Local meshes in the region of rotating fluid.
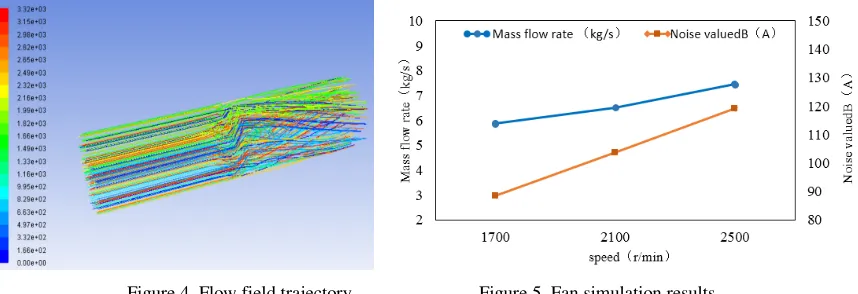
Figure 4. Flow field trajectory. Figure 5. Fan simulation results.
In this paper, the effects of blade number, wheel hub ratio and blade bending angle on fan noise and mass flow rate are discussed. By setting the fan speed as the rated value of 2100r/min, the noise at the 1mm level in the center of the entrance area and the flow data of the monitoring surface of the exit section are analyzed, and the influence of each parameter on the fan is compared. Based on the results of the analysis, the optimization scheme is further proposed.
Optimization and Improvement of Cooling Fan
In this paper, the effects of blade number, wheel hub ratio and blade bending angle on fan noise and mass flow rate are discussed. By setting the fan speed as the rated value of 2100r/min, the noise at the 1mm level in the center of the entrance area and the flow data of the monitoring surface of the exit section are analyzed, and the influence of each parameter on the fan is compared. Based on the results of the analysis, the optimization scheme is further proposed.
Effect of Leaf Number
The number of original blades is 10 blades. The influence of the number of blades on the performance of fan is analyzed by changing the number of blades. Figure 6 shows that the mass flow rate and noise increase with the increase of blade, and the 101.51dB (A), mass flow rate of 9 blades is not different from that of the original fan. In this study, 9 blade fan was selected.
Influence of Wheel Hub Ratio
The initial fan hub ratio is 0.37. Figure 7 shows that the mass flow rate decreases with the increase of hub ratio. When the hub ratio is 0.42, the lowest noise value is 100.98dB (A), mass flow rate of 5.25 kg/s, which is only 0.62kg/s lower than that of the original fan. The final selection of wheel hub ratio in this study is 0.42.
Influence of Blade Shape
Figure 6. Effect of leaf number. Figure 7. Influence of wheel hub ratio. Figure 8. Influence of blade shape.
Optimization of Fan Parameters
According to the above analysis, the optimum selection parameters of the fan are as follows: the number of blades is 9 blades, the wheel hub ratio is 0.42, and the blade bending angle is 45°. The optimized fan is recorded as X1 fan and simulated, and the measured points are compared in 2100r/min state.
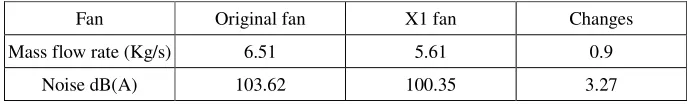
Table 1. Comparison of the mass flow rate and noise of the original fan and the X1 fan.
Fan Original fan X1 fan Changes
Mass flow rate (Kg/s) 6.51 5.61 0.9
Noise dB(A) 103.62 100.35 3.27
As shown in Table 1, the noise of the X1 fan is 3.27dB (A). Lower than that of the original fan for 100.35dB (A), But the mass flow rate was 0.9 kg/s lower than that of the original fan. It is necessary to further analyze the flow field and temperature field of engine cabin because of its influence on engine cabin heat dissipation to some extent.
Study on Heat Dissipation Performance of Engine Cabin
The mass flow rate of the optimized cooling fan is reduced, which will affect the heat dissipation in the engine cabin. Considering the heat dissipation requirement in the cabin, the air flow and heat dissipation in the engine cabin are analyzed, and the temperature field and flow field in the cabin are calculated.
Physical Model
On the premise of reflecting the true flow characteristics in the engine compartment, the engine compartment of the vehicle is properly simplified, with only the cooling system (including intercooler, condenser and radiator), fan, engine, transmission, clutch, accessory to subframe and engine compartment[5]. The simplified CFD simulation model of engine cabin is shown in figure 9.
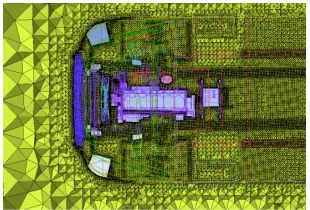
Grid Partitioning of Computational Area
[image:4.612.133.481.286.338.2]
Figure 9. Simplified CFD Simulation Model for engine Cabin. Figure 10. Engine compartment partial mesh.
Simulation Parameter Setting
Combined with the experimental data, the inlet wind speed of 25 km/h, turbulence intensity is set to 0.01, the ambient temperature is set to 303k. The outlet relative pressure is zero, and the exit turbulence intensity is consistent with the inlet. The intercooler and radiator are set as porous media, and the resistance coefficients are calculated and set as volume heat source according to the experimental data. The fan adopts MRF implicit algorithm with a speed of 1500 r/min.
[image:5.612.131.299.66.170.2]CFD Simulation Analysis
Figure 11 and figure 12 show the cross-section temperature cloud diagram of the original vehicle and the X1 sample car. From the diagram, it can be seen that the main heat source is the radiator group, and the heat flow is introduced into the engine cabin under the action of the fan. After the cooling fan is replaced, it can be seen that the temperature inside the engine compartment is higher than that of the original car. It can be seen that the temperature of the air flow into the radiator is 303k. After passing through the radiator and the intercooler, the temperature of the air flow induced by the rotating fan is 379m 392k. And the temperature derived from the X1 prototype is about 392kg. Exceed the optimum operating temperature of plastic parts in the cabin.
[image:5.612.79.531.507.606.2]Figure 13 is a 3D flow field diagram using a flow line in an X1 fan engine compartment. As shown in the figure, after the high-speed air flow passes through the cooling system, the engine body is guided to the rear of the vehicle, and the field in the whole engine compartment is relatively smooth. The negative pressure area is in the front of the radiator, the heat flow from the cooling fan flows back to the cooling system from the upper part and the two sides of the radiator, and the heat dissipation efficiency of the cooling system is seriously affected.
Figure.11 Original vehicle state. Figure.12 X1 prototype. Figure.13 Cabin flow field line.
Optimized Scheme
[image:6.612.189.441.65.178.2]
a. Pre-optimization model b.Optimized model
Figure 14. Installation of windshield.
Optimization Result Analysis
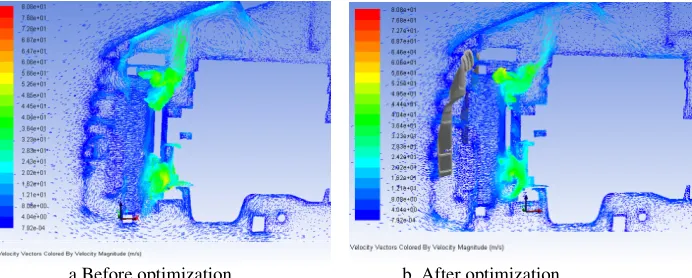
You can see the velocity vector diagram before and after installing the windshield, as shown in figure 15. Before the improvement, the heat flow is induced by the cooling fan, and then reflows back to the radiator along the engine hatch, resulting in circulating heating. After the improvement, the gap between the cooling tank and the hatch was successfully sealed by the insulation board, and the reflux heat flow was blocked, and the air flow density from the radiator increased obviously, and the heat dissipation efficiency was improved.
a.Before optimization b. After optimization
Figure 15. Section velocity distribution.
Experimental Verification
Noise Experiment
Noise test is carried out on the sample vehicle with the X1 fan, and the noise at the front 0.5mm of the fan is tested when the gear is 4 gear and the engine speed is 2250r/min. The result of the test is 83.5dB (A), which is 2.7dB (A) lower than that of the original fan.
Heat Balance Test
The vehicle-like vehicle with the X1 fan is matched, and the improvement measures for installing the wind deflector are adopted, and the temperature change of the engine compartment is verified by the experiment. The test status is as follows: in the maximum torque state of the engine (the rotation speed is 1500r/min), the real vehicle is fully loaded, the vehicle is in the third gear and is kept at 25km/h, and the real car test of 25 min is carried out at the ambient temperature of 30°C.
[image:6.612.141.487.317.456.2]
Figure 16. Measuring point position. Figure 17. Layout of the sensor.
[image:7.612.195.431.234.379.2]As shown in figure 18, the measured points are compared with the corresponding simulation values after installing the windshield. Compared with the measured value, the error of the simulation value is less than 10%, and the accuracy of the simulation result is high.
Figure 18. Comparison of measured and simulated temperatures.
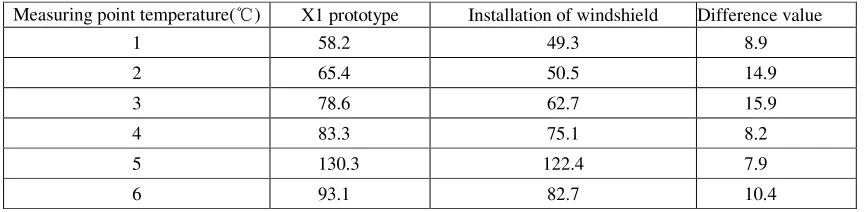
Table 2. Comparison of temperature values before and after optimization.
Measuring point temperature(℃) X1 prototype Installation of windshield Difference value
1 58.2 49.3 8.9
2 65.4 50.5 14.9
3 78.6 62.7 15.9
4 83.3 75.1 8.2
5 130.3 122.4 7.9
6 93.1 82.7 10.4
It can be seen from Table 2 that, under the maximum torque condition, the optimized commercial vehicle has a decrease in the temperature of each measuring point compared to the X1 sample vehicle. The inlet and outlet water temperature of the X1-sample vehicle was 78.6℃ and 83.3℃ respectively. The temperature difference was 4.7℃. The water temperature of the inlet and outlet after the optimization was 62.7℃ and 75.1℃, the temperature difference was 12.4℃, and the temperature difference was 7 ℃. The inlet and outlet gas of the air cooler in the X1-sample vehicle is respectively 65.4C and 130.3℃, and the temperature difference is 64.9℃. The temperature difference of the air cooler after the optimization is 50.5℃ and 122.4℃, the temperature difference is 71.9℃, and the temperature difference is 7.7℃. So that the cooling efficiency of the radiator and the intercooler after the wind shield is installed is obviously improved.
Summary
[image:7.612.84.516.425.531.2]and after optimization was tested, and the noise of matching X1 fan was reduced to 83.5dB (A), after matching. Compared with the original fan, the 2.7dB (A). Of commercial vehicle was decreased. The heat balance test shows that the radiator temperature is increased by 7℃, the intercooler heat dissipation temperature is increased by 7.7℃, and the efficiency of radiator and intercooler is improved obviously.
Acknowledgement
The research was funded by the Liuzhou City Scientific Research and Planning Development Project (2018AA20301).
References
[1] Anthony Gérard, Stéphane Moreau, Berry A, et al. Design of multi-modal obstruction to control tonal fan noise using modulation principles [J]. Journal of Sound & Vibration, 2015, 356: 34-47. Reference to a book:
[2] Xiaomin L., Jia Z., Dian Li. Noise Reduction Mechanism of Single-Arc Bionic Blade with Wave Shape Leading Edge Coupled with Serrated Trailing Edge [J]. Journal of Xian Jiaotong University, 2015, 49(3):1-10.
[3] Gao Yali, Xu Jingjing, Cai Xiangru, Sun Yuehui. Effect of engine cooling Fan on Vibration and noise in vehicle [J]. Internal Combustion engine Engineering, 2015N 36 (01): 53-56.
[4] Yu Weijing, Zhang Yingchao, Ren Linlin, Su Chang. Simulation of intermittent cross-wind aerodynamic characteristics of heavy commercial vehicles [J]. Automotive Engineering, 2017 (04): 407-411.