© 2016, IRJET ISO 9001:2008 Certified Journal
Page 925
Correlation and Evaluation of Permanent Volumetric Deformation of
Plastic Components Using Different Material Models of LS-Dyna
Ravikant Bellundagi
1, Prof. S. A. Janawade
21Student, Dept of Mechanical Engineering, KLE Dr. M. S. Sheshgiri College of Engg & Tech Belagavi, Karnataka, India 2Professor, Dept of Mechanical Engineering, KLE Dr. M. S. Sheshgiri College of Engg & Tech Belagavi, Karnataka, India
---***---Abstract –
The modes of failure are generally classified as slow crack growth (SCG) and rapid crack propagation (RCP), are the two main phenomena responsible for the decreasing the life of the components. Now days in most of the industries the polymers having the importance for the automotive applications, Washing machine components etc. The present paper shows the simulation of crazing behavior of polymers at the time of plastic loading conditions. Crazing is usually defined as the deformation of the component with the increase in volume. This is one of the important issues to be considered in the analysis. For this type of study we have developed the material model 187 (i.e. MAT_SAMP-1) in LS-Dyna has been introduced. This material model clears about the crazing. This paper also discusses about the effect of crazing in real world problems and also prediction of the material card which shows clearly the crazing behavior. The results are obtained in Hypermesh and LS-DYNA and for validation purpose the Three Point bending test is used.Key Words: Crazing, MAT_24, MAT_187, Three Point
Bending test, Force Vs Displacement plot, Load curve data and LS-DYNA.
1. INTRODUCTION
The failure modes are generally classified as slow crack growth and rapid crack propagation, which plays an important role in predicting the life of a mechanical component. A polymer may fails either through the deformation without the change of volume is known as shear or the deformation with the increase in volume is known as crazing. The Figure-1 shows the clear idea about the Formation of crazing.
Figure1 - Formation of Crazing.
The crazing is usually a permanent volumetric deformation with the increase in volume and is usually occurs at higher stresses. In order to reduce the crazing to some amount the toughness of the component has to be increased. Toughness may be defined as the energy absorbed in a mechanical test or in fracture mechanics it is defined as the resistance to the crack propagation.
In this paper we have taken the under base of the washing machine and shown the crazing behavior using the two different material cards such as MAT_24 & MAT_187. For the component, PP and ABS materials are used. And for the showing the crazing, the material which shows the clear phenomena had been selected.
1.1 Problem Statement
The most of the components will fails through the initiation of slow crack growth and it becomes the rapid crack propagation. Thus it is very important to capture the effect of mechanism underlying the failure of the component i.e. crazing. The problem here is to capture the crazing behavior using the MAT_24 card, and the obtained results of Force Vs Displacement are not matching. And find the alternative way to find the capturing of the crazing behavior.
1.2 Objective Statement
The main objective of this project is to capture the effect of crazing behavior using different material models of LS-DYNA (i.e. MAT_024 & MAT_187) and also correlate the results of both the material models of LS-DYNA and choose the suitable one. The main objective of this study is to show the real world effect of crazing in the mechanical components using the LS-DYNA material models and validate the same using the three point bending test.
2. METHODOLOGY
© 2016, IRJET ISO 9001:2008 Certified Journal
Page 926
3. THREE POINT BENDING TEST
Figure-2: Three Point Bending Test
The three point bending test is also known as the flexure test, from which we will able to calculate the materials Modulus of Elasticity in Bending (Eb), Bending stress (b), Bending strain (b) and the bending stress-strain relation of the material. The one of the main advantage of three point bending test is in specimen preparation and testing. The Bending modulus is defined as the ratio of stress to strain in a material to be bent. The bending modulus is determined from the slope of stress-strain curve obtained from the test. Above Figure-2 shows the same.
3.1 Why Three Point Bending Test?
A three point bending test produces the tensile stress on the convex side and compressive on the concave side of a specimen, Due to which there is a creation of an area of shear in the midline of the specimen. In order to confirm the failures either due to tensile or compression tests, the shear stress must be reduced.
4. LS-DYNA MATERIAL MODELS
Mainly there are two material models used in this project for the simulation of crazing behavior of plastics. They are, MAT_24 (Piecewise linear plasticity) & MAT_187 (SAMP-1).
4.1 MAT_024 (MAT_Piecewise_Linear_Plasticity)
This is the Material type is 024 and is a most widely used elasto-plastic material with which stress versus strain curve can be defined.
The details of this card are given below.
4.2 MAT_187 (SAMP-1)
This is the Material card type of 187 and is specially used for the polymers. This is the newly designed Material card in Ls-Dyna for the simulation of the plastics and polymers.
The detailed descriptions above card variables are described as follows.
5. GEOMETRIC MODELLING
In order to carry out any CAE analysis on the component, the solid model of that component is necessary. The required solid model is created using the modeling software’s such as CATIA, Pro-E, and SOLID EDGE. The Figure-3 shows the under base of a semi-automatic washing machine.
© 2016, IRJET ISO 9001:2008 Certified Journal
Page 927
6. FINITE ELEMENT MODELING
[image:3.595.328.537.134.350.2]In order to develop the FE model, first we have to create the geometric model of that component using modeling software’s such as Pro-E, CATIA, and SOLID EDGE etc. The meshing involves the 2D and 3D meshing such as shell meshing, plastic meshing using the quad and tri-angular elements. A quality check should be carried out considering the Warpage, Skewness, Tetra collapse etc. The Figure-4 shows the meshed model of the under base component.
[image:3.595.63.258.235.343.2]Figure 4: Meshed model of the under base. A detailed description of the meshed component is given below.
Table-1: Types and number of elements
6.1 MATERIALS AND PROPERTIES
[image:3.595.39.288.394.457.2]This is an important topic in selecting the material for the component and the respective properties are given in the table below.
Table-2: Materials and their Properties
6.2 BOUNDARY CONDITIONS
Boundary condition is nothing but the application of force and constraints to the components. In this project, boundary conditions used in the motor locations, screw locations at which other part will locate and also at the roller locations. And the total load of machine of 30kg to be applied on the
under base of the component. The Figures 5 & 6 shows the application of Loads and Boundary conditions on the component.
Figure 5: Boundary conditions on the component
Figure 6: Loads on the component
7. SIMULATION AND RESULTS
Simulation is the method of determining the results such as stress, strain and displacements etc. The simulation process provides the users to find the product validation in which the boundary conditions and assumptions are applied.
7.1 STATIC ANALYSIS
The static analysis is performed in order to find the displacements, stresses and strains in the component. Here in this, all the four roller locations are fixed and the load of 3.7kg for wash motor and 2.5kg for spin motor and the overall load of 30kg applied on the Under base component.
7.1.1 Polypropylene Material (PP)
[image:3.595.36.289.554.675.2]© 2016, IRJET ISO 9001:2008 Certified Journal
Page 928
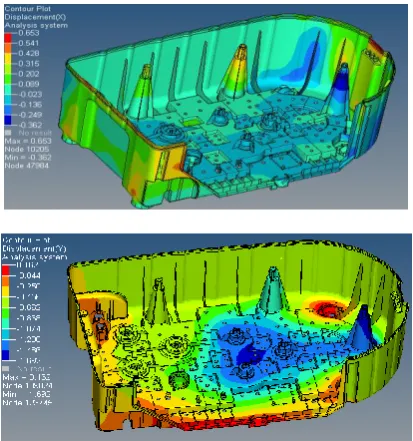
Figure 7: Displacements in X and Y directions.
7.1.2 Acrylonitrile Butadiene Styrene Material
(ABS)
[image:4.595.314.561.152.326.2]In the X direction the maximum displacement is 0.653mm and in Y direction it is 0.162mm. The Figures-8 shows the same.
Figure 8: Displacements in X and Y directions
7.2 DISPLACEMENT PLOT
The Figure-9 shows the Displacement (mm) Vs Time (sec) graph for a rigid plate and also the displacement of 40 mm is given to the rigid plate in order to obtain response from the component in 0.025 Seconds.
Figure 9: Displacement Vs Time Graph.
7.3 MAT_24 MATERIAL CARD
7.3.1 Energy plot
The Figure-10shows the standard global statistic data (GLSTAT) v/s Time graph of different types of energy and their behavior. Here in the below figure, the internal energy absorbed is 126 KJ in the MAT_24 card in 0.025 Seconds.
Figure-10: Glstat Data Vs Time Graph
7.3.2 Maximum principal stress
[image:4.595.58.265.309.530.2]According to this theory the material fails when the
maximum principal stress in the material exceeds the
yield value in simple tensile test. Here the maximum
stress observed is 5.39 Mpa.
Figure-11: Maximum principal stress results
7.3.3 Maximum principal strain
[image:4.595.312.542.450.558.2]Here the maximum strain observed is 9.9% in 0.024 Seconds. The below figure 9.7 shows the principal strains at the under base component.
[image:4.595.31.561.576.778.2]© 2016, IRJET ISO 9001:2008 Certified Journal
Page 929
7.4 MAT_187 Material card
7.4.1 Stress – Strain Curves
The Figure-13 shows the stress – strain curve for the under base component. Here we are selecting three specimens for obtaining the stress – strain curves for the under base component. Out of which, the average one is selected for the analysis.
Figure-13: Stress – Strain curves for the PP
7.4.2 Energy plot
The Figure -14 shows the standard global statistic data (GLSTAT) v/s Time graph of different types of energy and their behavior. Here in the above figure, the total energy absorbed is 66 KJ in the MAT_187 card in 0.025 Seconds.
Figure-14: Glstat Data Vs Time Graph
7.4.3 Maximum principal stress
Here the maximum stress observed is 7.92 Mpa. The Figure -15 shows the results of principal stresses using the MAT_187 card.
Figure-15: Maximum principal stress results
7.4.4 Maximum principal strain
Here the maximum strain observed is 13.8% in 0.024 Seconds. The below figure 9.11 shows the principal strains at the under base component.
Figure-16: Maximum principal strain results
8. RESULTS AND DISCUSSION
8.1 Comparison of Internal Energy Absorbed
The Figure-17 shows the plot of Internal Energy Vs Time for the two LS-DYNA material cards. For MAT_24 card the energy absorbed is 126KJ and for the MAT_187 it is 66KJ.
Figure-17: Internal Energy of MAT_24 & MAT_187
9. VALIDATION
© 2016, IRJET ISO 9001:2008 Certified Journal
Page 930
9.1 Experimental Plot
Figure-18: Physical Force Vs Displacement plot
The above Figure-18 shows the physical Force Vs Displacement plot for the under base component. Here the total load of 40 Kg is applied on the model and the response is as shown.
9.2 LS-DYNA Vs Experimental Plot
The Figure-19 shows the plot of Force Vs Displacement for the under base component considering the MAT_24, MAT_187 & Physical results in one graph for the comparison purpose. By comparing all three curves we can observe that, the MAT_187 curve matching the Physical curve. So that we can say that, the MAT_187 showing the good crazing behavior as that of physical one. But the MAT_24 showing somewhat stiffer than MAT_187.
10. CONCLUSION
In the present study we attempted to capture the crazing behavior of the plastic component using the MAT_24 & MAT_187 material cards and compare the results with the physically obtained one. From the whole study we can conclude that,
1. The crazing behavior of MAT_187 model exactly matching the experimental results, and which can’t be produced by MAT_24 model.
2. By the comparison of Stress and Strains obtained, we can see the difference in the stress factor by 31.9% and 23.8% of strain value, which will lead to over design or under design of under base component.
3. The validation process for the plastic components must require the Three Point Bending test or the Dynamic test.
4. Finally we can say that, the MAT_187 is in good agreement with the experimental results obtained.
11. RECOMMENDATIONS
1. For the further study we can also check for the mesh dependency i.e. by using the different mesh sizes.
2. We can also establish the method of biaxial test for the plastics in future.
3. Furthermore, the study is not restricted to thermoplastics; it should also capable of describing the behavior of structural foams and adhesives. And also steels and aluminum are included in special cases.
12. REFERENCES
1. P.A. Du Bois, S. Kolling, M. Feucht, A. Haufe, “The Influence of Permanent Volumetric Deformation on the Reduction of the Load Bearing Capability of Plastic Components”, 10th International LS-DYNA
Users Conf., 19-35/42, 2008.
2. S. Kolling, A. Haufe, M. Feucht and P. Du Bois, “A Semi-Analytical Model for the Simulation of Polymers”, 4th German LS-DYNA Users Conf.,
A-II-27/57, 2005.
3. P.A. Du Bois, S. Kolling, M. Feucht, A. Haufe, “A Constitutive Formulation for Polymers Subjected to High Strain Rates”, 9th International LS-DYNA Users
Conference, material modeling (1), pp. 15-55/15-74, Germany.
4. Kunio Takekoshi, kazukuni Niwa, “Validation and Material Modeling of Polymers by Employing MAT_SAMP-1”, 12th International LS-DYNA Users
Conference, constitutive modeling (1), pp. 1-12, Japan.