Follicle-stimulating hormone is secreted more
irregularly than luteinizing hormone in both
humans and sheep.
S M Pincus, … , J Randolph, A Rees Midgley
J Clin Invest.
1998;
101(6)
:1318-1324.
https://doi.org/10.1172/JCI985
.
Recently introduced statistical tools capable of discerning differences between the pattern
of luteinizing hormone (LH) secretion and that of follicle-stimulating hormone (FSH) could
be valuable in understanding ovulation and menopause, and ultimately in making
diagnostic decisions and treating infertility and polycystic ovary syndrome. We assessed the
validity and scope of the hypothesis that FSH is secreted more irregularly than LH in ewes
and fertile women. We compared secretory irregularity of LH to that of FSH in both
ovariectomized ewes (n = 7) and women of proven fertility (n = 5) during the follicular and
luteal phases of their reproductive cycles. In each sheep, time series from both hypophyseal
portal blood (HPB) and peripheral blood were evaluated in 72 samples obtained every 5
min; in each human, both luteal and follicular periods were studied in 192 samples obtained
every 7.5 min. To quantify serial irregularity, we used approximate entropy (ApEn), a
scale-and model-independent statistic. FSH secretion was consistently more irregular than that of
LH in each subject. For sheep HPB, ApEn(FSH) = 1.415+/-0.097 was larger than ApEn(LH)
= 0. 822+/-0.213, P < 0.0001 (mean+/-SD, paired t test). This difference persisted
peripherally: ApEn(FSHper) = 1.431+/-0.101 > ApEn(LHper) = 1.252+/-0.086, P = 0.024. In
women, ApEn(FSH) = 1.467+/-0.217 > ApEn(LH) = 0.923+/- 0.305, P < 0.0001. ApEn(FSH)
> ApEn(LH) in 100% of […]
Research Article
Find the latest version:
J. Clin. Invest.
© The American Society for Clinical Investigation, Inc. 0021-9738/98/03/1318/07 $2.00
Volume 101, Number 6, March 1998, 1318–1324 http://www.jci.org
Follicle-stimulating Hormone Is Secreted More Irregularly Than Luteinizing
Hormone in Both Humans and Sheep
Steven M. Pincus,* Vasantha Padmanabhan,‡ William Lemon,‡ John Randolph,‡ and A. Rees Midgley‡
*Guilford, Connecticut 06437; and ‡Reproductive Sciences Program, University of Michigan, Ann Arbor, Michigan 48109
Abstract
Recently introduced statistical tools capable of discerning differences between the pattern of luteinizing hormone (LH) secretion and that of follicle-stimulating hormone (FSH) could be valuable in understanding ovulation and meno-pause, and ultimately in making diagnostic decisions and treating infertility and polycystic ovary syndrome. We as-sessed the validity and scope of the hypothesis that FSH is secreted more irregularly than LH in ewes and fertile women. We compared secretory irregularity of LH to that of FSH in both ovariectomized ewes (n 5 7) and women of proven fertility (n 5 5) during the follicular and luteal phases of their reproductive cycles. In each sheep, time se-ries from both hypophyseal portal blood (HPB) and periph-eral blood were evaluated in 72 samples obtained every 5 min; in each human, both luteal and follicular periods were studied in 192 samples obtained every 7.5 min. To quantify serial irregularity, we used approximate entropy (ApEn), a scale- and model-independent statistic. FSH secretion was consistently more irregular than that of LH in each subject. For sheep HPB, ApEn(FSH) 5 1.41560.097 was larger than ApEn(LH) 5 0.82260.213, P, 0.0001 (mean6SD, paired t test). This difference persisted peripherally: ApEn(FSHper) 5 1.43160.101 . ApEn(LHper) 5 1.25260.086, P5 0.024. In women, ApEn(FSH) 5 1.46760.217 . ApEn(LH) 5 0.9236 0.305, P , 0.0001. ApEn(FSH) . ApEn(LH) in 100% of women (peripheral) and sheep HPB. Secretion during the follicular phase was more irregular than during the luteal phase for both FSH and LH (P, 0.01). LH mean level se-cretion showed a wake/sleep difference in women, P , 0.005, with higher values awake. The consistency and statis-tical significance of these findings suggest that this LH/FSH difference may be broadly based within higher mammals. Ranges of normative and abnormal regularity values of LH, FSH, and their difference can be used in a number of set-tings, both (currently) research and (potentially ultimately) clinical milieus. (J. Clin. Invest. 1998. 101:1318–1324.) Key words: gonadotropin• irregularity • pulsatility • menopause •
infertility
Introduction
At least 15% of married couples in the USA (z 4.5 million) of reproductive age will experience some degree of infertility (1). Infertility difficulties are enhanced with increasing female age: among healthy women without detectable reproductive disor-ders, infertility in women ages 35–39 is estimated to be z 25%, and in women 40 yr or older, z 27% (1). The properly regu-lated release of hormones by both the hypothalamus and pitu-itary gland is one essential requirement for monthly ovulation. If the hypothalamus functions abnormally, follicles will de-velop improperly, often resulting in anovulation. Thus, greater understanding of gonadotropin-releasing hormone (GnRH),1
luteinizing hormone (LH), and follicle-stimulating hormone (FSH) secretion, and concomitant relationships among these hormones, is of vital importance scientifically, in understand-ing the physiology of ovulation, and ultimately clinically in treating disorders.
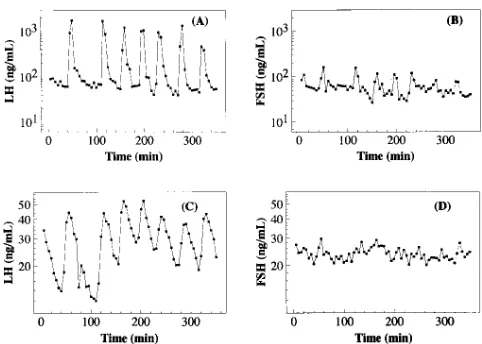
Until recently, word models of pituitary secretion of LH and FSH rendered their dynamics in a virtually identical fash-ion since they are presumed to be driven commonly by GnRH (2). Assuming common stimulation has led to tacit discounting of differences in their secretory patterns or attribution of those differences to changes or differences in clearance rates or iso-forms (2, 3). Recently, detailed characterizations of circulating patterns of LH and FSH have uncovered differences in regula-tion of these two hormones, giving credence to efforts to mea-sure and understand differences in patterns of secretion (4–6). Visually, it appears that the secretory pattern of FSH in sheep is more complicated than that of LH, with many more minor episodes or subordinate activity when measured from hypo-physeal portal blood (HPB), and somewhat less so when mea-sured in peripheral blood (Fig. 1) (7). Motivated by this obser-vation, we attempted to quantify the observed differences using approximate entropy (ApEn) (8, 9) (described below), determine the breadth of the apparent finding across species by analyses of both ovariectomized ewes and humans, and esti-mate the consistency of the finding.
Methods
Sheep study.The experimental design and description of assays of LH and FSH in peripheral (jugular) and HPB of ovariectomized sheep used in this study, herein statistically analyzed by ApEn, have been described previously (7, 10, 11). This method for monitoring LH and FSH in portal blood reveals the dynamics of pituitary hormone secretion without deconvolution (11). In brief, the procedure in-volved surgically fitting ovariectomized Suffolk ewes with an appara-tus for collection of HPB (12, 13). 1 wk later, the sheep were heparin-Portions of this work were presented at the 24th annual meeting of
the Society of Neuroscience in Miami, FL, 13–18 November 1994 and at the 10th International Congress of Endocrinology in San Fran-cisco, CA, 12–15 June 1996.
Address correspondence to Steven M. Pincus, 990 Moose Hill Road, Guilford, CT 06437. Phone: 203-458-3455; FAX: 203-458-9063.
Received for publication 20 June 1997 and accepted in revised form 30 December 1997.
ized, the anterior face of the pituitary was lesioned, catheters from the apparatus and jugular vein were run to fraction collectors in an adjoining room, and portal and peripheral blood were collected sepa-rately as 5-min integrated samples. Portal blood was collected in tubes with 0.5 ml of 0.3 mM bacitracin in saline and later adjusted for dilution. In this study, n5 7 sets of 72 samples of plasma obtained during the breeding season over 6 h (10) were analyzed. Concentra-tions of ovine LH (14) and ovine FSH (15–17) were measured in all series. All procedures were done with the approval of the Univer-sity’s Committee on Use and Care of Animals (UCUCA) in accor-dance with NIH guidelines.
Human study. Five women of proven fertility were studied (ages 18–35). Proven fertility was established by the requirement that the subjects were pregnant within the previous 48 mo. Exclusion criteria included concurrent medical illness or psychiatric problems, the use of oral contraceptives or any medication known, or with the poten-tial, to interfere with the hormonal axes under study during the past 6 mo, or use of any medication other than for a cold or pain during the past 4 mo. Volunteers had to be nonsmokers with regular night-time sleep habits who had regular menstrual cycles (27–31 d). All subjects gave informed consent. Samples (2.5 ml) of peripheral blood were withdrawn every 7.5 min for 24 h, providing an opportunity to assess diurnal variation. Sleep and wake periods were recorded every 7.5 min. Blood was drawn with a dual stopcock technique using a dis-card syringe at the distal stopcock and, to keep the line open, a slow intravenous infusion of 0.9 N saline at the proximal stopcock. After drawing, tubes of blood samples were kept at room temperature for at most 2 h and then refrigerated until separation. Each subject was studied twice, once during the early follicular phase (days 2–5) and, after one intervening cycle, during the midluteal phase (days 16–23). Samples were analyzed for human LH and human FSH by auto-mated, solid phase, magnetically separated, competitive, two site, acridinium ester chemiluminescence-based immunometric assays on a Ciba-Corning Diagnostics analyzer (ACS 180; Medfield, MA).
Quantification of episodicity. To quantify irregularity, we use ApEn, a model-independent statistic (for definition see reference 8), with further mathematical properties and representative biological applications (9, 18–22). ApEn is complementary to pulse detection al-gorithms widely used to evaluate hormone secretion time series (23). ApEn evaluates both dominant and subordinate patterns in data; no-tably, it will detect changes in underlying episodic behavior that do not reflect in peak occurrences or amplitudes (24), a point that is
ger-mane to this analysis. Additionally, ApEn provides a direct barome-ter of feedback system change in many coupled systems (24, 25). In endocrine pathophysiology, ApEn has shown vivid distinctions (P,
10210) between normal and tumor-bearing subjects for growth
hor-mone (GH) (26), ACTH and cortisol (27), and aldosterone (28), a pronounced and consistent gender difference in GH irregularity in both humans and rats (29), and a positive correlation between greater irregularity (larger ApEn) of GH and advancing age (30).
ApEn assigns a nonnegative number to a time series, with larger values corresponding to greater apparent process randomness (serial irregularity), and smaller values corresponding to more instances of recognizable features or patterns in the data. Two input parameters,
m and r, must be specified to compute ApEn. ApEn measures the logarithmic likelihood that runs of patterns that are close (within r) for m contiguous observations remain close (within the same toler-ance width r) on next incremental comparisons (8).
For this study, we calculated ApEn values for all data sets, m5 1 and r5 20% of the standard deviation (SD) of the individual subject time series. Normalizing r to each time series SD gives ApEn a trans-lation- and scale-invariance to absolute serum concentration levels (19). ApEn is a relative measure of process regularity, and can show significant variation in its absolute numerical value with changing background noise characteristics. Since ApEn generally increases with increasing process noise (and increasing intraassay variation), it is appropriate to compare data sets with similar assay CVs, as we do here. Also, most importantly, despite algorithmic similarities, ApEn(m, r) is not intended (8, 9, 31) as an approximate value of the Kolmogorov-Sinai (K-S) entropy. It is essential to consider ApEn(m, r) as a family of parameters; comparisons are intended with fixed m and r.
Previous studies that included both theoretical analysis (8, 31, 32) and clinical applications (18–22, 26–30) have demonstrated that the input parameters indicated above produce good statistical validity (reproducibility) for ApEn for time series of the lengths considered herein (n$ 60 data points). Specifically, via extensive Monte Carlo calculations, the standard deviation of ApEn(m5 1, r5 20% SD, n) # 0.06 for length-n sequences, n$ 60, for a large class of diverse candi-date models, including low-order autoregressive moving average models, the composite oscillator-noise family of processes MIX(p) (for definition see reference 8), and parameterized families of deter-ministic, dynamical systems. The ApEn application with m5 1 esti-mates the rate of entropy for a first-order (m5 1) approximating Markov Chain to the underlying true process (33). Further technical discussion of mathematical and statistical properties of ApEn, includ-ing robustness to noise and artifacts, mesh interplay, relative consis-tency of (m, r) pair choices, asymptotic normality under general as-sumptions, statistical bias, and error estimation for general processes can be found elsewhere (31, 32). To develop a more intuitive, physio-logical understanding of the ApEn definition, a multistep description of its typical algorithmic implementation, with figures, is available (32).
Wake/sleep distinction. In the human study, we tested to deter-mine the presence of a wake/sleep distinction, comparing mean (ab-solute) levels from each state for both LH and FSH. Given a signifi-cant difference between states, noted below, it became imperative to select a similar, homogeneous subepoch of the 24-h studies for each subject, to avoid confounding interpretation (induced by nonstation-arities) of subsequent statistical analyses. For this purpose, we ana-lyzed a contiguous block of awake-state data for all subjects: the final 12 h of study for all but one data set; for subject 4, follicular state, the final 9.5-h epoch, 10:30 a.m. to 8 p.m., to avoid a brief sleep period 8 a.m. to 10:30 a.m.
[image:3.612.56.297.56.228.2]Statistical analysis. All statistical comparisons below for discrimi-nation between two groups used the paired t test with unknown vari-ance. Both raw data time series and logarithmically transformed time series were analyzed; the latter analysis is complementary to the anal-ysis of the raw data, as it diminishes the effects of very large peaks, implicitly weighs more heavily the dynamics occurring at low secre-tory levels, and reduces the heteroscedasticity in the data.
Figure 1. LH and FSH concentrations (ng/ml) measured at 5-min
Results
Sheep studyRepresentative sheep LH and FSH concentration time series derived from previously published studies (7, 10, 11) are shown in Fig. 1, A and B for HPB and C and D for peripheral blood; individual subject ApEn values for all time series are given in Table I. Group comparisons of ApEn for secreted HPB FSH (1.41560.097) and HPB LH (0.82260.213) differed (P5 0.000077) (paired t test). As noted in Table I, pairwise ApEn(FSH) was much larger (more irregular) than ApEn(LH) for each ewe. Importantly, this difference persisted in periph-eral blood, with a group mean ApEn for FSH (1.43160.101) larger than that for LH (1.25260.086) (P5 0.024). Further-more, perhaps because of dispersion, dilution, and elimination, sampling peripherally gives a much more irregular signal, e.g., mean ApEn for peripheral LH is larger than that for HPB LH (P5 0.00033).
Analyses of the logarithmically transformed time series were qualitatively very similar: group comparisons of ApEn for secreted HPB FSH (1.47260.087) and HPB LH (1.1406 0.128) differed (P5 0.000011). Pairwise, ApEn(FSH) was again much larger than ApEn(LH) for each ewe. In peripheral data, mean ApEn for FSH (1.44760.072) was larger than that for LH (1.27260.079) (P 5 0.012).
Human study
Wake/sleep comparison. For each subject and phase, for each
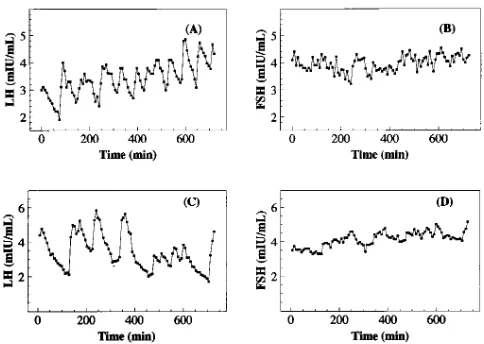
of LH and FSH, we compared mean secretion levels from 1 a.m. to 7 a.m. (subjects asleep for . 90% of the time) to those from 8 a.m. to 8 p.m. (subjects awake for . 95% of the time). The mean LH concentration was lower during the nocturnal period (3.1262.30 mIU/ml) than during the diurnal period (4.3162.05 mIU/ml) (P , 0.03), confirming the visually suggested state difference seen in Fig. 2. For the logarithmically transformed time series, the mean (log) LH concentration was lower during the nocturnal period (0.8060.67 mIU/ml) than during the diur-nal period (1.3160.38 mIU/ml) (P , 0.005). Concomitantly, the mean nocturnal LH was smaller than mean diurnal LH for 9 of the 10 subjects both for the untransformed and log-transformed data. The corresponding FSH comparisons approached significance: mean nocturnal FSH was lower (3.826 1.40 mIU/ml) than diurnal FSH (4.2261.35 mIU/ml) (P , 0.07); and log-transformed nocturnal FSH was lower (1.276 0.36 mIU/ml) than diurnal FSH (1.3960.31 mIU/ml) (P , 0.07). As noted above, we accordingly performed subsequent statistical analysis on a contiguous block of awake-state data.
Stationary epoch, final 12 h. Representative human LH
and FSH peripheral blood time series are shown in Fig. 3, A and B (follicular phase) and C and D (luteal phase); individual subject mean levels and ApEn values for all time series are given in Table II. First, pooling luteal and follicular analyses, group comparisons (n 5 10) of ApEn(FSH) (1.46760.217) and ApEn(LH) (0.92360.305) differed (P 5 0.000016). Pair-wise, ApEn(FSH) was again much larger than ApEn(LH) for each subject and cycle stage. In each of the luteal and follicular stages, ApEn distinctions were significant: in the follicular stage, ApEn(FSH) (1.59160.126) and ApEn(LH) (1.1366 0.259) dif-fered (P 5 0.0052). ApEn(FSH) (1.34360.227) and ApEn(LH) (0.71060.170) also differed in the luteal phase (P 5 0.0024).
[image:4.612.315.557.59.170.2]Furthermore, there was a follicular/luteal phase distinction, for each of LH and FSH. For LH, follicular ApEn (1.1366 0.259) was larger than luteal ApEn (0.71060.170) (P 5 0.0041); for FSH, follicular ApEn (1.59160.126) was larger than luteal ApEn (1.34360.227) (P 5 0.0094).
Table I. Individual Subject LH and FSH ApEn Values for Ewes
Subject
LH secreted (HPB)
FSH secreted (HPB)
LH peripheral
FSH peripheral
[image:4.612.314.556.469.641.2]Ewe 1 0.758 1.396 1.299 1.440 Ewe 2 0.903 1.505 1.242 1.561 Ewe 3 0.625 1.256 1.161 1.486 Ewe 4 0.610 1.347 1.315 1.400 Ewe 5 0.696 1.487 1.235 1.252 Ewe 6 1.199 1.527 1.379 1.372 Ewe 7 0.963 1.385 1.133 1.505
Figure 2. 24-h LH and FSH serum concentrations (mIU/ml)
mea-sured at 7.5-min intervals from a human female, who slept from 11:30 p.m. to 5 a.m. Observe an apparent decrease in LH, and to a some-what lesser extent, in FSH, during the night.
Figure 3. Serum LH and FSH concentrations (mIU/ml) for 12 awake
[image:4.612.57.296.621.739.2]As above, analyses of the logarithmically transformed time series were very similar: Pooled (n 5 10) luteal/follicular group comparisons of ApEn(FSH) (1.46460.217) and ApEn(LH) (0.96460.235) differed (P , 1025). Pairwise, ApEn(FSH) was
again much larger than ApEn(LH) for each subject and cycle stage. In the follicular stage, ApEn(FSH) (1.57960.096) and ApEn(LH) (1.11460.229) differed (P 5 0.0025), while in the luteal stage, ApEn(FSH) (1.34960.252) and ApEn(LH) (0.8146 0.127) differed (P 5 0.0031). The follicular/luteal phase distinc-tion persisted: for LH, follicular ApEn was larger than luteal ApEn (P 5 0.0081); for FSH, follicular ApEn was larger than luteal ApEn (P 5 0.03).
Notably, there was no difference in mean LH (4.3162.05 mIU/ml) and FSH (4.2261.35 mIU/ml) levels (P . 0.9). Simi-larly, for the log-transformed data, mean LH (1.3160.38 mIU/ ml) and FSH (1.3960.31 mIU/ml) were not significantly differ-ent (P . 0.9).
Discussion
Summarizing the statistical results, several distinct analyses confirm that FSH secretion is consistently and significantly more irregular than LH secretion, suggesting that this differ-ence may be broadly based. In the women, these distinctions were consistent for each of the luteal and follicular phases. Mean LH and FSH secretion values were indistinct in women, reinforcing the utility of the distinct, complementary perspec-tive taken by an assessment of irregularity. The luteal phase/ follicular phase distinction is concordant with the slower luteal pulse generation. Finally, the day/night secretory differences seen here reconfirm previously established findings for both LH and, to a lesser extent, FSH (34–36).
Complementarity of irregularity and pulsatility analyses.
As noted above, ApEn is complementary to pulse detection al-gorithms widely used in the evaluation of hormone secretion time series, with the nature of this complementarity discussed previously (24). While in many settings pulse identification methods are quite sufficient to characterize and distinguish distinct physiologic states, in many other settings, it seems that
there is a need for added analysis beyond monitoring the pulse count and related statistics. For example, brief, irregular oscil-lations in plasma insulin levels in maturity-onset diabetics (37), in GH secretion time series of acromegalics and acromegalics in remission (26), in GH time series for healthy female rats (29), and in testosterone time series in men, especially older men (38, 39), clear pulse identification appears to be a very challenging endeavor.
In such instances where clear pulse identification is diffi-cult, the practical utility of irregularity assessment is that there is frequently a gain in statistical clarity and reproducibility by applying ApEn, compared to algorithms that first require pulse determinations. Two examples of this are in direct com-parisons of ApEn to pulsatility method findings on common data sets: studies (38, 39) of changes in LH and testosterone in younger versus older males, and studies (40, 41) of changes in FSH in younger versus older females. In both pairs of studies, the ApEn analyses yielded clearer statistical significance be-tween groups, greater sensitivity and specificity, and afforded qualitatively new significant inferences, compared to those de-rived from pulse analysis. Descriptively, ApEn thus provides a robust measure of the extent and persistence of distinct levels and types of both primary and subordinate activity, without needing to identify discrete pulses in the process.
The above issues are manifested in the present context of analysis of LH/FSH hormonal dynamics in two different ways. First, the identification and characterization of discrete FSH pulses, especially in peripheral blood, has proved to be a for-midable endeavor. The particular difficulties with the assess-ment of episodic FSH release have been reviewed in some de-tail (7, 41), and relate in great part to the slow metabolic clearance of the hormone. This reinforces the need for tech-niques to statistically assess a degree of more subtle structure in FSH serial dynamics, apart from a requirement to do pulse identification first.
Second, even in HPB, assessing the true secretory dynam-ics, based on and by combining pulse analysis for sheep (7, 11), we infer a nearly 1:1 correspondence between GnRH, LH, and primary FSH pulses. Namely, we note a virtually 100% associ-ation between GnRH and LH pulses (11), and a 93% concor-dance of GnRH pulses with essentially coincident, clearly dis-crete FSH pulses in the portal plasma (7). Yet, there is considerably more subordinate FSH than LH activity in HPB, which one wishes to quantitatively assess by suitable analytical methods (7).
Furthermore, in this study, for the HPB sheep data, we de-termined that for each of LH and FSH, there was insignificant linear correlation between ApEn values and mean (primary pulse) frequency and amplitude levels, per sheep. This near in-dependence of ApEn and pulsatility assessment in sheep por-tal blood empirically reinforces the complementarity of these distinct approaches.
[image:5.612.56.298.83.243.2]Finally, the utility of quantitatively assessing the FSH/LH irregularity difference, and changes thereto, is seen in a paral-lel set of studies (41). Three groups of healthy human subjects were studied: n 5 24 younger females (8 per menstrual cycle stage, 3 cycle stages), n 5 8 postmenopausal females, and n 5 17 males, across a broad spectrum of ages, 21–79 y. LH and FSH (peripheral) serum samples were obtained every 10 min for 24 h. First, this study (41) reconfirms the above young women FSH/ LH irregularity difference, via a different study design and sampling regimen. For young females, FSH was consistently
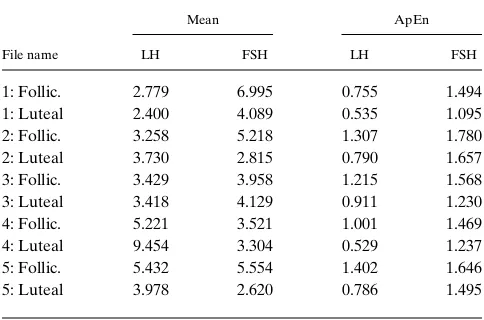
Table II. Individual Subject LH and FSH Mean and ApEn Values in Human Females
File name
Mean ApEn
LH FSH LH FSH
1: Follic. 2.779 6.995 0.755 1.494 1: Luteal 2.400 4.089 0.535 1.095 2: Follic. 3.258 5.218 1.307 1.780 2: Luteal 3.730 2.815 0.790 1.657 3: Follic. 3.429 3.958 1.215 1.568 3: Luteal 3.418 4.129 0.911 1.230 4: Follic. 5.221 3.521 1.001 1.469 4: Luteal 9.454 3.304 0.529 1.237 5: Follic. 5.432 5.554 1.402 1.646 5: Luteal 3.978 2.620 0.786 1.495
more irregular than LH, per subject (P , 0.00001), with ApEn(FSH) . ApEn(LH) for 23 of 24 subjects. Importantly, and a primary finding of this study, for the postmenopausal women, the irregularity difference vanished, ApEn(FSH) 2 ApEn(LH) 5 0.00860.205. Interestingly, males exhibited qualitatively similar results: ApEn(FSH) 2 ApEn(LH) was significantly and negatively correlated with age (r 520.75,
P 5 0.0006). The above observation that clear FSH pulse iden-tification in peripheral blood is especially challenging is con-firmed visually (41), particularly for older subjects.
Differential regulation of LH and FSH. While many
stud-ies have described physiologic stage-specific changes in trains of episodic pulses of circulating LH, relatively few studies have focused on FSH or the relationship of these hormones. These two glycoprotein hormones are known to be contained in the same pituitary cell (42), the gonadotrope, stored in granules and secreted in response to GnRH. Existing literature con-cerning the differential regulation of LH and FSH has empha-sized changes in mean concentrations and their response to physiologic perturbations. Detailed description of the secre-tory character of FSH, the regularity of LH and FSH, and the regularity of their differences, has not been ascertained previ-ously.
Because GnRH can release both hormones from the same cell and because a separate FSH-releasing hormone has not been isolated, the prevailing concept has been that GnRH serves as the principal secretagogue for both hormones (2). According to this notion, observed differences in the ratio of peripheral concentration of the two hormones (43) result in part from the impact of endocrine, paracrine, and autocrine ef-fectors on the gonadotrope that cause differential changes in synthesis or storage of the two hormones (3). GnRH stimula-tion could then lead to differences in the quality and, thus, cir-culatory half-life of each hormone or in the relative amounts of their secretion (3). While the two hormones are known to have different metabolic clearance rates (3), with the half-life of FSH greatly exceeding LH, and while different physiologic states can lead to changes in the ratios of different FSH iso-forms, these differences do not appear to account for the fairly abrupt changes in the LH/FSH ratios in the circulation (44). Additional explanations for observed differences have in-cluded the possible role of gonadotrope subpopulations with differential response (45) or response times (46) to GnRH.
Included among the endocrine effectors with potential for differential regulation of LH and FSH is the mode of presenta-tion of GnRH. Long interpulse durapresenta-tion (47) and low conctration infusions of GnRH (48) have been associated with en-hanced release of FSH in vivo while shorter interpulse intervals have been reported to increase LH (47). However, changes in the mode by which GnRH is introduced in vitro have not led to substantial changes in the differential secretion of LH and FSH from pituitary cells (49). Other endocrine, paracrine, or autocrine effectors include estradiol, inhibin, ac-tivin, follistatin, neulopeptide Y, and galanin. A detailed re-view of the putative and demonstrated roles of these agents is beyond the scope of this discussion. Suffice it to note that they have been reported to act on gonadotropes to stimulate or in-hibit the transcription or translation of FSHb mRNA (50) or otherwise affect synthesis and secretion of both gonadotro-pins. Some of the agents appear to act directly, others appear to act by modulating the response to GnRH (51, 52), perhaps by affecting the availability of GnRH receptor.
In contrast to these attempts to account for differences in observed LH/FSH ratios through modifications of the effects of GnRH as the primary secretagogue, other evidence points to the existence of at least one GnRH-independent mecha-nism controlling FSH secretion. Thus, following hypothalamic-pituitary disconnection in sheep, FSH but not LH, continues to be secreted for long periods (53). FSH secretion also continues in hypophysectomized rats when pituitary glands are trans-planted beneath their kidney capsules (4) and FSH secretion by cultures of pituitary glands continues for long periods of time (54). Other evidence includes the observation of selective secretion of FSH but loss of LH in intact animals passively neutralized with antiserum to GnRH (5, 55). In the sheep pitu-itary secretion data analyzed above, subordinate elevations of FSH are observed between primary LH pulses, beyond con-comitant primary LH and FSH pulses. Possibly most convinc-ingly, administration of a GnRH antagonist wiped out all GnRH-dependent LH and FSH pulses (measured directly at the face of the pituitary), but left quasipulsatile, basal secretion of FSH largely intact (6).
Statistically, the ApEn analysis herein also is consistent with a more complicated control process for FSH than for LH. Elsewhere, we have analytically linked ApEn to a mechanistic understanding via mathematical network analysis, for general classes of networks (24, 25). In particular, we demonstrated that ApEn increases with greater system coupling and/or greater external influences, e.g., the number of critical inter-acting factors, in many coupled, complicated systems, includ-ing autoregressive movinclud-ing average and graded superposition models, and coupled stochastic differential equations. Thus the increase observed above in ApEn(FSH) compared to ApEn(LH) should be anticipated if, as suggested by many in-vestigators (7), FSH is controlled by GnRH and the putative FSH-releasing factor, while LH is controlled just by GnRH. Therefore, ApEn quantifies the subordinate FSH elevations that qualitatively produce more apparently complicated, irreg-ular behavior for FSH than for LH while simultaneously al-lowing some broadly held mechanistic inferences to be made.
Potential applications. These findings suggest that
charac-terization of regularity of both LH and FSH, as well as their mutual relationship, could be used in a number of contexts. Of course, until a simple, reliable, unobtrusive, safe, and inexpen-sive method is available for continuous or episodic measure-ment, this kind of analysis cannot be used routinely in clinical settings. To date, frequent sampling has only been used in re-search settings studying normal or abnormal physiology; the cost of many samples and the inconvenience and discomfort to patients will maintain that practice, in the near term. But the improvement in understanding of a number of abnormal states, e.g., polycystic ovary syndrome, premature ovarian fail-ure, and ovulatory infertility, may lead to improvements in FSH therapy or in alternative therapies targeted at FSH re-lease and based on new findings regarding the differential con-trol of gonadotropin secretion.
FSH mixture are clearly desirable, which the above analytic strategy (and results) can begin to address. Finally, the distinc-tion in irregularity between luteal and follicular phases, for both LH and FSH, may be useful not only in possibly predict-ing an LH surge, but may be consequential in determinpredict-ing the time until onset of menopause, often an important determi-nant in hormonal therapy versus surgical (hysterectomy) clini-cal options in a patient with perimenopausal menorrhagia. We hypothesize that as women become perimenopausal, luteal/ follicular ApEn differences diminish, for both LH and FSH.
Acknowledgments
The authors would like to acknowledge the efforts of Geoffrey E. Dahl, Neil P. Evans, Douglas L. Foster, Judy M. Manning, Kimberly P. Mayfield, and Sue M. Moenter in collecting the samples analyzed in this study and the effort of Karen Nairn in handling the recruit-ment and scheduling of the volunteers. The authors appreciate the as-sistance of the nursing staff of the General Clinical Research Center of the University of Michigan in obtaining the frequent samples of blood from the women.
This work was supported in part by the National Institute of Child Health and Human Development grant R43 HD-33776, and per-formed in part for the National Institute of Child Health and Human Development’s National Cooperative Program on Infertility Re-search (National Institutes of Health grant U54 HD-29184), using samples generated in an earlier study funded by the National Insti-tutes of Health grant R01 HD-18018, receiving the support of the Assay and Reagents, Sheep Research, and Biostatistics Cores of the Center for the Study of Reproduction (National Institutes of Health grant P30 HD-18258) and the Clinical Research Center (National In-stitutes of Health grant MO1 RR-00042) at the University of Michigan.
References
1. Mosher, W.D. 1988. Fecundity and infertility in the United States. Am. J.
Public Health. 78:181–182.
2. Schally, A.V., A. Arimura, A.J. Kastin, H. Matsuo, Y. Baba, T.W. Red-ding, R.M. Nair, L. Debeljuk, and W.F. White. 1971. Gonadotropin-releasing hormone: one polypeptide regulates secretion of luteinizing and follicle-stimu-lating hormones. Science. 173:1036–1038.
3. Ulloa-Aguirre, A., A.R. Midgley, Jr., I.Z. Beitins, and V. Padmanabhan. 1995. Follicle stimulating isohormones: biological characterization and physio-logical relevance. Endocr. Rev. 16:765–787.
4. DePaolo, L.V. 1991. Hypersecretion of follicle-stimulating hormone (FSH) after ovariectomy of hypophysectomized, pituitary-grafted rats: implica-tions for local regulatory control of FSH. Endocrinology. 128:1731–1740.
5. McCann, S.M., H. Mizunuma, W.K. Samson, and M.D. Lumpkin. 1983. Differential hypothalamic control of FSH secretion: a review.
Psychoneuroen-docrinology. 8:299–308.
6. Padmanabhan, V., K.L. McFadden, N.P. Evans, G.E. Dahl, D.T. Mauger, and F.J. Karsch. 1994. Pulsatile FSH secretion in the ovariectomized ewe is con-trolled by both GnRH-dependent and GnRH-independent mechanisms. Abstr.
Soc. Neurosci. 20:436.6a. (Abstr.)
7. Padmanabhan, V., K. McFadden, D.T. Mauger, F.J. Karsch, and A.R. Midgley, Jr. 1997. Neuroendocrine control of FSH secretion. I. Direct evidence for separate episodic and basal components of FSH secretion. Endocrinology. 138:424–432.
8. Pincus, S.M. 1991. Approximate entropy as a measure of system com-plexity. Proc. Natl. Acad. Sci. USA. 88:2297–2301.
9. Pincus, S., and B.H. Singer. 1996. Randomness and degrees of irregular-ity. Proc. Natl. Acad. Sci. USA. 93:2083–2088.
10. Karsch, F.J., G.E. Dahl, N.P. Evans, J.M. Manning, K.P. Mayfield, S.M. Moenter, and D.L. Foster. 1993. Seasonal changes in gonadotropin-releasing hormone secretion in the ewe: alteration in response to the negative feedback action of estradiol. Biol. Reprod. 49:1377–1383.
11. Midgley, A.R., Jr., K. McFadden, M. Ghazzi, F.J. Karsch, M.B. Brown, D.T. Mauger, and V. Padmanabhan. 1997. Nonclassical secretory dynamics of LH revealed by hypothalamo-hypophyseal portal sampling of sheep.
Endo-crine. 6:133–143.
12. Clarke, I.J., and J.T. Cummins. 1982. The temporal relationship be-tween gonadotrophin-releasing hormone (GnRH) and luteinizing hormone
(LH) secretion in ovariectomized ewes. Endocrinology. 111:1737–1739. 13. Caraty, A., A. Locatelli, S.M. Moenter, and F.J. Karsch. 1994. Sampling of hypophyseal portal blood of conscious sheep for direct monitoring of hypo-thalamic neurosecretory substances. In Pulsatility in Neuroendocrine Systems. J.E. Levine and P.M. Conn, editors. Academic Press, New York. 162–183.
14. Niswender, G.D., A.R. Midgley, Jr., S.E. Monroe, and L.E. Reichert, Jr. 1968. Radioimmunoassay for rat luteinizing hormone with antiovine LH serum and ovine LH-131-I. Proc. Soc. Exp. Biol. Med. 128:807–811.
15. L’Hermite, M., G.D. Niswender, L.E. Reichert, Jr., and A.R. Midgley, Jr. 1972. Serum follicle-stimulating hormone in sheep as measured by radioim-munoassay. Biol. Reprod. 6:325–332.
16. Padmanabhan, V., K.M. Reno, M. Borondy, T.D. Landefeld, F.J. Ebling, D.L. Foster, and I.Z. Beitins. 1992. Effect of nutritional repletion on pi-tuitary and serum follicle-stimulating hormone isoform distribution in growth-retarded lambs. Biol. Reprod. 46:964–971.
17. Padmanabhan, V., C.D. Mieher, M. Borondy, H. I’Anson, R.I. Wood, T.D. Landefeld, D.L. Foster, and I.Z. Beitins. 1992. Circulating bioactive folli-cle-stimulating hormone and less acidic follifolli-cle-stimulating hormone isoforms increase during experimental induction of puberty in female lambs.
Endocri-nology. 131:213–220.
18. Kaplan, D.T., M.I. Furman, S.M. Pincus, S.M. Ryan, L.A. Lipsitz, and A.L. Goldberger. 1991. Aging and the complexity of cardiovascular dynamics.
Biophys. J. 59:945–949.
19. Pincus, S.M., T.R. Cummins, and G.G. Haddad. 1993. Heart rate control in normal and aborted SIDS infants. Am. J. Physiol. 264:R638–R646.
20. Pincus, S.M., I.M. Gladstone, and R.A. Ehrenkranz. 1991. A regularity statistic for medical data analysis. J. Clin. Monit. 7:335–345.
21. Pincus, S.M., and R.R. Viscarello. 1992. Approximate entropy: a regu-larity measure for fetal heart rate analysis. Obstet. Gynecol. 79:249–255.
22. Ryan, S.M., A.L. Goldberger, S.M. Pincus, J. Mietus, and L.A. Lipsitz. 1994. Gender- and age-related differences in heart rate dynamics: are women more complex than men? J. Am. Coll. Cardiol. 24:1700–1707.
23. Urban, R.J., W.S. Evans, A.D. Rogol, D.L. Kaiser, M.L. Johnson, and J.D. Veldhuis. 1988. Contemporary aspects of discrete peak-detection algo-rithms. I. The paradigm of the luteinizing hormone pulse signal in men. Endocr.
Rev. 9:3–37.
24. Pincus, S.M., and D.L. Keefe. 1992. Quantification of hormone pulsatil-ity via an approximate entropy algorithm. Am. J. Physiol. 262:E741–E754.
25. Pincus, S.M. 1994. Greater signal regularity may indicate increased sys-tem isolation. Math. Biosci. 122:161–181.
26. Hartman, M.L., S.M. Pincus, M.L. Johnson, D.H. Matthews, L.M. Faunt, M.L. Vance, M.O. Thorner, and J.D. Veldhuis. 1994. Enhanced basal and disorderly growth hormone (GH) secretion distinguish acromegalic from normal pulsatile GH release. J. Clin. Invest. 94:1277–1288.
27. Van den Berg, G., S.M. Pincus, J.D. Veldhuis, M. Frolich, and F. Roelf-sema. 1997. Greater disorderlines of ACTH and cortisol release accompanies pituitary-dependent Cushing’s disease. Eur. J. Endocrinol. 136:394–400.
28. Siragy, H.M., W.V.R. Vieweg, S.M. Pincus, and J.D. Veldhuis. 1995. In-creased disorderliness and amplified basal and pulsatile aldosterone secretion in patients with primary aldosteronism. J. Clin. Endocrinol. Metab. 80:28–34.
29. Pincus, S.M., E. Gevers, I.C.A.F. Robinson, G. van den Berg, F. Roelf-sema, M.L. Hartman, and J.D. Veldhuis. 1996. Females secrete growth hor-mone with more process irregularity than males in both humans and rats. Am.
J. Physiol. 270:E107–E115.
30. Veldhuis, J.D., A.Y. Liem, S. South, A. Weltman, J. Weltman, D.A. Clemmons, R. Abbott, T. Mulligan, M.L. Johnson, S. Pincus, et al. 1995. Differ-ential impact of age, sex steroid hormones, and obesity on basal versus pulsatile growth hormone secretion in men as assessed in an ultrasensitive chemilumi-nescence assay. J. Clin. Endocrinol. Metab. 80:3209–3222.
31. Pincus, S.M., and W.M. Huang. 1992. Approximate entropy: statistical properties and applications. Commun. Statist. Theory Meth. 21:3061–3077.
32. Pincus, S.M., and A.L. Goldberger. 1994. Physiological time series anal-ysis: what does regularity quantify? Am. J. Physiol. 266:H1643–H1656.
33. Pincus, S.M. 1992. Approximating Markov chains. Proc. Natl. Acad. Sci.
USA. 89:4432–4436.
34. Rossmanith, W.G., and S.S.C. Yen. 1987. Sleep-associated decrease in luteinizing hormone pulse frequency during the early follicular phase of the menstrual cycle: evidence for an opiodergic mechanism. J. Clin. Endocrinol.
Metab. 65:715–718.
35. Venturoli, S., E. Porcu, R. Fabbri, O. Magrini, L. Gammi, R. Paradisi, M. Forcacci, R. Bolzani, and C. Flamigni. 1988. Episodic pulsatile secretion of FSH, LH, prolactin, oestradiol, oestrone, and LH circadian variations in poly-cystic ovary syndrome. Clin. Endocrinol. 28:93–107.
36. O’Byrne, K.T., J.C. Thalabard, P.M. Grosser, R.C. Wilson, C.L. Wil-liams, M.D. Chen, D. Ladendorf, J. Hotchkiss, and E. Knobil. 1991. Radiotele-metric monitoring of hypothalamic gonadotropin-releasing hormone pulse generator activity throughout the menstrual cycle of the rhesus monkey.
Endo-crinology. 129:1207–1214.
37. Lang, D.A., D.R. Matthews, and R.C. Turner. 1981. Brief, irregular os-cillations of basal plasma insulin and glucose concentrations in diabetic men.
Diabetes. 30:435–439.
Veldhuis. 1995. Amplified nocturnal luteinizing hormone (LH) secretory burst frequency with selective attenuation of pulsatile (but not basal) testosterone se-cretion in healthy aged men: possible Leydig cell desensitization to endogenous LH signaling—a clinical research center study. J. Clin. Endocrinol. Metab. 80: 3025–3031.
39. Pincus, S.M., T. Mulligan, A. Iranmanesh, S. Gheorghiu, M. Godschalk, and J.D. Veldhuis. 1996. Older males secrete luteinizing hormone (LH) and tes-tosterone more irregularly, and jointly more asynchronously, than younger males. Proc. Natl. Acad. Sci. USA. 93:14100–14105.
40. Booth, R.A., Jr., J.Y. Weltman, V.I. Yankov, J. Murray, T.S. Davison, A.D. Rogol, C.M. Asplin, M.L. Johnson, J.D. Veldhuis, and W.S. Evans. 1996. Mode of pulsatile FSH secretion in gonadal-hormone sufficient and deficient women. J. Clin. Endocrinol. Metab. 81:3208–3214.
41. Pincus, S.M., J.D. Veldhuis, T. Mulligan, A. Iranmanesh, and W.S. Evans. 1997. Effects of age on the irregularity of LH and FSH serum concentra-tions in women and men. Am. J. Physiol. (Endocrinol Metab.). 273:E989–E995. 42. Childs, G.V., C. Hyde, Z. Naor, and K. Catt. 1983. Heterogeneous luteinizing hormone and follicle-stimulating hormone storage patterns in sub-types of gonadotropes separated by centrifugal elutriation. Endocrinology. 113: 2120–2128.
43. Chappel, S.C. 1985. Neuroendocrine regulation of luteinizing hormone and follicle-stimulating hormone: a review. Life Sci. 36:97–103.
44. Levine, J.E., and M.T. Duffy. 1988. Simultaneous measurement of luteinizing hormone (LH)-releasing hormone, LH, and follicle-stimulating hor-mone release in intact and short-term castrate rats. Endocrinology. 122:2211– 2221.
45. Denef, C., E. Hautekeete, and R. Dewals. 1978. Monolayer cultures of gonadotrophs separated by velocity sedimentation: heterogeneity in response to luteinizing hormone-releasing hormone. Endocrinology. 103:736–747.
46. Schwartz, N.B., C. Rivier, J. Rivier, and W.W. Vale. 1985. Effect of go-nadotropin-releasing hormone antagonists on serum follicle-stimulating hor-mone and luteinizing horhor-mone under conditions of singular follicle-stimulating
hormone secretion. Biol. Reprod. 32:391–398.
47. Clarke, I.J., J.T. Cummins, J.K. Findlay, K.J. Burman, and B.W. Dough-ton. 1984. Effects on plasma luteinizing hormone and follicle-stimulating mone of varying the frequency and amplitude of gonadotropin-releasing hor-mone pulses in ovariectomized ewes with hypothalamo-pituitary disconnection.
Neuroendocrinology. 39:214–221.
48. Wise, P.M., N. Rance, G.D. Barr, and C.A. Barraclough. 1979. Further evidence that luteinizing hormone-releasing hormone also is follicle-stimulating hormone-releasing hormone. Endocrinology. 104:940–947.
49. Kotsuji, F., S.J. Winters, H.S. Keeping, B. Attardi, H. Oshima, and P. Troen. 1988. Effects of inhibin from primate Sertoli cells on follicle-stimulating hormone and luteinizing hormone release by perifused rat pituitary cells.
Endo-crinology. 122:2796–2802.
50. McNeilly, A.S. 1988. The control of FSH secretion. Acta Endocrinol.
Suppl. (Copenh.). 288:31–40.
51. Landefeld, T.D., T. Bagnell, and I. Levitan. 1989. Effects of estradiol on gonadotropin subunit messenger ribonucleic acid amounts during an induced gonadotropin surge in anestrous ewes. Mol. Endocrinol. 3:10–14.
52. Wu, J.C., S.C. Sealfon, and W.L. Miller. 1994. Gonadal hormones and gonadotropin-releasing hormone (GnRH) alter messenger ribonucleic acid lev-els for GnRH receptors in sheep. Endocrinology. 134:1846–1850.
53. Hamernik, D.L., and T.M. Nett. 1988. Gonadotropin-releasing hormone increases the amount of messenger ribonucleic acid for gonadotropins in ova-riectomized ewes after hypothalamic-pituitary disconnection. Endocrinology. 122:959–966.
54. Sheridan, R., B. Loras, L. Surardt, F. Ectors, and J.L. Pasteels. 1979. Autonomous secretion of follicle-stimulating hormone by long term organ cul-tures of rat pituitaries. Endocrinology. 104:198–204.