0095-1137/97/$04.0010
Copyright © 1997, American Society for Microbiology
Rapid Flow Cytometric Susceptibility Testing of
Candida albicans
RAMA RAMANI,1* ANANTHAKRISHNAN RAMANI,1ANDSUSAN J. WONG2
Mycology Laboratory1and Diagnostic Immunology Laboratory,2Wadsworth Center,
New York State Department of Health, Albany, New York
Received 28 January 1997/Returned for modification 22 May 1997/Accepted 18 June 1997
A rapid flow cytometric assay for in vitro antifungal drug susceptibility testing was developed by adapting the proposed reference method for broth macrodilution testing of yeasts. Membrane permeability changes caused by the antifungal agent were measured by flow cytometry using propidium iodide, a nucleic acid-binding fluorochrome largely excluded by the intact cell membrane. We determined the in vitro susceptibility of 31
Candida albicansisolates and two quality control strains (Candida parapsilosisATCC 22019 andCandida krusei
ATCC 6258) to amphotericin B and fluconazole. Amphotericin B MICs ranged from 0.03 to 2.0mg/ml, while
fluconazole MICs ranged from 0.125 to 128 mg/ml. This method results in clear-cut endpoints that were
reproducible. Four-hour incubation was required for fluconazole, whereas a 2-h incubation was sufficient for amphotericin B to provide MICs comparable to the reference macrodilution method developed by the National Committee for Clinical Laboratory Standards Subcommittee on Antifungal Susceptibility Tests. Results of these studies show that flow cytometry provides a rapid and sensitive in vitro method for antifungal
suscep-tibility testing ofC. albicans.
The increased incidence of fungal infections has augmented the use of various antifungal agents and the need for develop-ing antifungal susceptibility testdevelop-ing. In contrast to antibacterial testing procedures, antifungal susceptibility testing is still evolving. Antifungal susceptibility testing is influenced by a variety of factors such as inoculum concentration, preparation, pH and composition of media, incubation temperature, and the physical and chemical properties of antifungal agents (7, 11, 16). The National Committee for Clinical Laboratory Stan-dards (NCCLS) Subcommittee on Antifungal Susceptibility Tests has developed a reference macrodilution method (M27-T) for broth dilution antifungal susceptibility testing of yeast (8). Several modifications to the NCCLS method have been proposed (4, 12, 17). These traditional methods involve semiquantitative and subjective assessment of quantities of yeast growth and there-fore require incubation of 48 h or longer to produce accurate results (4, 8, 13, 16).
Flow cytometry is a rapid and sensitive technique with im-portant applications in biology and medicine (2, 6). Flow cytometry has been used to distinguish living from dead microorganisms by using DNA-binding vital stains (1, 18). Membrane integrity and other indicators of microbial viability can be evaluated on a cell-by-cell basis (15). Monitoring the transmembrane electrochemical potential or membrane dam-age can provide a rapid indication of antimicrobial-dam-agent-in- antimicrobial-agent-in-duced injury. Our flow cytometric assay is based on detection of increased permeability of the cell membrane to propidium iodide (PI), a membrane-impermeant DNA-intercalating dye, following treatment with antimicrobial agents. This technique has been previously applied to Candida albicans (3, 10, 14). However, it has not been compared with standard methods across different strains under uniform conditions of inoculum size, drug concentrations, and duration of drug exposure.
We have developed a flow cytometric method using testing conditions specified by NCCLS for the broth macrodilution
susceptibility testing procedure, adjusting the indicator system and incubation times to obtain comparable results. In this paper we present results of the susceptibility testing of 35 clinical and reference strains of yeast with various degrees of resistance to amphotericin B and fluconazole.
MATERIALS AND METHODS
Organisms.Thirty-five strains of yeasts were tested by both the NCCLS broth macrodilution and the flow-cytometric assay. The test organisms included six American Type Culture Collection (ATCC) (Rockville, Md.) strains. Strains recommended by NCCLS as reference strains (C. albicansATCC 90028 and ATCC 24433) and quality control strains (Candida parapsilosisATCC 22019 and
Candida kruseiATCC 6258) were included (8). These ATCC strains have well-defined macrodilution MIC reference ranges for both amphotericin B and flu-conazole and provide a means of comparing the MIC obtained by cytometry with the NCCLS macrodilution reference methods. Ten resistant strains were ob-tained from the Fungus Testing Laboratory, San Antonio, Tex. Two recent clinical isolates ofCandida lusitaniaewere also tested against amphotericin B. The remaining 17 strains were all recent clinical isolates submitted to the My-cology Laboratory, New York State Department of Health. The clinical isolates were identified to the species level by conventional biochemical methods and the API 20C yeast identification system (Analytab Products, Plainview, N.Y.). Iso-lates were stored at 2 to 8°C (refrigeration). Prior to testing, each isolate was passaged at least twice on Sabouraud dextrose agar to ensure purity and optimal growth.
Antifungal agents.Amphotericin B was obtained from Sigma Chemical Com-pany (St. Louis, Mo.), and fluconazole was obtained from Roerig/Pfizer Phar-maceuticals (New York, N.Y.). Stock solutions of fluconazole and amphotericin B were prepared in dimethyl sulfoxide at 6,400 and 1,600mg/ml, respectively. The stock solutions were frozen in 1.0-ml aliquots at270°C. Drug dilutions were prepared by additive drug dilution schemes employed to minimize systematic pipetting errors.
NCCLS reference procedure.The susceptibility of each yeast isolate to am-photericin B and fluconazole was tested by the reference NCCLS macrodilution method (8). Serial twofold dilutions of the antifungal agents were prepared with RPMI 1640. The final concentrations of the antifungal agents ranged from 0.0313 to 16mg/ml for amphotericin B and 0.125 to 64mg/ml for fluconazole. The inoculum was prepared by picking five colonies$1 mm in diameter from 24-h-old cultures and suspended in 5 ml of sterile 0.85% saline. The cell density was adjusted with a spectrophotometer by adding sufficient sterile saline to increase the transmittance to that produced by a 0.5 McFarland standard at a 530-nm wavelength. This stock solution was diluted 1:100 and then 1:20 with RPMI 1640 broth medium, resulting in 0.53103to 2.53103cells per ml. Each 12- by 75-mm
tube received 0.1 ml of one of the various antifungal concentrations, to which 0.9 ml of the adjusted inoculum was added. All tubes were incubated at 35°C for 48 h.
Fluorochrome dye.PI (Sigma Chemical Co.), a nucleic acid-binding fluoro-chrome largely excluded by intact cell membranes, was used to strain yeast cells. Sodium deoxycholate (Difco Laboratories, Detroit, Mich.), a detergent, was used
* Corresponding author. Mailing address: David Axelrod Institute for Public Health, Wadsworth Center, New York State Department of Health, P.O. Box 22002, Albany, NY 12201-2002. Phone: (518) 474-4177. Fax: (518) 486-7971. E-mail: rxr15@health.state.ny.us.
2320
on May 15, 2020 by guest
http://jcm.asm.org/
to facilitate diffusion of PI into the yeast cell membranes damaged by the antifungal agent (6).
Flow cytometric assay.The RPMI 1640 medium (Sigma Chemical Co.) con-tainedL-glutamine without bicarbonate, buffered to pH 7.0 with 0.165 M mor-pholinepropanesulfonic acid (MOPS). The yeast isolates were grown on Sab-ouraud dextrose agar for 24 h at 35°C. Individual yeast suspensions were prepared in sterile 0.85% saline. The resulting suspensions were vortexed for 15 s, and the yeast cell density was adjusted with a spectrophotometer by adding sufficient sterile 0.85% saline to 50% transmittance at a 530-nm wavelength in accordance with the NCCLS method. This procedure yielded a stock suspension of 13106
to 53106
cells per ml. Experiments with dilutions of 1:1, 1:10, 1:100, and 1:2,000 of the stock suspension revealed that optimal flow cytometric mea-surements were obtainable with an inoculum of 13106
to 53106
cells per ml. Such a cell suspension ran consistently at rates under 1,000 particles per s when analyzed in the cytometer and was the working suspension. One-half milliliter of serial twofold dilutions of each antifungal agent was placed in 12- by 75-mm tubes (Falcon 2054; Becton Dickinson, Lincoln Park, N.J.). Yeast inocula (0.5 ml) were added, bringing the drug dilutions to the final test volume of 1 ml. The growth control received 0.5 ml of drug diluent (RPMI 1640 medium) without antifungal drug. All the tubes were incubated without agitation at 35°C. After a 2-h incubation for amphotericin B and 4-h incubation for fluconazole, each dilution was gently vortexed and 300-ml samples were placed in 12- by 75-mm tubes (Falcon 2054). Three hundred microliters of sodium deoxycholate (25 mM) and 10ml of 1% PI were added to each dilution, and the tubes were gently mixed by tapping. The final concentration of PI in the tubes was 1mg/ml. Each tube was analyzed via flow cytometry. The flow cytometry was performed on an Epics Profile (Coulter) cytometer with a 15-mW air-cooled argon laser and a Bio Sense 250-mm square flow cell. The beam-shaping assembly provided a 36-m m-wide by 38-mm-high laser beam path. Sample volume was 75ml, and flow rate was 10ml/min. Profile software version 2.6 was used for analysis. Parameters evalu-ated were forward scatter, side scatter, and log red fluorescence. Instrument parameters were as follows: forward scatter (gain, 5.0), side scatter (gain, 2.0), side scatter PMT (305 V), log red fluorescence PMT (800 V). Each flow cyto-metric susceptibility test analyzed 10,000 events or yeast cells. The instrument was aligned on a daily basis and calibrated according to the manufacturer’s instructions. MIC was defined as the lowest drug concentration which resulted in an increase in the mean channel fluorescence by 80 and$90% of the growth control for fluconazole and amphotericin B, respectively.
RESULTS
Fluorochrome uptake by heat-killed yeast.We initially
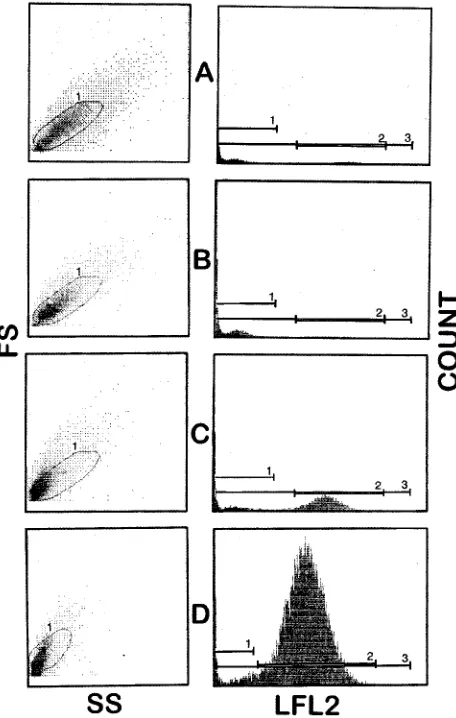
de-fined instrument parameters using heat-killedC. albicanscells and untreated growth control cells in order to maximize the fluorescence intensity in nonviable, heat-killed cells and to define the size and side scatter properties of the yeast cultures. The deleterious effects of heat, i.e., boiling at 100°C for 20 min, on yeast cells were assessed by measuring the red fluorescence which resulted from PI binding to DNA after uptake through damaged membranes. The change in red fluorescence was of sufficient magnitude to allow consistent quantitative differen-tiation between living (viable) and heat-killed (nonviable) cells (Fig. 1).
Antifungal susceptibility testing.When antifungal effects of
PI uptake into yeast cells were tested, addition of deoxycholate was essential to enable prompt and optimal penetration of saturating amounts of dye (PI) into the damaged cells to sat-urate DNA. Several experiments were conducted to determine the optimal dye concentration, yeast inoculum size, and incu-bation times (0.5 to 5 h) for each antifungal agent. Figure 2 shows the MICs for a reference strain (ATCC 90028) incu-bated for various periods. We found that the test conditions specified in the NCCLS protocol modified as described pro-duced results comparable to the NCCLS macrobroth dilution technique. For amphotericin B, a 2-h incubation was sufficient for determination of the MIC, whereas for fluconazole, 4-h incubation was required. We initially titrated the optimal amount of fluorochrome to maximize fluorescence without excess dye in solution, as measured by obtaining the highest mean channel fluorescence with heat-killedC. albicanscells.
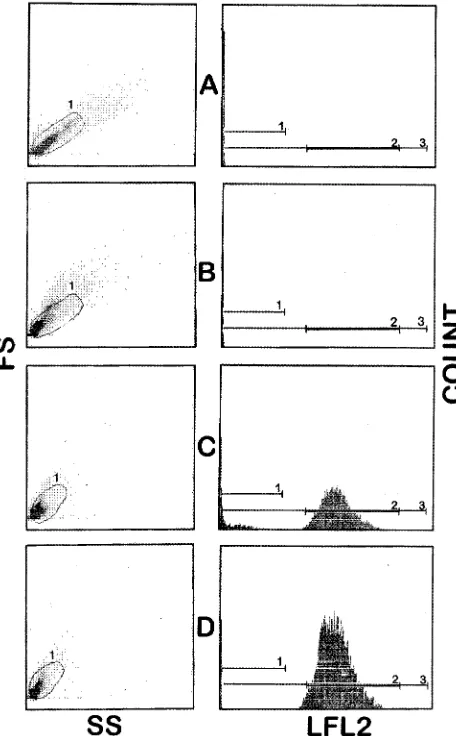
Figure 3 shows representative histograms depicting the up-take of PI byC. albicansin the presence of different concen-trations of amphotericin B, and Fig. 4 shows results obtained
with fluconazole. There was a compact cluster of cells in the growth control and subinhibitory concentrations of the anti-fungal agent. However, in the forward-versus-side scatter anal-ysis, the response to inhibitory concentrations of the drugs differed between amphotericin B and fluconazole. The C.
al-bicanscells were shown to shrink in high amphotericin B
con-centrations, as evidenced by a decrease in forward scatter (Fig. 3). On the other hand, the size of yeast cells appeared to increase in the presence of inhibitory concentrations of flucon-azole (Fig. 4). With increasing concentrations of fluconazode, a greater proportion of the yeast cells moved out of a bitmap drawn around the cell cluster observed in the growth control tube. Beyond the MIC a major proportion of the yeast cells exhibited damage, and these events reached outside the bitmap (Fig. 4).
Comparison of results between the reference and cytometric
methods. MICs obtained by flow cytometry were compared
with the standard NCCLS broth macrodilution analysis for all 31 strains ofC. albicans (Table 1). The MICs were within 1 drug dilution of the reference NCCLS method in all 31 strains tested. Amphotericin B MIC ranged from 0.03 to 2.0 mg/ml, while fluconazole MIC ranged from 0.125 to 128mg/ml.
Sev-FIG. 1. Representative flow cytometer histograms for one strain ofC. albi-cansstained with PI and containing different proportions of viable and heat-killed (nonviable) cells. Dot plots are shown for side scatter (SS) and forward scatter (FS). Cell count and log fluorescence (LFL2) values are also shown. (A) 100% viable cells; (B) 50% nonviable cells; (C) 90% nonviable cells; (D) 100% nonviable cells.
on May 15, 2020 by guest
http://jcm.asm.org/
[image:2.612.322.550.71.430.2]eral strains were run in duplicate, with similar results obtained each time. The results of the flow cytometric method were easier to interpret even with the resistant strains. The “trailing effect” was not observed in testing the susceptibility to flucon-azole. The quality control strains (C. parapsilosisandC. krusei) showed MICs within the recommended ranges. High ampho-tericin B MICs were observed in susceptibility testing of C.
lusitaniae(Table 2).
DISCUSSION
With the availability of newer antifungal agents, the need to develop a reliable and rapid technique for antifungal testing is justified from the point of view of providing the clinician with objective data to assist in choosing the most effective antimi-crobial regimen. Progress in standardizing antifungal suscepti-bility testing has been significant (4, 8, 12, 13). A reference macrodilution method has been proposed by NCCLS (8). Comparable MIC results can be obtained with a microdilution testing method utilizing a microplate spectrophotometric end-point determination, but 48-h incubation is still required (13, 16). This long waiting period to demonstrate antifungal sus-ceptibility is necessary because such tests rely on growth or lack thereof when the microorganisms are incubated in the pres-ence of the antimicrobial agent. Our flow cytometric technique provides NCCLS-comparable results following a short period of incubation. We found that the length of incubation required
to generate NCCLS-comparable results varies with the anti-fungal agents, i.e., for amphotericin B, 2-h incubation is suffi-cient, whereas for fluconazole, 4-h incubation is required. Ad-equate response as assayed by PI fluorescence emission was not seen with shorter incubation times tested (Fig. 2). The alterations in the side scatter and forward scatter cytograms, indicative of the antifungal effect on the yeast cells, were also only minimally apparent with a shorter incubation time.
[image:3.612.102.255.69.415.2]The generation time ofCandidais approximately 3 h (15), so it is understandable that the drug effects take at least a partial growth cycle to be detected, especially with azoles, which do not directly affect the membrane structure. Since fluconazole inhibits fungal 14ademethylation of lanosterol, thereby block-ing formation of ergosterol, an incubation period longer than a single generation time is required to detect this metabolic effect. We employed the NCCLS culture conditions, dilution schemes, and incubation conditions, but increased the inocu-lum size and shortened the duration of incubation. We found mean channel fluorescence to be a reliable parameter for all 35 strains tested including strains for which both agents have high MICs, with replicate determinations for individual strains. The lack of definite reading endpoints observed in the NCCLS tests of susceptibility to azoles due to the trailing effect is not seen.
FIG. 2. Effect of time of reading on amphotericin B (AmpB) and fluconazole MICs for a reference strain (ATCC 90028) by flow cytometry.
FIG. 3. Changes in flow cytometric parameters ofC. albicansinduced by amphotericin B after incubation for 2 h. (A) Growth control; (B) subinhibitory concentrations; (C) inhibitory concentrations; (D) maximal inhibitory concen-tration. SS, side scatter; FS, forward scatter; LFL2, log fluorescence.
on May 15, 2020 by guest
http://jcm.asm.org/
[image:3.612.322.550.323.691.2]This is because flow cytometry measures antibiotic-induced membrane damage with great precision on a cell-by-cell basis. Pore (14) demonstrated membrane damage caused by anti-fungals after 5 h, although no superior separation of damaged and undamaged cells was observed after a 9-h incubation. This method involves incubation of the fluorochrome throughout the entire period, raising the possibility of dye-antifungal agent interactions. O’Gorman and Hopfer (9) used a 7-h assay time in a comparable experiment. Their technique utilized a 3-h incubation with antifungal agent followed by a 4-h exposure to ethidium bromide. They utilized a negative gating technique based on the percentage of cells moving into the smaller (for-ward scatter) and higher fluorescence gate. A long exposure was necessary to allow the dye to pass the cell wall to the damaged cell membrane. Moreover, isolates were tested at three drug concentrations only. Green et al. (3) used a 3.5-h overall incubation time to obtain their results. Plate colony counts were performed on culture inhibited by antifungals and showed, for example, that more than 90% of the cells were killed by a 3-hour exposure to amphotericin B but that only 30 to 40% of the yeast cells had incorporated PI into nucleic acid. Change in membrane potential has been used to define anti-fungal activity by using 3,39-dipentyloxacarbocyanine iodide,
[image:4.612.64.290.68.437.2]which fluoresces brightly green with only a 30-min incubation with viable yeast (10). Damaged yeast cells have an altered membrane potential and thus a lower mean channel of green fluorescence. These results have not been compared with the NCCLS broth macrodilution method. Wenisch et al. (19) de-veloped an antifungal assay measuring the metabolic activity with the dye FUN-1. Our method measures membrane integ-rity, which is the target of antifungal agents.
[image:4.612.316.558.87.423.2]FIG. 4. Histogram profiles ofC. albicansinduced by fluconazole after 4-h incubation. (A) Growth control; (B) subinhibitory concentrations; (C) inhibitory concentrations; (D) maximal inhibitory concentration. FS, forward scatter; LFL2, log fluorescence. SS, side scatter.
TABLE 1. MICs for 31C. albicansstrains determined by the NCCLS macrodilution and flow cytometry methods
Strain
MIC (mg/ml)
Amphotericin B Fluconazole NCCLS Flow NCCLS Flow 1 0.25 0.125 0.25 0.25
2 0.25 0.25 0.5 1.0
3 0.25 0.25 (0.25a
) 0.5 0.5 (0.5a
)
4 0.12 0.25 0.5 0.5
5 0.12 0.25 0.25 0.5
6 0.12 0.25 0.25 0.25
7 0.25 0.5 0.25 0.25
8 0.25 0.5 0.25 0.25
9 0.5 0.5 (0.5a
) 0.25 0.5 (0.5a
) 10 0.06 0.125 0.5 1.0 11 0.125 0.125 0.5 (1.0a
) 1.0 12 0.125 0.25 .64 128 (128a)
13 0.125 0.125 0.0625 0.125 14 0.125 0.125 0.125 0.5
15 0.03 0.06 0.5 1.0
16 0.125 0.25 16 (32a) 32 (32a)
17 0.125 0.125 0.25 0.5 18 (R-2659) 0.125 0.25 4.0 8.0 19 (94-1974) 0.125 0.125 (0.125a
) 32 (64a
) 16 (32a
) 20 (94-1937) 0.5 1.0 .64 64 (128a)
21 (94-1873) 0.25 0.25 (0.25a
) 8 (32a
) 8 (8a
) 22 (96-2264) 0.125 0.25 32 (64a) 32 (64a)
23 (96-2256) 0.125 0.125 .64 64 24 (96-2133) 0.125 0.125 .64 32 25 (96-2383) 0.25 0.25 .64 64 26 (96-2383) 1.0 0.5 0.5 0.5 27 (94-2073) 2.0 2.0 .64 64 28 (ATCC 24433) 0.12 0.12 (0.12a) 0.5 0.5 (0.5a)
29 (ATCC 90028) 0.25 0.25 (0.25a
) 0.25 0.5 (0.5a
) 30 (ATCC 64550) 0.25 (0.5a) 0.25 16 (8a) 16
31 (ATCC 64552) 1.0 1.0 0.5 (1.0a
) 0.5 (0.5a
)
a
Repeat assay.
TABLE 2. MICs for NCCLS-recommended quality control strains andC. lusitaniae
Strain
MIC (mg/ml)
Amphotericin B Fluconazole NCCLS Flow NCCLS Flow
C. parapsilosis ATCC 22019
0.25 (0.5a) 0.25 (0.25a) 2 (2a) 2 (2a)
C. krusei ATCC 6258
0.5 (0.5a) 0.5 (0.5a) 32 (64a) 32 (32a)
C. lusitaniae
Isolate 1 2 2 (2a) NDb ND
Isolate 2 2 2 (2a) ND ND
aRepeat assay. bND, not done.
on May 15, 2020 by guest
http://jcm.asm.org/
[image:4.612.316.556.576.709.2]We used sodium deoxycholate to enhance diffusion of PI across the cell wall to pass through the damaged yeast cell membranes. A complete range of antifungal drug concentra-tions was tested. The growth controls did not show dye uptake in the presence of deoxycholate. It has previously been shown that deoxycholate is nontoxic to C. albicans (5). Moreover, deoxycholate and PI are added at the end of incubation with the antifungal agent, and flow cytometric readings are taken almost immediately after. Our results were reproducible from day to day and comparable to the results obtained by the NCCLS macrodilution technique for all the 35 strains tested. Our method was validated by using isolates with high MICs to both antifungal agents tested. This flow-cytometric method is limited to testing antifungal agents that affect membrane in-tegrity. Performance may be different when additional drugs are tested and/or when other fungi are examined. However, other workers have found flow cytometry to be useful in the evaluation of nonrelated compounds with different modes of action (15, 19).
In summary, the present study shows that the flow cytometer can be used to provide rapid, comparable, and reproducible antifungal susceptibility testing results. The assay is simple and useful for research and clinical applications, providing precise MIC cutoff points. However, more extensive testing will be necessary to assess its value as a technique for routine antifun-gal susceptibility testing in the clinical microbiology laboratory.
ACKNOWLEDGMENTS
We thank M. Rinaldi and A. W. Fothergill (Fungus Testing Labo-ratory, University of Texas Health Science Center, San Antonio, Tex.) for providing 10 strains ofC. albicans. The skilled technical assistance of Sally Gromadzki and Ganesh Vasudevan is gratefully acknowl-edged.
REFERENCES
1.Bjerknes, R., C. Bassoe, H. Sjursen, O. D. Laerum, and C. O. Solberg.1989. Flow cytometry for the study of phagocyte functions. Rev. Infect. Dis.11:
16–33.
2.Donnelly, C. W., and G. J. Baigent.1986. Method for flow cytometric de-tection ofListeria monocytogenesin milk. Appl. Environ. Microbiol.52:689– 695.
3.Green, L., B. Petersen, L. Steimel, P. Haeber, and W. Current. Rapid determination of antifungal activity by flow cytometry. J. Clin. Microbiol.32:
1088–1091.
4.Jahn, B., E. Martin, A. Stueben, and S. Bhakdi.1995. Susceptibility testing ofCandida albicansandAspergillusspecies by a simple microtiter menadi-one-augmented 3-(4,5-dimethyl-2-thiazolyl)-2,5-diphenyl-2H-tetrazolium bromide assay. J. Clin. Microbiol.33:661–667.
5.Lehrer, R. I., and M. J. Cline.1969. Interventions ofCandida albicanswith human leucocytes and serum. J. Bacteriol.98:996–1004.
6.Martin, E., U. Schlasius, and S. Bhakdi.1992. Flow cytometric assay for estimating fungicidal activity of amphotericin B in human serum. Med. Microbiol. Immunol.181:117–126.
7.National Committee for Clinical Laboratory Standards.1986. Antifungal susceptibility testing: committee report, vol. 5, no. 17. National Committee for Clinical Laboratory Standards, Villanova, Pa.
8.National Committee for Clinical Laboratory Standards.1995. Reference method for broth dilution antifungal susceptibility testing for yeasts. Tenta-tive standard M27-T. National Committee for Clinical Laboratory Stan-dards, Villanova, Pa.
9.O’Gorman, M. R. G., and R. L. Hopfer.1991. Amphotericin B susceptibility testing of Candida species by flow cytometry. Cytometry12:743–747. 10. Ordonez, J. V., and N. M. Wehman.1995. Amphotericin B susceptibility of
Candidaspecies assessed by rapid flow cytometric membrane potential assay. Cytometry22:154–157.
11. Pfaller, M. A., M. G. Rinaldi, J. N. Galgiani, M. S. Bartlett, B. A. Body, A. Espinel-Ingroff, R. A. Fromtling, C. S. Halt, C. E. Hughes, F. C. Odds, and A. M. Sugar.1990. Collaborative investigation of variables in susceptibility testing of yeasts. Antimicrob. Agents Chemother.34:1648–1654. 12. Pfaller, M. A., C. Grant, V. Morthland, and J. Rhine-Chalberg.1994.
Com-parative evaluation of alternative methods for broth dilution susceptibility testing of fluconazole againstCandida albicans. J. Clin. Microbiol.32:506– 509.
13. Pfaller, M. A., S. A. Messer, and S. Coffmann.1995. Comparison of visual and spectrophotometric methods of MIC endpoint determinations by using broth microdilution methods to test five antifungal agents, including the new triazole D0870. J. Clin. Microbiol.33:1094–1097.
14. Pore, R. S.1990. Antibiotic susceptibility testing ofCandida albicansby flow cytometry. Curr. Microbiol.20:323–328.
15. Pore, R. S.1994. Antibiotic susceptibility testing by flow cytometry. J. Anti-microb. Chemother.34:613–627.
16. Ramani, A., A. Louie, R. Ramani, B. Breslin, G. Drusano, M. Shayegani, H. Taber, and M. H. Miller.1995. Comparison of micro and NCCLS macrodi-lution MICs withSemaxmodel to determine single and multiple drug activity
inCandida albicans, abstr. 73, p. 98.InProgram and abstracts of the 35th Interscience Conference on Antimicrobial Agents and Chemotherapy. American Society for Microbiology, Washington, D.C.
17. Rex, J. H., M. A. Pfaller, M. G. Rinaldi, A. Polak, and J. N. Galgiani.1993. Antifungal susceptibility testing. Clin. Microbiol. Rev.6:367–381. 18. Steen, H. B., E. Boye, K. Skarstad, B. Bloom, T. Giodal, and S. Mustafa.
1982. Applications of flow cytometry on bacteria: cell cycle kinetics, drug effects, and quantitations of antibody binding. Cytometry2:249–257. 19. Wenisch, C., K. F. Linnau, B. Parschalk, K. Zedtwitz-Liebenstein, and A.
Georgopoulos.1997. Rapid susceptibility testing of fungi by flow cytometry using vital staining. J. Clin. Microbiol.35:5–10.