6
I
January 2018
Studies of Glycine Dimethyl Urea Crystals Grown
By Aqueous Solution Method
U. Rajesh Kannan1, G.Narayanasamy1, S. Subramanian2, P.Selvarajan3
1
Department of Physics, Kamaraj College, Tuticorin-628003, Tamilnadu, India.
2
Department of Physics, MDT Hindu College, Tirunelveli-, Tamilnadu, India.
3
Department of Physics, Aditanar College of Arts and Science,Tiruchendur-628216, Tamilnadu, India.
Abstract: Glycine dimethyl urea single crystals were grown by aqueous solution method with slow evaporation technique. Let this crystal be called as GDMU crystal. The grown crystals were characterized chemically, structurally, thermally, optically and mechanically by various studies. X-ray diffraction analysis indicates the crystal system as monoclinic. The functional groups have been identified using Fourier transform infrared and FT-Raman spectral analyses. Optical transmittance studies reveal very low absorption in the entire visible region. The thermal stability of the title crystal was found by the TG/DTA analysis. Mechanical characterization was done by studying the variation of micro hardness with applied load. Solubility of the material was gravimetrically analyzed. The impedance analysis was performed for the sample to understand the electrical properties. Z-scan technique was employed to confirm the third order nonlinearity of the grown crystals. Its relative SHG efficiency has been tested by Kurtz powder method and it shows 1.145 times that of potassium dehydrogenate phosphate (KDP). The elements present in the sample were identified by EDAX method. Photoluminescence studies were carried out for GDMU crystal to identify the photo emission peaks and the results from the various studied were analyzed.
Keywords: Solution method; XRD; NLO ; FTIR ; FT-Raman; SHG; EDAX; Photoluminescence ; Hardness; TG/DSC, Impedance; Z-Scan; Spectroscopy
I. INTRODUCTION
Glycine is the smallest protein-forming amino acid and is widely used in various fields owing to its different applications. The polymorphism phenomenon exhibited by glycine constitutes one of its advantageous properties [1]. Among the six different polymorphs of glycine, alpha glycine, beta glycine and gamma glycine exist under ambient conditions [2]. Combination of amino acids like glycine with organic salts are the promising materials for optical second harmonic generation and also these materials are useful in laser technology, optical communication and optical data storage technology [3]. Balakrishnan et al. [4] grew single crystal of glycine zinc chloride by solution method and it was studied. Ravi et al.[5] studied the electron paramagnetic resonance of copper ions doped glycine zinc sulphate crystals at ambient temperature. Sodium glycine nitrate, glycine calcium dichloride, glycine calcium dibromide and glycine zinc chloride crystal structures were reported to be non-centrosymmetric [6–9]. The glycine sodium nitrate exhibits SHG comparable to that of KDP [10]. Three non-centro symmetric glycine coordinated compounds are reported by
Fleck and Bohaty [11]. Some complexes of glycine with HCl [12, 13.], lithium sulfate [14], H3PO3 [15], H2SO4 [16], CaNO3 [17],
CoBr2 [18], LiNO3 [19], H2SO4 [20, 21], sodium nitrate [22], benzoyl glycine [23] form single crystals, but some of these are
reported to have NLO properties and some are reported not to have NLO properties. In the recent past, several researchers have reported γ-glycine single crystals using different additives such as potassium bromide [24] lithium bromide [25]. Triglycine sulfate doped with sodium bromide [26] was reported in the recent past. Urea [27] acts as the a central player in crystal engineering and form many complexes and dimethyl urea form many complexes with cobalt(II) perchlorate, tetrafluoroborate and nitrate as reported
by Giannis S. Papaefstathiou et al. [28]. In this work, a new nonlinear optical material viz. glycine dimethylurea was synthesized
and single crystals were grown by slow evaporation solution growth technique at constant temperature from its aqueous solution and various studies have been carried out.
II. EXPERIMENTAL PROCEDURE
A. Synthesis, Solubility and Growth of the sample
powder of GDMU was dissolved thoroughly in double distilled water at 30oC to form saturated solution. The solution was kept in undisturbed conditions and maintained at room temperature. Transparent seed crystals were obtained after 10 days. The big sized crystals were obtained using seed immersion technique after 25 days. The harvested single crystals of the title compound are shown in figure 2 and the grown crystals are observed to be colourless and transparent. The dimensions of the grown crystal are about
15*7*5 mm3.
3 0 3 5 4 0 4 5 50 5 5 6 0
2 0 2 5 3 0 3 5 4 0 4 5 5 0
C
o
n
c
e
n
tr
a
ti
o
n
(
g
/1
0
0
m
l)
[image:3.612.195.421.155.312.2]T e m p e r a tu re (oC )
Fig. 1: Solubility curve of GDMU crystal
Fig. 2: Photograph of the grown GDMU crystals
B. Characterization Techniques
FTIR spectrum was recorded in the spectral range 400–4000 cm-1 using Shimadzu-8700 FTIR spectrometer and in this study the
sample was in pellet form in KBr phase. Single crystal X-ray diffraction study was carried out using ENRAF NONIUS FR 590 single crystal diffractometer. The thermal analysis was carried out using Perkin-Elmer simultaneous TG/DTA analyzer.
Microhardness stud was carried out using SHIMADZU HMV-2T fully automated hardness tester. The UV-visible absorption
[image:3.612.141.473.349.577.2]pressure Xenon lamp as an excitation source. The PL intensity is highly dependent on the crystallinity and structural perfection of the crystal. Hence the photoluminescence studies confirm the suitability of the grown material for near violet fluorescence emission studies. The single beam Z-scan is a well known technique for measuring the degenerate nonlinearities introduced and the basic idea behind the Z-scan technique is the self-focusing or self-defocusing.
III. RESULTS AND DISCUSSION
A. Single crystal X-ray diffraction analysis
The grown crystals of GDMU were subjected to single crystal X-ray diffraction studies using an ENRAF NONIUS CAD-4 X-ray Diffractometer with MoK radiation (λ = 0.7107 Å) to obtain the unit cell dimensions. The lattice dimensions of the grown specimen was determined from the single crystal XRD analysis using SHELX programme. From the measurement we found that the grown specimen belongs to monoclinic crystal system, having lattice dimensions
a = 5.235 (7) Å, b = 13.024(6) Å, c = 5.663(4) Å, = 90o, β = 108.57o, = 90o and volume V = 366.014(5) Å.
B. FTIR and FT-Raman spectral studies
Vibrational spectroscopy is an important tool for understanding the chemical bonding and the presence of various functional groups of a material. It also provides evidence for the charge transfer interaction between the donor and acceptor groups through electron movement. FT-Raman spectrum will give precise resolved intensities for some unresolved bands in the FTIR spectrum
[29]. FT-IR and FT-Raman spectra have been recorded for the grown crystal from 450-4000 cm-1 and 50-4000 cm-1 as shown in Fig.
3 and fig. 4, respectively. In the FTIR spectrum of grown crystal sample Fig. 3, the broad absorption band from 3000 to 3500 cm-1
include overlap of absorption peaks due to O–H stretch of COOH and N–H stretch of NH3+ of glycine molecule. The CH2 vibrations
which generally lie just below 3000 cm-1 are not clearly resolved in the FTIR spectrum. The broad absorption band in the above
range is due to the presence of hydrogen bonding. The COO- vibration of COOH lies around 1632 cm-1 and the CH2 bending mode
appears at 1333 cm-1 in FTIR spectrum. The torsional oscillation of NH3+ occurs nearly at 506 cm-1. Unresolved absorption bands in
the FTIR spectra are clearly resolved in the FT- Raman spectra. The FT-IR and FT-Raman assignments are given in accordance
with the reported spectral data [30, 31]. The observed frequencies and the tentative assignments of the Raman lines in comparison
with FTIR vibrations are given in table 1.
0 200 400 600 800 1000 1200 1400 1600 1800 2000 0 5000 10000 15000 20000 25000 (9 3 .5 8 ) (6 6 2 .6 6 ) (5 6 6 .5 7 ) (1 1 0 9 .9 9 ) (4 6 2 .6 2 ) (1 5 3 6 .8 1 ) (1 6 4 1 .2 9 ) (9 9 7 .1 1 ) (8 5 4 .8 4 ) (1285.85) (1 2 7 .1 7 ) (1 3 8 1 .9 4 ) (3 1 9 .3 4 ) R a m a n i n te n s it y (a .u ) Fig.4: FT-Raman spectrum of GDMU crystal
Table 1: Important wave numbers observed and their assignments of FTIR and FT-Raman spectra for GDMU sample
S.No. FTIR(cm-1) FT-Raman (cm-1) Band Assignments
12 3348.60 - N-H asymmetric stretching
3 2947.89 - CH2 stretching
2363.05 - Overtones
8 2121.87 - Combination band
9 1632.80 1641.29 Stretching of COO
-10 1577.14 1536 NH2 bending
12 1413.51 - COO- stretching
13 1333.76 1381.94 CH2 wagging vibration
14 1281.36 1285.85 CH2 twisting
17 1112.26 1109.99 NH2 deformation
19 910.06 997.11 CH2 rocking vibration
20 892.09 854.84 CCN symmetric stretching
21 774.75 - NH2 bend
22 696.819 - COO- wagging
23 607.444 - COO – system bending
24 505.68 COO- deformation
25 - 566.57 COO- in plane bending vibration
26 - 462.62 Torsional oscillation of NH3+
27 - 319.34 (CCN)
28 - 127.17 (CCN)
93.58 Lattice modes
C. UV-visible spectral studies
The optical absorption spectrum of the grown crystal has been recorded in the wavelength range of 200–800 nm at room temperature. The UV-Vis transmittance and absorbance spectra of GDMU crystal is shown in Figs.5 and 6. It is observed that the cut-off wavelength is at 240 nm and there is no absorption through the entire visible region and it is one of the most desired properties for the fabrication of optoelectronic devices. The transparent behaviour of glycine dimethylurea in the entire UV visible
[image:5.612.67.548.331.642.2]
where is the linear absorption coefficient and d is the thickness of the crystal. The reflectance spectrum of GDMU crystal is
presented in the figure 7 and it shows low reflectance in the entire visible region. The energy dependence of absorption coefficient suggests the occurrence of direct band gap of the crystal obeying the following relation
where Eg is the optical
band gap energy of the crystal, h is the Planck’s constant, ν is the frequency and A is a constant[32-34]. The plot of variation of (αℎυ)2 versus ℎυ is shown in figure 8 and the band gap energy is calculated by extrapolation of linear part. The band gap energy is found to be 5.2 eV.
200 400 600 800 1000 1200
0 20 40 60 80
T
ra
ns
m
it
ta
n
c
e
(%
)
Wavelength(nm)
200 400 600 800 1000 1200
0 20 40 60 80 100
%
A
Wavelength(nm)
Fig.5: UV–visible -NIR transmittance spectrum of GDMU crystal. Fig.6: UV–visible -NIR absorbance spectrum of GDMU crystal.
200 400 600 800 1000 1200
-50 -40 -30 -20 -10 0 10 20 30
%
R
Wavelength(nm)
1 2 3 4 5 6 7
0 2000 4000 6000 8000 10000 12000 14000 16000
(
h
)
2 e
V
2 m
2
h (eV)
D. Thermal Properties
Thermal studies are used to find the thermal stability, phase transition, endothermic and exothermic reactions that are taking place in the sample. The thermal stability of the crystal is an important factor for device fabrication. The TG/DSC analyses of GDMU crystal
have been carried out between room temperature (28˚C) and 800˚C at a heating rate of 10˚C per min and recorded TG/DSC curves
are shown in the figure 9. From the TG curve, it is observed that there is no weight loss upto 150˚C and the decomposition point of
the sample is noticed at 205 oC. From 200 to 280 ˚C, there is a weight loss of about 75% of the sample noticed from the results and
DSC curve supports this behavior. Beyond this temperature, the further stages of decomposition of the sample have occurred as observed exothermic transition in the DSC curve. From TG/DSC studies, it is confirmed that GDMU crystal is thermally stable upto 150 oC.
0 200 400 600 800 1000
0 20 40 60 80 100
DSC
Tem perature 0C
T
G
%
3 2 1 0 -1 -2 -3
TG
D
S
C
/m
W
/m
g
Fig. 9: TG/DSC thermal curves of GDMU crystal
E. Measurement Of Microhardness
Hardness is a measure of a material’s resistance to localized plastic deformation. It plays a key role in device fabrication [35]. The
hardness of the GDMU crystal is used for microhardness study. Before indentations, the crystal was carefully lapped and washed to avoid surface effects, which influence the hardness values. Indentations were made using a Vickers pyramidal indenter for various loads from 25 to 100 g. The measurement of the diagonal length was made at room temperature and the indentation time was 10 s. The Vickers hardness number of the crystal was calculated using the relationship Hv = 1.8544 P/ d2 where Hv is the Vickers
microhardness number, P is the applied load in kg and d is the average diagonal length of the impression in mm [36]. Fig. 10 shows
the variation Hv versus load (P). The results show that the hardness increases with increase of the applied load and hence the sample
has reverse indentation size effect. Using the Meyar’s relation P = a dn , the work hardening coefficient (n) can be determined.
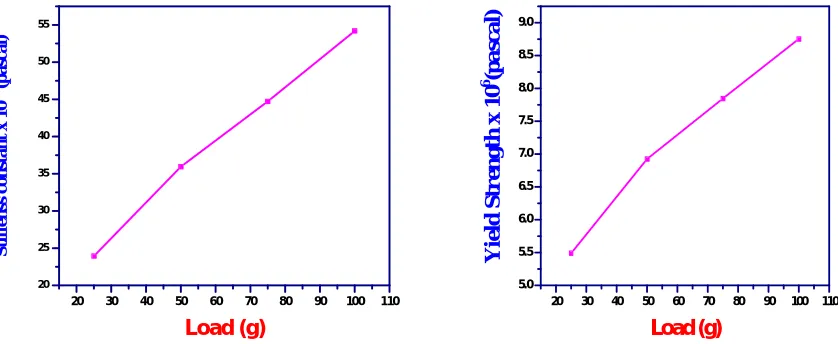
Here P is the load applied, a is a constant and d is the diagonal indentation length. The plot of log P versus log d is drawn and it is shown in the figure 11 from which the value of ‘n’ is obtained as 2.96783. From this value it is confirmed that GDMU crystal is soft material. Stiffness constant (C11) was calculated using the formula C11 = Hv7/4 where Hv is the microhardness of the material. The
plot of stiffness constant versus the load for the sample is presented in the figure 12. Yield strength of the material was found using the relation σy = Hv / 3. The variation of yield strength with the applied load for GDMU crystal is presented in the figure 13. From
[image:7.612.152.465.215.436.2]20 30 40 50 60 70 80 90 100 110 16 18 20 22 24 26 28 H V (k g // m m 2 ) Load (g)
1.75 1.80 1.85 1.90 1.95 2.00 1.3 1.4 1.5 1.6 1.7 1.8 1.9 2.0 n=2.96783 L o g ( P ) Log (d)
Fig.10: Plot of Vickers hardness versus applied load for GDMU crystal Fig 11. Plot of log d versus log P for GDMU crystal
20 30 40 50 60 70 80 90 100 110
20 25 30 35 40 45 50 55 S ti ff en ss c o n st a n t x 1 0 1
4 (
p a sc a l) Load (g)
20 30 40 50 60 70 80 90 100 110
[image:8.612.118.537.295.467.2]5.0 5.5 6.0 6.5 7.0 7.5 8.0 8.5 9.0 Y ie ld S tr en g th x 1 0 6 (p a sc a l) Load (g)
Fig. 12. Plot of stiffness constant and applied load for GDMU crystal Fig.13. Plot of yield strength versus applied load for GDMU crystal
F. Second Harmonic Conversion Efficiency
The SHG conversion efficiency of GDMU crystal was determined by the modified version of the powder technique developed by
Kurtz and Perry [37]. The crystal was ground into powder and densely packed between two transparent glass slides. A Nd:YAG
laser beam of wavelength 1064 nm was made to fall normally on the sample cell. The green light is finally detected by the Photomultiplier tube and displayed on the oscilloscope and the second harmonic signal was detected by a photomultiplier tube and displayed on a storage oscilloscope. The second harmonics signal, generated in the crystal was confirmed from the emission of green radiation by the crystal. The input laser energy incident on the powdered sample was chosen to be 0.70 J. The results obtained for GDMU crystal is shown in the table 2. From the results, it is found that the relative SHG efficiency of GDMU sample is 1.145 times that of the reference material (KDP).
Sl. No. Sample Code / Name
of the Sample
Output Energy ( milli joule)
Input Energy (joule)
3 GDMU 10.21 0.70
0.5 1.0 1.5 2.0 2.5 3.0 3.5 4.0 keV
0 10 20 30 40 50
cps/eV
C N O
Fig.14. EDX spectrum of GDMU crystal
G. Impedance Analysis
Impedance spectroscopy is a powerful technique for the characterization of electrical behaviour of the crystal. The electrical parameter such as impedance is a complex quantity and it has real part and imaginary part of impedance. Figure 15 shows the
variation of the real part of impedance (Z′) with frequency at various temperatures. It is observed that the magnitude of Z′ decreases
with the increase in frequency and it decreases with increase of temperature [38]. The variation of imaginary part of impedance (Z”)
with frequency is presented in the figure 16 and this value shows the relaxation behavior of the sample at different frequencies. The results show that the peak frequency (relaxation frequency) is getting shifted when the temperature of the sample increases. The Nyquist’s plot for GDMU crystal is shown in the figure 17. The semicircles for the different temperatures could be traced, indicating the increase in conductivity of the sample. All these curves start at almost same value and the peak maxima shifts to higher values of frequency with the increase in temperature [39]. The existence of grain boundary conduction of the sample has been observed. The value of bulk resistance (Rb) and grain boundary resistance (Rg) at different temperatures has been obtained
from the intercept of the semicircular arc on the real axis (Z’). The obtained values of bulk resistance (Rb) and grain boundary
resistance (Rg) of GDMU crystal are 8.25 x 10⁵ ohm and 3.75 x 10⁵ ohm respectively at 30 oC and these values of GDMU crystal
at 70 oC are 4.1 x 10⁵ ohm and 1.75 x 10⁵ ohm respectively.
-1 0 1 2 3 4 5 6
0 200000 400000 600000 800000 1000000 1200000 1400000
Z'(ohm)
Log f
30 oC
70 oC
-1 0 1 2 3 4 5 6
0 -100000 -200000 -300000 -400000 -500000
Z''
(ohm)
Log f
30 oC
70 oC
H. Impedance (Z’’) with frequency for GDMU crystal at 30o C and 70 o C
0 200000 400000 600000 800000 1000000 1200000 1400000
0 -100000 -200000 -300000 -400000 -500000
30oC
70o
C
Z
'' (
o
h
m
)
Z' (ohm)
Fig.17.Nyquist plots between Z’ and Z’’ for GDMU crystal at 30 o C and 70 o C
I. Photoluminescence (PL) studies
Photoluminescence spectroscopy is a contactless, non-destructive method of probing the electronic structure of materials. Light is directed onto a sample, where it is absorbed and imparts excess energy into the material in a process called photo-excitation. This excess energy will be dissipated by the sample through the emission of light, or luminescence. In the case of photo-excitation, this luminescence is called photoluminescence. The photoluminescence spectrum was recorded and is shown in figure 18. The PL measurements were carried out for the excitation wavelength of 275 nm. The emission spectrum was measured in the range 300 – 575 nm. The strong luminescence peak at 475 nm was observed in the emission spectrum. The result indicates that the GDMU crystal has bluish green emission [40]. The PL intensity is highly dependent on the crystallinity and structural perfection of the crystal.
300 350 400 450 50 0 55 0 60 0 6 50
0 1000000 2000000 3000000 4000000 5000000 6000000 7000000 8000000 9000000
In
te
n
s
it
y
(a
.u
.)
W av ele ng th(n m )
Fig.18: Photoluminescence spectrum of GDMU crystal.
J. Z-Scan Measurement
transmittance change through a small aperture at the far field position (closed aperture), one is able to determine the amplitude of the phase shift. By moving the sample through the focus and without placing an aperture at the detector (open aperture) one can measure the intensity dependent absorption of the sample [41]. When both the methods (open and closed) are used for the measurements, the ratio of the signals determines the nonlinear refraction of the sample. The third-order nonlinear refractive index
(n2) and the nonlinear absorption coefficient of grown GDMU crystal were calculated by using Z-scan technique. The
sample causes an additional focusing and defocusing depending on positive or negative values of nonlinear refractive index [42].
The open aperture and closed aperture Z-scan curves are shown in the figures 19 and 20. Using the equations as reported in the literature [43], the third order nonlinear optical parameters are found. For GDMU crystal, the obtained values of nonlinear refractive index is -4.731 x 10⁻¹¹ m2/W , nonlinear absorption coefficient is 5.738 x 10⁻⁴ m/W and nonlinear susceptibility is 8.260 x 10⁻⁷ esu. Since the closed Z-scan curve (Fig.20) shows peak to valley behavior, GDMU crystal has negative nonlinear refractive index which indicates the self-defocussing nature of the sample.
1 2 3 4 5 6 7 8 9 10
14 15 16 17 18 19 N o r m a li se d t ra n sm it ta n ce ( a rb .u n it s )
Z (mm)
0 2 4 6 8 10 12
15.5 16.0 16.5 17.0 17.5 18.0 18.5 19.0 19.5 N a rm a lis e d t ra n s m it ta n c e (a rb .u n it s )
Z mm
Fig.19: Z-scan open aperture curve for GDMU crystal Fig.20: Z-scan closed aperture curve for GDMU crystal
IV. CONCLUSION
Optically transparent and colourless crystals of GDMU were grown by aqueous solution method with slow evaporation technique. The crystal system and crystalline nature of the synthesized material was analyzed by single crystal XRD study. The crystal system of the sample is found to be monoclinic. The presence of various functional groups of the grown crystal was confirmed by FTIR and FT-Raman spectral analysis. UV-visible spectrum of the grown crystal shows low absorbance with cut-off wavelength at 240 nm. Bluish-green emission was observed by photoluminescence spectrum. The SHG relative efficiency of the material was found by Kurtz powder technique. Thermal stability of the grown crystal was studied by TG/DSC analysis and thermal stability of GDMU
crystal is found to be upto 150 oC. The Vickers hardness value increases with increasing of load and other mechanical parameters
such as yield strength and stiffness constant for GDMU crystal were determined. Third order nonlinear optical parameters of GDMU crystal were found by Z-scan technique. The electrical parameters such as impedance, bulk resistance and grain boundary resistance of the sample were analyzed. The various elements present in the grown crystal of GDMU were identified by EDX method.
V. ACKNOWLEDGEMENTS
REFERENCES
[1] Z H. Ansari, Y. Zeng, Y .Zhang, G P. Demopoulos, “The growth rates of α- and γ-glycine in basic and acidic aqueous glycine solutions”, Journal of. Crystal. Growth, Vol. 467, pp. 116-125, 2017.
[2] R E. Vizhi, C. Yogambal, “Investigations on the growth and characterization of gamma-glycine single crystal in the presence of sodium bromide”, Journal of Crystal Growth, Vol.452, pp.198-203, 2016
[3] D S .Chemla, J. Zyss, “Nonlinear Optical Properties of Organic Molecules and Crystals”, Academic Press, New York. 1987.
[4] T. Balakrishnan, K. Ramamurthi, “Structural thermal and optical properties of a semiorganic nonlinear optical single crystal: Glycine zinc sulphate”, Spectrochimica Acta Part A, Vol.68, 360–363, 2007.
[5] S .Ravi, P .Subramanian, “EPR study of Cu 2+ in glycine zinc sulphate single crystal”,Solid State Communications, Vol.143, pp. 277-279, 2007
[6] Meena Hariharan , S. Rajan, R. Srinivasan , S. Natarajan, “Crystal structure of a complex of glycine with zinc chloride”, Z.Kristallogr,Vol. 188,pp. 217-222, 198
[7] RV. Krishnakumar, M. Subha Nandhini, S .Natarajan, K .Sivakumar, B. Varghese, “Glycine sodium nitrate”, Acta. Crystallographica, Vol.57, pp. 1149, 2001 [8] S. Natarajan, K. Ravikumar, S S. Rajan, “Crystal structure of glycine with zinc chloride”, Z. Kristallogr,Vol. 188, pp. 217-22, 1989
[9] M D. NAggarwal, J .Choi, W. S.Wang, K .Bhat , R. B. Lal, A. D .Shields , B .Penn , D. Frazier, Solution growth of a novel nonlinear optical Growth,Vol. 204,pp. 179-182, 1999.
[10] M .Narayan Bhat, S .M .Dharmaprakash, “New nonlinear optical material of glycine sodium nitrate”, Journal of Crystal Growth, Vol. 235,pp. 511-516, 2002. [11] M. Fleck, L. Bohaty, “three novel non-centrosymmetric compounds of glycine: glycine lithium sulfate, glycine nickel dichloride dihydrate and glycine zinc
sulfate trihydrate Acta Crystallo graphica Section”, Crystal Structure Communications Acta Cryst, Vol. 60, pp.291-295, 2004.
[12] L.I. Hung-Wen, G. U .Shen, Y.U .Herbert, L.Strauss , “Vibrations of the Amino Group in Glycine Hydrochloride Spectral hole Burning and Isotope Shifts”, Journal. Phys. Chem. B, Vol. 102, pp.298-302, 1998.
[13] B.Narayana Moolya, S.M. Dharmaprakash,”nonlinear optical diglycine hydrochloride Synthesis crystal growth and structural characteristics”, Journal of crystal growth, Vol. 293, pp. 86-92, 2006
[14] T. Balakrishnan, K. Ramamurthi, “L-Asparagine doped TGSP crystals”, Crystal. Res. Technol, Vol.41, 712 –717, 2006.
[15] M. Senthil Pandian, P .Ramasamy, “Growth and characterization of solution-grown tetra glycine barium chloride (TGBC) single crystals”, Journal of Crystal Growth, Vol. 310, pp. 2563–2568, 2008
[16] S. Hoshino,Y. Okaya, R. Pepinsky, “Crystal structure of the ferroelectric H2SO4” ,Phys. Rev,Vol.115,pp. 323-330, 1959.
[17] S. Natarajan, K. Ravikumar, S.S. Rajan, “Crystal structure of diaqua nitrato glycine calcium (II) nitrate”, Z. Kristallogr,Vol. 168,pp. 75-82, 1984.
[18] K. Ravikumar,S.S. Rajan , Z. Kristallogr ,“Crystal growth, morphology, spectrographic characterization and thermal properties of Glycine Barium Bromo Chloride Crystals”, International journal of Engineering Research and Applications,Vol. 171,pp. 201-207, 1985
[19] B. Gustav. Albrecht, Robert Corey, “The Crystal Structure of Glycine”, Journal of American chemical Society, Vol. 61, pp. 1087–1103, 1939
[20] R. Muralidharan, R. Mohankumar , P.M. Ushasree, R. Jayavel , P. Ramasamy,“ Growth and Crystallization and Characterization of Triglycine Sulfate(TGS)”, Crystal Journal of Crystallization Process and Technology, Vol.234,pp. 545-550, 2002
[21] H.S. Nagaraja, V. Upadhyaya, P. Mohan Rao, S. Aithal, A. P. Bhat, “Organic nonlinear optical crystals of benzoyl glycine”, Journal of Crystal Growth, Vol. 193, pp. 674-678, 1998
[22] T. Balakrishnan, R. Ramesh Babu, K. Ramamurthi,” Growth, Structural, Optical and Thermal properties of γ – Glycine Crystal”, Spectrochimica Acta Part A: Molecular and Biomolecular Spectroscopy A,Vol. 69,pp. 1114-1118, 2008.
[23] N. Theresita Shanthi, P. Selvarajan, C.K. Mahadevan, “Studies on Triglycine Sulfate (TGS) Crystals Doped with Sodium Bromide (NaBr) Grown by Solution Method”, Indian Journal of Science and Technology, Vol. 2, pp. 49-52, 2009
[24] P.S .Corbin, S.C .Zimmerman, P.A. Thiessen, N.A Hawryluk, T.J. Murray,“Design, Synthesis, and Structural Investigation of Nucleobase Functionalized .Beta peptides”, American chemical Society. Soc,Vol.123,pp. 10475-88, 2001.
[25] D. Balasubramanian , P. Murugakoothan , “Synthesis, growth and characterization of organic nonlinear optical bis-glycine maleate (BGM) single crystals”, Journal of Crystal Growth,Vol. 312,pp.1855, 2010
[26] P. Anandan Parthipan , P.G. Saravanan , G.T. Mohan Kumar ,R. Bhagavannarayana ,G. Jayavel , “Crystal growth, Structural and Optical Characterization of a semi-organic single crystal for frequnecy conversion applications”, Physica B: Condensed Matter,Vol. 405,pp. 49-51, 2010
[27] S. Sirohi, T.P.Sharma, “Bandgaps of cadmium telluride sintered film”, opt mater, Vol.13.pp. 267-269, 1999
[28] Nakamoto Infrared and Raman Spectra of Inorganic and Coordination Compounds, john Wiley & Sons. New York 3, 1978
[29] P. Yasotha, R. Thiagarajan, P. Sagunthala, “Growth Structure and Optical Studies of Undoped and Potassium Nitrate Doped Glycine Single Crystals”, International Journal of Chemical and Physical Sciences,Vol. 4,pp. 6, 2015.
[30] S. Suresh, D. Ravioli, J. Minerals, “The growth and characterization studies of γ-glycine”, Materials Characterization & Engineering, Vol.6, pp. 517- 526, 2011.
[31] T. Mallik, T. Kar Optical, “Thermal and structural characterization of an NLO crystal, L-arginine perchlorate”, Journal of Crystal. Growth, Vol. 274, pp. 251-255, 2005.
[32] B.W. Mott, Micro Indentation Hardness Testing, Butter worth’s, London 206, 1956.
[33] J.B.Charles, F.D. Gnanam, “An organic material of a noncentrosymmetric l-threonine single, crystal”, Journal of material science letter, Vol. 12, pp. 1395, 1993.