5
X
October 2017
often cited as main contributor to the rice production and accounts for 20% of the world’s total production. The amount of hectares in India under rice cultivation is as high as 40 million hectares in 20 states. India is also the largest exporter of rice in the world crossing 100 million tones. The sustainability and productivity of rice growing areas is dependent on suitable climatic conditions. Developing better techniques to predict crop productivity in different climatic conditions can assist farmer and other stakeholders in better decision making in terms of agronomy and crop choice. To predict the crop yield in future accurately, Random Forest, a most powerful and popular supervised machine learning algorithm is used.
Keywords: Crop Analysis; Crop Yield; Machine learning; Prediction; Random Forest.
I. INTRODUCTION
Andhra Pradesh is one of top ten rice producing states in India that has a share of 12% in total production of rice in India. Quantifying the yield gap is thus essential to inform policies and prioritize research to achieve food security without environmental degradation [8]. Rice is mainly grown in rain fed areas that receive heavy annual rainfall. That is why it is fundamentally a Kharif crop in India. It demands temperature of around 25 degree Celsius and above and rainfall of more than 100 cm. Rice is also grown through irrigation in those areas that receives comparatively less rainfall. Higher temperatures can decrease rice yields as they can make rice flowers sterile, meaning no grain is produced. Rice requiresmple water to grow [2]. Rainless days for a week in upland rice-growing areas and for about two weeks in shallow lowland rice-growing areas can significantly reduce rice yields. Average yield reduction in rain fed, drought prone areas have ranged from 17 to 40% in severe drought years, leading to production losses and food scarcity.
Machine learning techniques [16] can be used to improve prediction of crop yield under different climatic scenarios [6][7]. This paper presents the use of a versatile machine learning technique for Indian rice cropping areas.
II.RELATED WORK
Support Vector Machines (SVMs) a supervised machine learning technique. There are a number of examples of where it has been used in the agricultural domain. Tripathi et al., (2006) reported on how SVM was applied for reduction of precipitation for climate change scenarios [9]. To minimize the generalization error bound and to achieve generalized performance, SVM was used to forecast the demand and supply of pulp wood [10]. SVM was also applied to provide insights into crop response patterns related to climate conditions by providing the features contribution analysis for agricultural yield prediction [11]. For classification of agricultural datasets the use of discretization based Support Vector Machine was used [12]. Huang et al., (2010) reported the use of SVM to model urban land use conversion. This study reported a relationship between various factors and rural-urban land use [13]. SVM has also been applied for the estimation of crop biophysical parameters with the use of aerial hyper spectral observations [14].
III. RESEARCH METHODOLOGY
This section discusses the methodology used for this research and gives the details of the study area, datasets.
A. Study Area
Figure 1: Area of Study – Andhra Pradesh B. Dataset Used
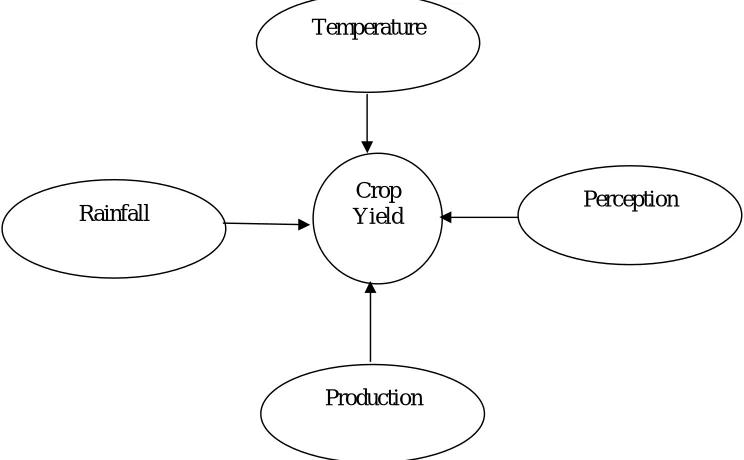
All the datasets used in the research were sourced from the openly accessible records of the Indian Government. This was sourced for the years 2005 to 2015 for different seasons like Kharif and Rabi of rice production. From the vast initial dataset, only a limited number of important factors which have the highest impact on agricultural yield were selected for the present research. Figure 2 below shows the parameters selected for the present study.
1) Rainfall (mm): The total precipitation for Kharif and Rabi seasons for each year of every district.
2) Maximum Temperature (degree Celsius): Crop production will definitely have an impact due to variation in the temperature. Hence maximum temperature for each year of every district was considered for the present research.
3) Rice Production (Tonnes): The rice cultivated area in Hectares and production in tonnes for Kharif and Rabi seasons for every year in each selected district of Andhra Pradesh state was considered for the present research.
4) Perception: Perception data for every year in each selected district of Andhra Pradesh was considered for accurate yield prediction.
Figure 2: Shows the attributes considered for predicting the crop yield Temperature
Production
Perception Rainfall
[image:3.612.112.484.472.702.2]IV. PERFORMANCE EVALUATION
RF classifier can be described as the collection of tree-structured classifiers..It is an advanced version of bagging [21] such that randomness is added to it. Instead of splitting each node using the best split among all variables, RF splits each node using the best among a subset of predictors randomly chosen at that node. A new training data set is created from the original data set with replacement. Then, a tree is grown using random feature selection. Grown trees are not pruned [22][21]. This strategy makes RF unexcelled in accuracy [23] when compared to other existing algorithms including discriminant analysis, support vector machines and neural networks [2] [25]. RF is also very fast, it is robust against over fitting, and it is possible to form as many trees as the user wants needs [23]. Two parameters must be defined by user to initialize RF algorithm. These parameters are N and m, which are the number of trees to grow and the number of variables used to split each node, respectively. First, N bootstrap samples are drawn from the 2/3 of the training data set. Remaining 1/3 of the training data, also called out-of-bag (OOB) data, are used to test the error of the predictions. Then, an un-pruned tree from each bootstrap sample is grown such that at each node m predictors are randomly selected as a subset of predictor variables, and the best split from among those variables is chosen. It is crucial to select the number of variables that provides sufficiently low correlation with adequate predictive power [24]. Breiman suggests that setting number of variables (m) equal to the square root of M (number of overall variable) gives generally near optimum results. RF uses Classification and Regression Tree (CART) algorithm to create the trees [21]. At each node, split is performed according to a criterion (e.g. GINI index) in CART algorithm. In this study, GINI index is utilized to perform the split. The GINI index measures class homogeneity and can be written as the equation below [1]:
where T is a given training set, Ci is the class that a randomly selected pixel belongs to. Only one class is present at each terminal node [Watts et al., 2011]. Once all N trees are grown in the forest, the new data is predicted based on the outcome of the predictions of N trees [25].
V. EXPERIMENTAL RESULTS
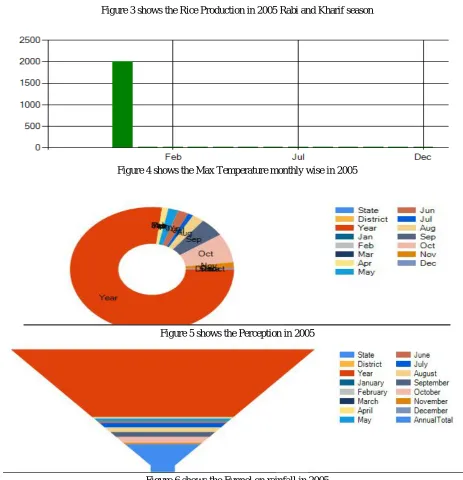
Figure 3 shows the Rice Production in 2005 Rabi and Kharif season
Figure 4 shows the Max Temperature monthly wise in 2005
[image:5.612.69.532.241.721.2]Figure 5 shows the Perception in 2005
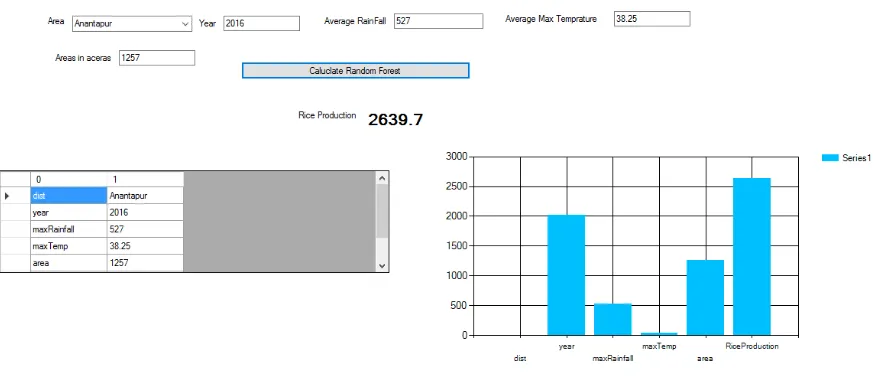
Figure 7: Random Forest Prediction of Crop Yield in Hectares for year 2017
VI. CONCLUSION
In recent years, great efforts have been undertaken on the challenging task of predicting rice crop yield. Developing accurate models for crop yield estimation using Information and Communication Technologies may help farmers and other stakeholders improve decision making in relation to national food import/exports and food security[3][4]. Rice is one of the most important food crops of India. It is cultivated all over the country and contributes more than 40% of total food grain production [18]. Given the importance of rice to world’s food security, any improvements in the forecasting of rice crop yield under different climatic and cropping scenarios will be beneficial [5]. This research has demonstrated the prediction of rice crop yield by applying one of the machine learning technique, Random Forest (RF).
This study examines the performance of the RF and MLC methods. RF method improves the overall accuracy over MLC method. The highest overall accuracy of 85.89% is obtained for the RF method, which is higher 8% than the corresponding MLC result. These promising results can be explained by the well-built algorithm of the RF method. It is also worthy noticed that similar results are achieved when different parameter combinations are tested for the RF method, which indicates the consistency of the RF classification algorithm. In conclusion, it can be stated that the RF method can be a reliable way to produce crop yield in high accuracies for agricultural lands.
REFERENCES
[1] R. Medar, V. Rajpurohit, “A survey on data mining techniques for crop yield prediction”, International Journal of Advance Research in Computer Science and
Management Studies, vol. 2, no. 9, pp. 59-64, 2014.
[2] S. Bejo, S. Mustaffha and W. Ismail, “Application of artificial neural network in predicting crop yield: A review”, Journal of Food Science and Engineering,
vol. 4, pp.1-9, 2014.
[3] S. Dahikar and S. Rode, “Agricultural crop yield prediction using artificial neural network approach”, International Journal of Innovative Research in Electrical, Electronics, Instrumentation and Control Engineering, vol. 2, no. 1, pp. 683-686, 2014.
[4] W. Guo and H. Xue, “An incorporative statistic and neural approach for crop yield modelling and forecasting”, Neural Computing and Applications, vol. 21,
pp. 109-117, 2012.
[5] W. Guo and H. Xue, “Crop yield forecasting using artificial neural networks: A comparison between spatial and temporal models”, Mathematical Problems in
Engineering, pp.1-7, 2014.
[6] D. Ramesh and B. Vardhan, “Analysis of crop yield prediction using data mining techniques”, International Journal of Research in Engineering and
Technology, vol. 4, no. 1, pp. 47-473, 2015.
[7] K. Tanaka and T. Kiura, “Crop yield prediction systems for rainfed areas and mountainous areas in Thailand”, Proceedings of the 9th Conference of the Asian
Federation for Information Technology in Agriculture “ICT’s for future Economic and Sustainable Agricultural Systems”, 2014.
[8] G. Yengoh and J. Ardo, “Crop yield gaps in Cameroon”, AMBIO, Springer, vol. 43, pp. 175-190, 2014.
[9] S. Tripathi, V.V. Srinivas and R.S. Nanjundiah, “Downscaling of precipitation for climate change scenarios: a support vector machine approach”, Journal of
[10] V. Anandhi and R.M. Chezian, “Support vector Regression in forecasting”, International Journal of Advanced Research in Computer and Communication Engineering Vol. 2, no. 10, October 2013
[11] A. Bharadwaj, S. Dahiya, and R. Jain, “Discretization based Support Vector Machine (D-SVM) for Classification of Agricultural Datasets”, International Journal of Computer Applications, vol. 40, no. 1, pp.8-12, 2012.
[12] B. Huang, C. Xie, and R. Tay, “Support vector machines for urban growth modeling” Geoinformatica, vol. 14, no. 1, pp.83-99, 201
[13] Y. Karimi, S.O. Prasher, A. Madani, A. and S. Kim, “Application of support vector machine technology for the estimation of crop biophysical parameters using aerial hyperspectral observations”, Canadian Biosystems Engineering, vol. 50, no. 7, pp.13-20. 2008
[14] Report on Economic Survey of Maharashtra 2012-2013, Directorate of Economics and Statistics, Planning Department, Government of Maharashtra, Mumbai
(2013)
[15] Weka 3:Data Mining Software in Java, Machine Learning Group at theUniversity of Waikato, Official Web: http://www.cs.waikato.ac.nz/ml/weka/index.html,
accessed on 26th March 2016
[16] C. Saunders, M.O. Stitson, J. Weston, L. Bottou, and A. Smola, Support vector machine-reference manual, 1998
[17] Gain Report on Global Agricultural Information Network, India Grain and Feed Annual, USDA Foreign Agricultural Service (2014).
[18] N.Gandhi, L.J. Armstrong and O. Petkar, “Predicting Rice Crop Yield using Bayesian Networks”, communicated, 2016.
[19] N.Gandhi, L.J. Armstrong and O. Petkar, “Rice Crop Yield Prediction in India using Artificial Neural Network”, International Conference on 2016IEEE
Technological Innovations in ICT for Agriculture and Rural Development (TIAR), Chennai, India scheduled on 15th and 16th July 2016
[20] Breiman, L. (2001). Random forests. Machine learning, 45(1), 5-32.
[21] Archer, K. J., & Kimes, R. V. (2008). Empirical characterization of random forest variable importance measures. Computational Statistics & Data Analysis, 52(4), 2249-2260
[22] Bureau, A., Dupuis, J., Falls, K., Lunetta, K. L., Hayward, B., Keith, T. P., & Van Eerdewegh, P. (2005). Identifying SNPs predictive of phenotype using random forests. Genetic epidemiology, 28(2), 171-182
[23] Horning, N. (2010). Random Forests: An algorithm for image classification and generation of continuous fields data sets. New York.