R E S E A R C H
Open Access
Gene-specific patterns of expression
variation across organs and species
Alessandra Breschi
1,2, Sarah Djebali
1,2,3, Jesse Gillis
4, Dmitri D. Pervouchine
1,2, Alex Dobin
4,
Carrie A. Davis
4, Thomas R. Gingeras
4and Roderic Guigó
1,2*Abstract
Background: A comparison of transcriptional profiles derived from different tissues in a given species or among different species assumes that commonalities reflect evolutionarily conserved programs and that differences reflect species or tissue responses to environmental conditions or developmental program staging. Apparently conflicting results have been published regarding whether organ-specific transcriptional patterns dominate over species-specific patterns, or vice versa, making it unclear to what extent the biology of a given organism can be extrapolated to another. These studies have in common that they treat the transcriptomes monolithically, implicitly ignoring that each gene is likely to have a specific pattern of transcriptional variation across organs and species.
Results: We use linear models to quantify this pattern. We find a continuum in the spectrum of expression variation: the expression of some genes varies considerably across species and little across organs, and simply reflects
evolutionary distance. At the other extreme are genes whose expression varies considerably across organs and little across species; these genes are much more likely to be associated with diseases than are genes whose expression varies predominantly across species.
Conclusions: Whether transcriptomes, when considered globally, cluster preferentially according to one component or the other may not be a property of the transcriptomes, but rather a consequence of the dominant behavior of a subset of genes. Therefore, the values of the components of the variance of expression for each gene could become a useful resource when planning, interpreting, and extrapolating experimental data from mouse to humans.
Keywords: RNA-seq, Comparative transcriptomics, Gene expression, Clustering, Vertebrate, Organ, Species
Background
The laboratory mouse has been the top choice organ-ism to model human physiology and disease for decades. The underlying assumption is that the molecular, cellu-lar, and developmental pathways are essentially conserved between human and mouse, and, in general, among pla-cental mammals. The architecture of these pathways is broadly reflected in cellular, tissue, and organ transcrip-tomes. Therefore, transcriptome comparisons across mul-tiple homologous organs between human and mouse, or across multiple mammalian (or vertebrate) species, have been extensively carried out. Early studies concluded that
*Correspondence: [email protected]
1Centre for Genomic Regulation (CRG), The Barcelona Institute of Science and Technology, Dr. Aiguader 88, 08003 Barcelona, Spain
Full list of author information is available at the end of the article
transcriptional patterns are more similar between homol-ogous organs of different species than between different organs from the same species [1–5], supporting, in prin-ciple, the use of the mouse as a model of human biol-ogy. Recent results have suggested, however, that these observations may arise from the analysis of a relatively small number of organs that exhibit a disproportionately large number of organ-specific genes. Indeed, by includ-ing a larger panel of organs in the analysis, Lin et al. [6] show that transcriptional patterns have overall diverged substantially between human and mouse, separating the species more than the organs. This has led to a highly charged debate [7].
In most cases, the conclusions are essentially of a qualitative nature, obtained after visually inspecting the projection of the transcriptome samples into a space of reduced dimension. Indeed, each transcriptome can be
Breschiet al. Genome Biology (2016) 17:151 Page 2 of 13
represented as a point in an n-dimensional space, its coordinates corresponding to the expression values of n genes (in human–mouse comparisons, n is typically around 15,000, the number of orthologous protein-coding genes between the two species). Dimensionality reduc-tion is often obtained using principal component analysis (PCA) or related techniques. In PCA, the original values (gene expression levels) are linearly transformed into a set of uncorrelated variables called principal components (PCs). This transformation is defined in such a way that the first PC has the largest possible variance, and each succeeding component has the highest variance possible under the constraint that it is orthogonal to the preceding components. Typically, the two or three first components are chosen and the samples (transcriptomes) are plotted in the corresponding two- or three-dimensional space. The debate is usually centered on whether the samples projected into this space of reduced dimension visually cluster by species [6, 8, 9] or by organ [1–3, 10]. Visual analysis, however, is qualitative in nature, and therefore, has a strong subjective component. To produce, instead, a quantitative criterion, and to avoid, at the same time, the information loss implicit in dimensionality reduction methods, we used here the modularity of the correla-tion network of the transcriptome samples with respect to the partition of the set of samples, either by organ or by species.
Moreover, the approach above implicitly assumes an average behavior for genes, ignoring that each gene may have a specific pattern of expression variation across organs and species. In fact, we recently showed [11], using transcriptome comparisons of a large collection of human cell lines and mouse organs, that a substantial fraction of genes exhibits constrained expression simultaneously across organs and species within vertebrates. These genes are likely to contribute little to the clustering of tran-scriptomes in either direction. On the other hand, among the genes whose expression is unconstrained, some may exhibit transcriptional patterns that vary mostly across organs or mostly across species. We previously used linear models to quantify, for each gene, the relative contri-bution of these two factors (species and organ) to the variation of expression of each individual gene, comparing human and mouse organs [12]. However, since we used only two species, the estimates of variance across species were unreliable. Here, we extend this approach by analyz-ing previously published transcriptional data in matched samples from six orthologous organs in seven vertebrate species [2]. Using linear models, we quantify, for each gene, the amount of expression variation that originates from variation across organs and from variation across species.
We find that a large fraction of the variance in gene expression (about 70 % on average) can be explained by
either organ or species, with the contribution of organ, on average, being larger than that of species. However, we find strong differences between genes in their pattern of expression variation. Genes whose expression varies con-siderably across species and little across organs lead, as expected, to a species-dominated clustering. These genes exhibit features characteristic of housekeeping genes, and divergence of their expression essentially reflects evo-lutionary distance. Genes whose expression varies con-siderably across organs and little across species lead, in contrast, to an organ-dominated clustering. These genes should be specific to a few organs and be essential for their function. Using the projection score [13], we found that a small subset of these genes neatly reproduces the clustering obtained when using all genes. For these genes, animal (and, in particular mouse) models may be particu-larly appropriate. Interestingly, we found that these genes are much more likely to be associated with diseases than genes whose expression varies considerably across species but little across organs.
Results and discussion
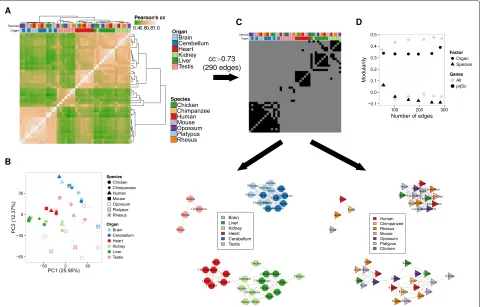
We used gene expression values estimated by RNA-seq in a panel of six organs in seven different vertebrate species from [2]. We restricted the analyses to the set of 6283 protein-coding genes that could be identified as orthologs across the seven species (“Methods”) and used log-transformed expression values, originally com-puted as cRPKMs, a slightly modified version of the more common RPKM measure, which considers only reads mapping to orthologous genes [2]. Using PCA and hier-archical clustering, we found that if the transcriptomes are considered globally, the samples cluster preferentially by organ (Fig. 1a, b). To quantify the visual interpre-tation of the clustering/PCA and to overcome the loss of information implicit in this interpretation, we carried out a modularity analysis [14]. Given a network and a grouping of nodes, the modularity measures the degree to which nodes are preferentially connected within the groups (Fig. 1c and “Methods”). Modularity is calculated as the excess number of edges compared to randomly con-nected nodes, divided by the total number of edges (see “Methods”). In our case, modularity is computed on the network constructed from gene expression correlations between samples when the data is grouped by organ or by species. Grouping by organ yields higher modularity than grouping by species, robustly for any threshold on the correlation defining the network edges (Fig. 1d).
Fig. 1Hierarchical clustering (a) and PCA (b) based on the expression of 6283 orthologous genes in six organs from seven species show a predominant clustering of organs. Gene expression is computed as log10-normalized cRPKM, with a pseudocount of 0.01. Pearson’s correlation coefficient is computed for each pair of samples. The distance metric used for clustering is again Pearson’s correlation coefficient, and a complete linkage algorithm is applied to the Pearson’s correlation coefficients between each pair of samples. PCA was performed on the same log10-normalized cRPKM, after centering and scaling the expression of each gene across all samples.cExample of a network built from the pairwise correlation coefficients (top). In such a network (bottom), samples are nodes, and edges are drawn when two samples have a correlation coefficient higher than a given threshold (0.73 in the example, which gives 290 edges, as in the last point ofd). Network nodes are colored either by organ (left) or species (right), which are the factors used to compute the modularity (see “Methods”).dModularity analysis for the network of gene expression correlations made from six tissues and seven species. The modularity is given as a function of the number of edges in the network, when vertex type is organ (circle) or species (triangle), and when the genes considered are all genes (gray) or only the projection score genes (black).cccorrelation coefficient,
PCprincipal component,PCAprincipal component analysis,prjScprojection score
large number of organ-specific genes. We re-analyzed Lin’ et al. data using modularity. When restricting to the five organs in common with the dataset in Barbosa-Morais et al. [2] (brain, liver, kidney, heart, and testes), which are the organs with a higher number of organ-specific genes in Lin et al., organ modularity was indeed higher than species modularity (Additional file 1: Figure S1A). However, when using instead the five organs that in Lin et al. have fewer organ-specific genes, species mod-ularity was higher than organ modmod-ularity (Additional file 1: Figure S1B), supporting clustering by species. This, indeed, suggests that global transcriptome clustering by organ or species depends on the organs considered (as also recently reported by Sudmant and colleagues [15]). While Lin et al. used a more extensive set of genes (around 15,106 genes), as they only required orthology between
human and mouse, the results are comparable to those obtained when using only the vertebrate orthologs of the Barbosa-Morais study [2], even though these genes are likely to be more conserved (Additional file 1: Figure S2A, B).
[image:3.595.60.540.87.394.2]Breschiet al. Genome Biology (2016) 17:151 Page 4 of 13
A
B
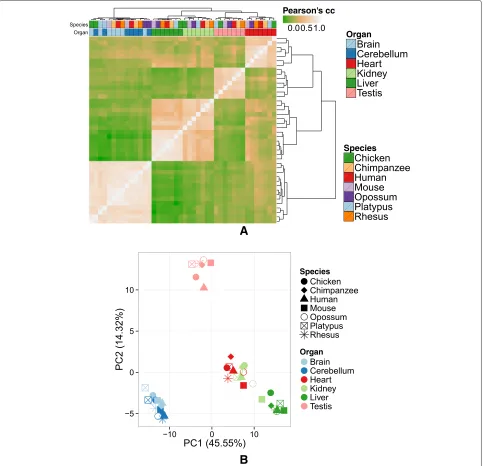
Fig. 2Hierarchical clustering (a) and PCA (b) based on the expression of 256 genes identified by the projection score [13] show a stronger organ-dominated clustering than when including all genes. Clustering and PCA were performed in the same way as in Fig. 1.cccorrelation coefficient,PCprincipal component,PCAprincipal component analysis
genes have unconstrained gene expression. Indeed, fol-lowing the criterion in Pervouchine et al. [11], we used a dynamic range minimum threshold of two (i.e., a difference in expression greater than two orders of mag-nitude) to identify 3622 genes with unconstrained expres-sion across the species and organs in the Barbosa-Morais et al. dataset (Additional file 2: Table S1). These genes include 255 of the 256 genes that drive the clustering of all samples.
[image:4.595.57.544.87.553.2]all observations/samples can be decomposed into three variances: across organs, across species, and the residual variance. The relative contribution of each of these factors to the total gene variance in expression can then be com-puted as the relative proportion of each variance with respect to the total variance (“Methods”).
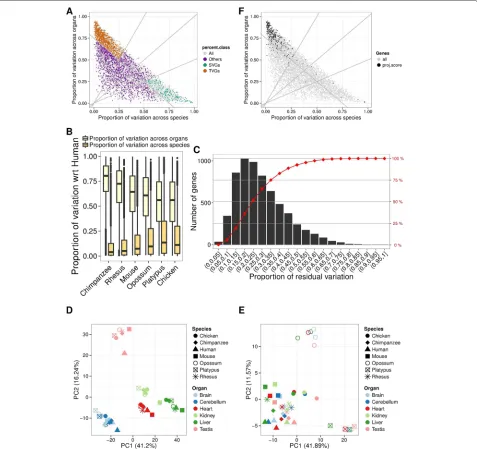
The results of the aforementioned variance decompo-sition of gene expression applied to the data in Barbosa-Morais et al. [2] are shown in Fig. 3a. On average, more than 70 % of the total variance in gene expression can be explained by either organ or species, with the tribution of organ (41 %) being larger than the con-tribution of species (31 %), consistent with the global organ-dominated clustering. The relative contribution of each factor depends on the evolutionary distance sep-arating the species compared, with the relative contri-bution of organ decreasing with distance, and that of species increasing (Fig. 3b). Although it is known that gene sequence and gene expression level evolve partic-ularly rapidly in testis [1], the same trend is observed when testis is removed from the analysis (Additional file 1: Figure S4). In 3255 genes (52 %), variance across either organ or species accounted for at least 75 % of the total variance (Fig. 3c). Among these, we identified 1528 genes that vary substantially more across organs than species (defined as having a proportion of organ variance at least twice that of species), and 819 genes that vary substan-tially more across species than organs (defined as having a proportion of species variance at least twice that of organ). Many genes with a large fraction of the variance explained by either organ or species, however, show lit-tle absolute variance (Additional file 1: Figure S5), and therefore, whether the variance is dominated by organ or species is nearly irrelevant. Thus, we intersected them with the set of 3622 unconstrained genes, and identified 1245 unconstrained genes varying preferentially across organs and 268 unconstrained genes varying preferentially across species. We will refer to these genes as tissue-variable genes (TVGs) and species-tissue-variable genes (SVGs), respectively. Predictably, the use of TVGs only resulted in an organ-driven clustering (Fig. 3d, Additional file 1: Figure S6A). Including only SVGs resulted, in contrast, in a species-driven clustering (Fig. 3e, Additional file 1: Figure S6B). Modularity analysis quantifies these obser-vations (Additional file 1: Figure S7). Consistent with the larger absolute variance across organs (Additional file 1: Figure S5), most of the 256 genes identified by the pro-jection score method as driving the clustering are TVGs (219, i.e., 86 %), and almost none are SVGs (five, i.e., 2 %, Fig. 3f).
In general, SVGs exhibit properties characteristic of housekeeping genes, and gene ontology (GO) analysis does indeed indicate that they are involved in basic cel-lular functions (Additional file 1: Figure S8), compared to
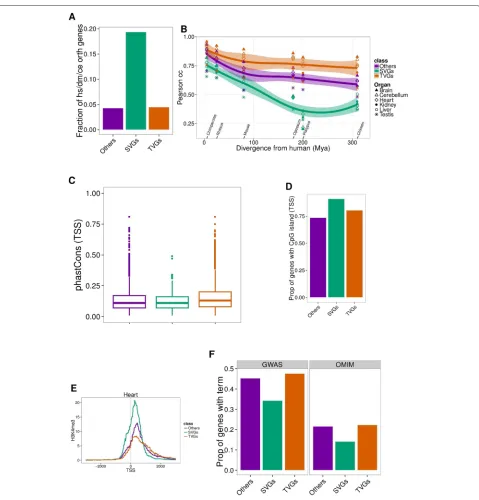
TVGs. As expected, SVGs are evolutionarily older than TVGs, since 19 % of them are present across all meta-zoans [16], compared to only 4 % of TVGs (Fig. 4a, “Methods”). In SVGs, divergence in gene expression is almost directly related to evolutionary divergence. Indeed, we computed the Pearson’s pairwise correlation of expres-sion across genes between human and each other species for each organ separately, as in Barbosa-Morais et al. [2]. We observed a strong dependence and steep decline when increasing the evolutionary distance for SVGs, which was very moderate for TVGs (Fig. 4b).
We also found that promoters of TVGs show stronger sequence conservation than those of SVGs (p=4×10⁻⁴, Mann–Whitney test, Fig. 4c, “Methods”), and that they tend to overlap CpG islands less frequently [17] (p = 6×10⁻⁵, chi-squares test, Fig. 4d, “Methods”). It has been shown that promoters of housekeeping genes are associ-ated with higher CpG island overlap [18]. On the other hand, TVGs show a weaker H3K4me3 signal, a histone modification typical of transcription initiation (as mea-sured by the ENCODE Project in five mouse organs [12]). Instead, SVGs are enriched in this mark, compared to TVGs (p(Heart)=2×10⁻², Mann–Whitney test, Fig. 4e, Additional file 1: Figure S9), even for a subset of genes with comparable expression levels (“Methods”). Again, this difference has been observed between the promoters of housekeeping genes and tissue-specific genes (see, for instance, [19]).
It is sensible to assume that animal models will be partic-ularly appropriate for genes whose expression varies con-siderably across organs, but little across species (TVGs). Interestingly, we found that TVGs are more likely to be associated with diseases (as reported in OMIM [20] and the GWAS catalogue [21]), than SVGs (Fig. 4f).
Breschiet al. Genome Biology (2016) 17:151 Page 6 of 13
Fig. 3 aProportion of expression variance explained by species (x-axis) and by organs (y-axis) for each of the 6283 orthologous genes (dots) using linear models. Thedashed linesaty=2xandx=2yidentify the genes in which species-explained variance is twofold greater than organ-explained variance, and in which tissue-explained variance is twofold greater than species-explained variance, respectively. We restricted to the genes for which either species or tissue explains at least 75 % of the variance (dashed lineatx+y=0.75), and defined two sets of genes: genes whose expression varies considerably across species and little across tissues, SVGs (green), and genes whose expression varies considerably across tissues and little across species, TVGs (orange).bBox plot representing the distribution of the proportion of gene expression variance across organs (light yellow) or between human and each other species (dark yellow). When considering more evolutionarily distant species, the proportion of variance across organs decreases, while that between species increases.cNumber of genes in distinct bins of proportional residual variance (histogram) and cumulative proportion of genes at increasing bins of proportional residual variance. Altogether, 75 % of orthologous genes have less than 35 % residual variance.dPCA based on the expression of TVGs only shows an organ-dominated arrangement of the samples in the space defined by the first two PCs.ePCA based on the expression of SVGs only shows a species-dominated arrangement of the samples in the space defined by the first two PCs.fSame as (a), with different color scale, which highlights the higher variance across organs of genes identified by the projection score [13] (black), compared to the rest of the genes (gray).PCprincipal component,PCAprincipal component analysis,SVGspecies-variable gene,TVG
tissue-variable gene
Our model does not take into account inter-individual gene expression variation within a given species. However, single measurements in genes whose expression varies
Breschiet al. Genome Biology (2016) 17:151 Page 8 of 13
A
B
C
[image:8.595.57.552.85.695.2](See figure on previous page.)
Fig. 5aProportion of expression variance explained after centering and scaling each gene expression across species (x-axis) or across organs (y-axis) for the 6283 orthologous genes. When centering and scaling across species, the variance explained by species is 0 and there is only variance explained by organ (x-axis). Conversely, they-axis is the proportion of variance explained by species after the variance across organs becomes 0 because of centering and scaling across organs.Dotsare colored based on the class assigned to each gene. A PCA is performed on the gene expression of all 6283 orthologous genes after centering and scaling their expression across organs (b) or across species (c). The first PCA shows a species-dominated clustering, while the second one shows an organ-dominated clustering.PCprincipal component,PCAprincipal component analysis,SVGspecies-variable gene,TVGtissue-variable gene
species, they may appear to exhibit a stochastic behavior, and could potentially contribute to residual variation. To assess the impact of inter-individual variation in our results, we used gene expression data produced by the GTEx consortium [22] in multiple tissues from multi-ple post-mortem donors. In the work by Melé et al. [23], we had previously estimated that the average contribu-tion of inter-individual variance to the global variance of gene expression was on average very low (5 %), and here we have found that it is only slightly higher in SVGs than TVGs (Additional file 1: Figure S10A). Because the estimates of the variance decomposition in Melé et al. are inferred from a larger set of tissues than those avail-able in Barbosa-Morais et al. [2], we performed the vari-ance decomposition only on the organs common with the Barbosa-Morais et al. study, and found that in these organs, inter-individual variance was even lower (4 % on average, Additional file 1: Figure S10B). These results sug-gest that inter-individual variation has little impact on our estimates of inter-organ and inter-species variation.
Conclusions
Transcriptome comparisons reveal to what extent the biology of a given organism can be extrapolated to another. Regarding specifically human and mouse, intense debate exists as to whether organ transcriptomes, when taken globally, cluster preferentially by organ or by species. This is central to the use of mouse as a model of human biology. Here we used a modularity analysis to measure quantitatively such a preference, beyond the mere visual inspection of the output of dimensionality-reduction techniques typically used to address this ques-tion. We specifically used modularity to analyze the results in Lin et al. [6]. These have been challenged on the basis of a potentially flawed experimental design [7]. Human organ samples and mouse organ samples in the initial study by Lin et al. were sequenced in two differ-ent batches, making it, indeed, impossible to separate the effect of the batch from that of the species. However, our analysis of the modularity of the correlation networks indicates that the batch effect is unlikely to be the dom-inant factor, because when we restrict the analysis of the Lin et al. data to the five organs common to the Barbosa-Morais et al. study [2], the clustering observed is by organ and not by species.
It is not our main aim here, however, to take a position on whether human and mouse transcriptomes are preferentially conserved across organs or species, but rather to address the limitations of an approach based on global transcriptome comparisons. This implicitly assumes an average behavior for genes, ignoring that each gene has a characteristic pattern of expression variation across species and organs. Our results show, indeed, that there is continuum in the spectrum of expression varia-tion, at one extreme of which are genes whose expression varies considerably across species and little across organs (and, therefore, lead to a species-dominated clustering), and at the other extreme of which are genes whose expres-sion varies considerably across organs and little across species (and lead, therefore, to an organ-dominated clus-tering). Therefore, whether transcriptomes, when con-sidered globally, cluster preferentially according to one component or the other, may not be as much a generic property of the transcriptomes, but rather a consequence of the dominant behavior of a subset of genes. Our results actually suggest that the organ-dominated cluster-ing obtained uscluster-ing the Barbosa-Morais et al. whole tran-scriptome dataset may actually be driven by a small subset of genes whose expression varies largely across organs, and little across species (Additional file 1: Figure S3B).
To assess the impact of inter-individual variation in our estimates of inter-organ and inter-species variation, we have used gene expression data from multiple tissues from multiple human donors. Unfortunately, such data do not exist for other species, which has prevented us from using a more general approach, in which tissues, species, and individuals within species are considered as factors in the linear models.
Breschiet al. Genome Biology (2016) 17:151 Page 10 of 13
across vertebrate species (and for which, therefore, the mouse may be a good model of human biology) are more often associated with diseases than genes with non-conserved expression patterns across species. We believe, therefore, that the values of the components of the expres-sion variance that we have attached to each gene could become a useful resource when planning, interpreting, and extrapolating experimental data in mouse and other vertebrate model organisms to human.
Methods
RNA-seq sample clustering based on gene expression
Gene expression matrix
Raw cRPKM values were obtained from the study by Barbosa-Morais et al. [2]. To have a balanced design, the original matrix was restricted to species for which the same six organs were available (see below). The final matrix consisted of seven vertebrates, including human, chimpanzee, rhesus, mouse, opossum, platypus, and chicken, and six organs, including brain, cerebellum, heart, liver, kidney, and testes.
We restricted the analyses to protein-coding genes with a one-to-one orthology relationship in the seven species. We used the orthology relationships of the Barbosa-Morais et al. study [2], which include 6787 orthologous genes. Of these, we retained 6393 orthologs after check-ing for consistency against each annotation set in Ensembl v65, for each species (genome and annotation files from the Barbosa-Morais study can be found in Additional file 3: Table S2). Finally, we intersected this set with the list of one-to-one protein-coding orthologs between human and mouse provided by the mouse ENCODE consortium [12], to get a final matrix consisting of expression values for 6283 genes in 42 samples (Additional file 3: Tables S3 and S4).
Hierarchical clustering and PCA
In Figs. 1a and 2a, the samples are clustered hierarchi-cally based on their pairwise Pearson’s correlation coef-ficients of gene expression values, where cRPKM are log10-normalized after adding a pseudocount of 0.01. The samples are then clustered on the vector of the correlation coefficients, with one minus Pearson’s correlation coeffi-cient (1− |r|) as a distance metric, using the complete linkage clustering algorithm.
In Additional file 1: Figure S6A, B, the samples and genes are clustered hierarchically based on gene expres-sion values directly. Again cRPKM are log10-normalized after adding a pseudocount of 0.01 and the complete link-age clustering algorithm is applied on Euclidean distances. PCA, as shown in Figs. 1b, 2b and 3d, e, was performed on cRPKM values normalized in the same way, but cen-tered and scaled across all the samples for each gene. PCA, as shown in Fig. 5b, c, however, was performed after
centering and scaling the normalized cRPKM for each gene across all the organs in a given species (Fig. 5b), and across all the species for a given organ (Fig. 5c), respectively.
Network modularity
The modularity of a graph with respect to some divi-sion (or vertex types) measures how good the dividivi-sion is, or how separated the different vertex types are from each other. In this study, we build a graph where sam-ples are vertices (or nodes). Two vertices or samsam-ples are connected if the Pearson’s correlation coefficient between them, computed on the gene expression values, is higher than a certain threshold (excluding connections of a sam-ple with itself ). As in hierarchical clustering and PCA, gene expression values are log10-transformed cRPKM after adding a pseudocount of 0.01. The vertex types on which the modularity is computed are either the organ or the species classification. To compute the modularity, we used the function modularity()from the R package igraph v0.7.1, which implements the following definition [14]:
Q= 1
2m×
i
j
Aij− ki×kj
2m
δ(ci,cj)
, (1)
wheremis the number of edges,Aijis the element of the adjacency matrixAin rowiand columnj(corresponding to verticesiandj, respectively),kiis the degree ofi,kjis the degree ofj,ci is the type (or component) ofi,cjthat of j, the sum goes over alli andjpairs of vertices, and δ(x,y)=1 ifx=y, andδ(x,y)=0 otherwise.
Finally, the modularity is plotted as a function of the network density, which is defined as the actual number of edges (based on the threshold of the correlation coef-ficient) over the total number of possible edges. We set self-connection to 0 in the adjacency matrix even though samples share an identity with themselves, to ensure self-connection does not inflate the modularity calculation. Conclusions are robust to setting self-connection to 1.
Projection score
Linear models, variance decomposition, and SVG and TVG definition
The expression of each gene in a given sample is usually dependent on the identity of the sample, which here is represented by the organ and the species of origin. More formally, for an individual gene, a linear model can be built that describes its expression as the sum of the factors organ and species and a residual term:
yij=μ+orgi+spcj+ij, (2)
where yij is the expression of a gene in organ i (of no organs) and speciesj(ofnsspecies),μis the basal expres-sion level of the gene, orgiis the coefficient for organi, spcj is the coefficient for speciesj, andijis the residual term.
Thus, as in the ANOVA type of analysis, the total gene expression variation for each gene (or total sum of squares, SSTg) across all samples can be decomposed into three variations: variation across organs (SSOg), variation across species (SSSg), and a residual variation (SSRg):
SSTg=SSOg+SSSg+SSRg, (3)
where
SSTg= no
i=1 ns
j=1
(yij− ¯y··)2, (4)
SSOg=ns no
i=1
(¯yi·− ¯y··)2, (5)
SSSg=no ns
j=1
(y¯·j− ¯y··)2, (6)
SSRg= no
i=1 ns
j=1
(yij− ¯yi·− ¯y·j+ ¯y··)2, (7)
and
¯ y··=
no
i=1 ns
j=1
yij, (8)
¯ yi·=
1 ns
ns
j=1
yij, (9)
¯ y·j=
1 no
no
i=1
yij. (10)
The relative contribution of each factor to the total gene expression variation can then be computed as the relative proportion of each variation with respect to the total. The linear model was implemented using the func-tionlm()from basic R. A convenient in-house wrapper is available at https://github.com/abreschi/Rscripts/blob/ master/anova.R.
In a two-factor linear mixed model, the factors organ and species can be considered as giving an independent additive contribution to the gene expression level with
variancesσ2
o andσs2, respectively, along with an indepen-dent additive contribution of the residual term that has varianceσe2. In this case, the relative contribution of each factor (e.g., organ) to the gene expression variation can be thought of as the variance of that factor over the sum of the variances of both factors plus the residual variance (e.g.,σo2/(σo2+σs2+σe2)[23]). The linear mixed models were implemented by using the functionlmer()of the R package lme4 v1.1-7.
As the correlation between the relative contributions with the linear model and with the linear mixed model is very high for both factors (Additional file 1: Figure S11A, B), we decided to use the linear model, which requires no estimation step and is more intuitive.
To remove genes with relatively low variability of expression, we filtered them based on their dynamic range, computed on cRPKM after adding a pseudocount of 0.01. The dynamic range for each gene is defined as the difference in order of magnitudes between the maxi-mum and the minimaxi-mum expression across all samples. We used a minimum threshold of 2 orders of magnitude [11], to retain only the most variable genes, which we refer to as unconstrained. Within this set of unconstrained genes, we further considered genes for which either species or organ explains at least 75 % of the variance (dashed line at x+y = 0.75 on Fig. 3a and f), and defined two sets of genes: genes whose relative variation of expression is twofold greater across species than across organs (SVGs) and genes whose relative variation of expression is twofold greater across organs than across species (TVGs). The unconstrained genes that are neither SVGs nor TVGs are referred to as others.
To find the distribution of the proportion of expres-sion variation between human and each other species (Fig. 3b), we built a linear model for all the organs of human and the other species. The gene expression val-ues were log10-normalized, after adding a pseudocount of 0.01, and centered and scaled within each sample. Since gene expression is known to evolve much faster in testis [1], we performed the same analysis excluding testis. We found the same result (Additional file 1: Figure S4).
Properties of SVGs and TVGs
GO analysis
[image:11.595.56.289.316.610.2]Breschiet al. Genome Biology (2016) 17:151 Page 12 of 13
multiple testing (Benjamini–Hochberg correction [24]), and the top ten significantly enriched terms are shown for each group of genes.
Evolutionarily conserved genes
We computed the fraction of evolutionarily conserved genes as the proportion of genes in each class that were identified as being orthologous between human, fly (Drosophila melanogaster), and worm (Caenorhabditis elegans) as defined by the modENCODE consortium [16].
Promoter analysis
Promoter sequence conservation. The promoter seq-uence conservation was computed for a window of 2000 bp upstream and 500 bp downstream of the transcription start site (TSS) of each gene. A gene TSS is defined as the most 5 base of the gene. PhastCons scores [25] in this window are averaged from the bigwig file with the bwtool software [26] and this average is taken as a measure of promoter sequence conservation.
CpG island coverage. For each base in a 6000-bp win-dow around the TSS (±3000 bp) of the human genes of our set of one-to-one orthologs, we computed a binary overlap with CpG islands, as annotated in [17]. We then computed the proportion of genes in each class with at least one overlapping CpG island, as shown in Fig. 4d.
H3K4me3 signal. We compared the intensity of the H3K4me3 mark at the promoter of each category of gene in the five organs for which ChIP-seq experiments were available from the mouse ENCODE consortium [12] (Additional file 3: Table S6), namely cerebellum, heart, kidney, liver, and testes. As H3K4me3 is a mark known to be present at the promoter of the majority of actively tran-scribed genes, we restricted our comparison to a subset of TVGs specific to each organ, and to a subset of SVGs and others that are comparable to this subset of TVGs in terms of number of genes and expression values.
To select genes specific to each organ, we required the genes to be common to multiple species and shared by a limited number of organs. As shown in Additional file 1: Figure S12, five is the number of species for which we have the maximum number of genes specific to one organ and present in this number of species. We identified 1086 such genes (Additional file 1: Figure S13).
For each subset of TVGs specific to a given organ, we selected a subset of SVGs and other genes with the same number of genes and a similar expression. To select genes with comparable expression, we binned the expres-sion values of SVGs, other genes, and TVGs specific to one organ in 50 expression bins. Then, for each bin, we
randomly selected a number of genes from each class, cor-responding to the minimum number of genes available in that bin.
The average signal intensity for each mark was com-puted around the TSS (±3000 bp) at each 10-bp bin for the three classes of genes in each organ (Fig. 4e and Additional file 1: Figure S9).
GWAS and OMIM analyses
For each category of genes, we computed the proportion of genes with an associated disease in the OMIM database (http://omim.org/, version updated to June 2014) or a trait in the GWAS catalog (https://www.ebi.ac.uk/gwas/, ver-sion updated to June 2014). For the genes associated with a GWAS trait, we used the gene reported in the catalog, when available.
Analysis of inter-individual variation in GTEx
Gene expression values (RPKM) for the latest pub-lic GTEx release were downloaded from the GTEx portal (http://www.gtexportal.org/home/datasets/, file: GTEx_Analysis_v6_RNA-seq_RNA-SeQCv1.1.8_gene_rp km.gct.gz). To apply linear models to a balanced design matrix with organs and individuals, we retained gene expression data from the only four donors for which most of the organs in Barbosa-Morais et al. [2] were available (cerebellum, heart, kidney, liver, and testis; Additional file 3: Table S7). To remove genes with rela-tively low variability of expression, and for consistency with the previous analyses, we filtered them based on their dynamic range, computed on cRPKM after adding a pseudocount of 0.01 (see “Linear models, variance decomposition, and SVG and TVG definition”). To estimate the proportion of expression variation across organs and donors, we built a linear model for each individual gene that describes its expression as the sum of the organ and donor factors and a residual term (see “Linear models, variance decomposition, and SVG and TVG definition”). The relationship between the relative variation across donors and organs is shown in Additional file 1: Figure S10B.
Additional files
Additional file 1: Figures S1–S13.File with all supplementary figures, from S1 to S13. (PDF 871 kb)
Additional file 2: Table S1.Intersection between gene sets identified by variance decomposition and dynamic range. (PDF 14 kb)
species, col 4: absolute residual variation, col 5: proportion of variation across organs, col 6: proportion of variation across species, col 7: category assigned based on the proportions of variation across organs and species (see “Methods” for details), col 8: dynamic range, col 9: constrained class based on dynamic range. The final gene sets can be obtained by requiring the value in col 9 to be “unconstrained”.Table S5.List of genes identified by projection score.Table S6.List of the mouse ENCODE ChIP-seq datasets used here.Table S7.List of GTEx sample IDs used in the variance decomposition. (XLSX 777 kb)
Acknowledgements
We acknowledge the ENCODE consortium for critical insights and useful discussions.
Funding
This project was supported by awards U54HG007004 and U41HG007234 from the National Human Genome Research Institute of the National Institutes of Health, as well as from the Spanish Ministry of Economy and Competitiveness, Centro de Excelencia Severo Ochoa 2013–2017, SEV-2012-0208, and Programa de Ayudas FPI del Ministerio de Economia y Competitividad, BES-2012-055848. We would also like to acknowledge support from the European Research Council (ERC) under the European Union’s Seventh Framework Programme (FP7/2007-2013)/ERC grant agreement 294653.
Availability of data and materials
The main gene expression matrix used in this study can be found in the original work by Barbosa et al. [2]. We provide a multi-sheet file with the tables containing the results of our analysis at http://public-docs.crg.es/rguigo/ Papers/breschi_clustering/Supplementary_Tables.xlsx. A description of each table is provided in the Additional Files. The GTEx gene expression was downloaded from http://www.gtexportal.org/home/datasets, file: GTEx_ Analysis_v6_RNA-seq_RNA-SeQCv1.1.8_gene_rpkm.gct.gz. A subset of the samples was used here (“Methods”, Additional file 3: Table S7). A convenient in-house wrapper for the linear models in R is available at https://github.com/ abreschi/Rscripts/blob/master/anova.R.
Authors’ contributions
AB participated in the design of the study, performed the analyses, and helped to draft the manuscript. SD participated in the analyses and helped to draft the manuscript. JG, DDP, CD, and AD helped in the design of the analyses. TRG participated in the design of the study and helped to draft the manuscript. RG conceived of the study, participated in its design and coordination, and helped to draft the manuscript. All authors read and approved the final manuscript.
Competing interests
The authors declare that they have no competing interests.
Ethics approval and consent to participate
No ethical approval was required for this study.
Author details
1Centre for Genomic Regulation (CRG), The Barcelona Institute of Science and
Technology, Dr. Aiguader 88, 08003 Barcelona, Spain.2Universitat Pompeu
Fabra (UPF), Barcelona, Spain.3GenPhySE, Université de Toulouse, INRA, INPT,
INP-ENVT, Castanet Tolosan, France.4Cold Spring Harbor Laboratory, Cold
Spring Harbor, NY, 11742, USA.
Received: 12 April 2016 Accepted: 14 June 2016
References
1. Brawand D, Soumillon M, Necsulea A, Julien P, Csárdi G, Harrigan P, et al. The evolution of gene expression levels in mammalian organs. Nature. 2011;478:343–8.
2. Barbosa-Morais NL, Irimia M, Pan Q, Xiong HY, Gueroussov S, Lee LJ, et al. The evolutionary landscape of alternative splicing in vertebrate species. Science. 2012;338:1587–93.
3. Merkin J, Russell C, Chen P, Burge CB. Evolutionary dynamics of gene and isoform regulation in mammalian tissues. Science. 2012;338:1593–9.
4. McCall MN, Uppal K, Jaffee HA, Zilliox MJ, Irizarry RA. The Gene Expression Barcode: leveraging public data repositories to begin cataloging the human and murine transcriptomes. Nucleic Acids Res. 2011;39:D1011–5.
5. Liao BY, Zhang J. Evolutionary conservation of expression profiles between human and mouse orthologous genes. Mol Biol Evol. 2006;23: 530–40.
6. Lin S, Lin Y, Nery JR, Urich MA, Breschi A, Davis CA, et al. Comparison of the transcriptional landscapes between human and mouse tissues. Proc Natl Acad Sci. 2014;111:17224–9.
7. Gilad Y, Mizrahi-Man O. A reanalysis of mouse ENCODE comparative gene expression data. F1000Research. 2015;4:121.
8. Pishesha N, Thiru P, Shi J, Eng JC, Sankaran VG, Lodish HF. Transcriptional divergence and conservation of human and mouse erythropoiesis. Proc Natl Acad Sci. 2014;111:4103–8.
9. Yanai I, Graur D, Ophir R. Incongruent expression profiles between human and mouse orthologous genes suggest widespread neutral evolution of transcription control. Omics: J Integr Biol. 2004;8:15–24. 10. Chan ET, Quon GT, Chua G, Babak T, Trochesset M, Zirngibl RA, et al.
Conservation of core gene expression in vertebrate tissues. J Biol. 2009;8:33.
11. Pervouchine D, Djebali S, Breschi A, Davis CA, Barja PP, Dobin A, et al. Enhanced transcriptome maps from multiple mouse tissues reveal evolutionary constraint in gene expression for thousands of genes. Nat Commun. 2015;6.
12. Yue F, Cheng Y, Breschi A, Vierstra J, Wu W, Ryba T, et al. A comparative encyclopedia of DNA elements in the mouse genome. Nature. 2014;515: 355–64.
13. Fontes M, Soneson C. The projection score – an evaluation criterion for variable subset selection in PCA visualization. BMC Bioinform. 2011;12:307. 14. Clauset A, Newman ME, Moore C. Finding community structure in very
large networks. Phys Rev E. 2004;70:066111.
15. Sudmant PH, Alexis MS, Burge CB. Meta-analysis of RNA-seq expression data across species, tissues and studies. Genome Biol. 2015;16:1–11. 16. Gerstein MB, Rozowsky J, Yan KK, Wang D, Cheng C, Brown JB, et al.
Comparative analysis of the transcriptome across distant species. Nature. 2014;512:445–8.
17. Wu H, Caffo B, Jaffee HA, Irizarry RA, Feinberg AP. Redefining CpG islands using hidden Markov models. Biostatistics. 2010;11(3):499–514. 18. Lenhard B, Sandelin A, Carninci P. Metazoan promoters: emerging
characteristics and insights into transcriptional regulation. Nat Rev Genet. 2012;13:233–45.
19. Zhao X, Valen E, Parker BJ, Sandelin A. Systematic clustering of transcription start site landscapes. PLoS ONE. 2011;e23409:6.
20. Amberger JS, Bocchini CA, Schiettecatte F, Scott AF, Hamosh A. OMIM. org: Online Mendelian Inheritance in Man (OMIM®), an online catalog of human genes and genetic disorders. Nucleic Acids Res. 2015;43: D789—98.
21. Welter D, MacArthur J, Morales J, Burdett T, Hall P, Junkins H, et al. The NHGRI GWAS Catalog, a curated resource of SNP-trait associations. Nucleic Acids Res. 2014;42:D1001—6.
22. Lonsdale J, Thomas J, Salvatore M, Phillips R, Lo E, Shad S, et al. The genotype-tissue expression (GTEx) project. Nat Genet. 2013;45:580–5. 23. Melé M, Ferreira PG, Reverter F, DeLuca DS, Monlong J, Sammeth M
et al. The human transcriptome across tissues and individuals. Science. 2015;348:660–5.
24. Benjamini Y, Hochberg Y. Controlling the false discovery rate: a practical and powerful approach to multiple testing. J R Stat Soc Ser B Methodol. 1995;57(1):289–300.
25. Siepel A, Bejerano G, Pedersen JS, Hinrichs AS, Hou M, Rosenbloom K, et al. Evolutionarily conserved elements in vertebrate, insect, worm, and yeast genomes. Genome Res. 2005;15:1034–50.
26. Pohl A, Beato M. bwtool: a tool for bigWig files. Bioinformatics. 2014;30: 1618–19.