R E S E A R C H
Open Access
Spatial chromatin architecture alteration by
structural variations in human genomes at
the population scale
Michal Sadowski
1,2, Agnieszka Kraft
1,3, Przemyslaw Szalaj
1,4,5, Michal Wlasnowolski
1,3, Zhonghui Tang
6,
Yijun Ruan
7*and Dariusz Plewczynski
1,3*Abstract
Background:The number of reported examples of chromatin architecture alterations involved in the regulation of gene transcription and in disease is increasing. However, no genome-wide testing has been performed to assess the abundance of these events and their importance relative to other factors affecting genome regulation. This is particularly interesting given that a vast majority of genetic variations identified in association studies are located outside coding sequences. This study attempts to address this lack by analyzing the impact on chromatin spatial organization of genetic variants identified in individuals from 26 human populations and in genome-wide association studies.
Results:We assess the tendency of structural variants to accumulate in spatially interacting genomic segments and design an algorithm to model chromatin conformational changes caused by structural variations. We show that differential gene transcription is closely linked to the variation in chromatin interaction networks mediated by RNA polymerase II. We also demonstrate that CTCF-mediated interactions are well conserved across populations, but enriched with disease-associated SNPs. Moreover, we find boundaries of topological domains as relatively frequent targets of duplications, which suggest that these duplications can be an important evolutionary mechanism of genome spatial organization.
Conclusions:This study assesses the critical impact of genetic variants on the higher-order organization of chromatin folding and provides insight into the mechanisms regulating gene transcription at the population scale, of which local arrangement of chromatin loops seems to be the most significant. It provides the first insight into the variability of the human 3D genome at the population scale.
Keywords:Genomics, Chromatin architecture, Topologically associating domains, Chromatin loops, Genome regulation, Gene transcription, CCCTC-binding factor, RNA polymerase II, Biophysical modeling, Human
Background
Around 20 million base pairs of a normal human genome (0.6%) are under structural variations, including deletions, duplications, insertions, and inversions. This makes structural variants (SVs) the most prominent source of genetic variation among human individual genomes.
The potential malicious effect of SVs has been re-cognized but almost solely associated with altering gene copy number and gene structure—a number of studies relate copy number variants (CNVs) affecting gene regions to cancer [1], intellectual disabilities [2], and predis-positions to various health problems [3, 4]. The vast majority of genetic variation occurs, however, in non-coding regions. Over 95% of single-nucleotide poly-morphisms (SNPs) identified by genome-wide association studies (GWAS) are located outside coding sequences [5]. Similarly, larger variants are significantly depleted in gene regions [6].
© The Author(s). 2019Open AccessThis article is distributed under the terms of the Creative Commons Attribution 4.0 International License (http://creativecommons.org/licenses/by/4.0/), which permits unrestricted use, distribution, and reproduction in any medium, provided you give appropriate credit to the original author(s) and the source, provide a link to the Creative Commons license, and indicate if changes were made. The Creative Commons Public Domain Dedication waiver (http://creativecommons.org/publicdomain/zero/1.0/) applies to the data made available in this article, unless otherwise stated.
* Correspondence:Yijun.Ruan@jax.org;d.plewczynski@cent.uw.edu.pl
7
The Jackson Laboratory for Genomic Medicine, 10 Discovery Drive, Farmington, CT 06032, USA
1Centre of New Technologies, University of Warsaw, Banacha 2c, 02-097
Warsaw, Poland
A part of the SVs emerging in non-coding regions alters genomic loci recognized by proteins which organize the human genome in the cell nuclear space. Recent studies provided some insights into the impact SVs can have on a spatial organization of the human genome. Examples of SVs altering the borders of TADs in EPHA4 locus and causing pathogenic phenotypes by enabling spatial con-tacts between formerly isolated genomic functional ele-ments were reported [7]. Positions of TAD boundaries were proven useful for inferring cancer-related gene over-expression resulting from variation in cis-regulatory elements [8]. Accumulation of SVs proximal to the TAD boundary occupied by CTCF was postulated to cause enhancer hijacking and PRDM6 overexpression in me-dulloblastoma samples [9]. Hi-C maps were successfully used for the detection of large-scale rearrangements, which were reported as frequent in cancer cells [10]. Disruptions of chromosome neighborhoods were demon-strated—using CRISPR/Cas9 experiments—to activate proto-oncogenes [11]. An attempt was also made to model 3D chromatin structure including information on SVs and predicting enrichment/depletion of higher-order chromatin contacts caused by these variations [12]. Efficacy of the modeling method in predicting SV-induced ectopic contacts at the level of TADs was shown for EPHA4 locus.
However, to our knowledge, there was no genome-wide systematic study on the impact of SVs on genome spatial organization analyzing the level of individual chromatin loops. One of the most recent reviews on the topic [13] highlights the impact of SVs on genome spatial structure and the pathogenic potential of SVs altering the higher-order chromatin organization. None-theless, no attempt was made by the authors to assess what part of SVs emerging in normal human genomes causes functionally relevant chromatin spatial rearrange-ments, and no genome-wide data was presented on how SVs influence the chromatin 3D architecture.
The recent advancements in chromosome conformation capture techniques, namely high-throughput conform-ation capture (Hi-C) [14, 15] and Chromatin Interaction Analysis by Paired-End Tag Sequencing (ChIA-PET) [16,
17], resulted in the release of high-resolution chromatin interaction datasets. ChIA-PET, in particular, is able to capture individual chromatin contacts mediated by specific protein factors. In turn, the great effort of the 1000 Genomes Consortium led to the creation of the cata-log of human genomic sequence variations [6] identified in over 2500 human samples from 26 populations.
Taking advantage of the high-quality ChIA-PET and population-scale SVs data, we discuss a mecha-nistic model of the impact of SVs on the chromatin looping structure, provide the first genome-wide analysis of this impact for the human genome, and
model SV-induced changes in 3D genomic structures observed in human population.
In our analyses of the impact of SVs on the 3D chro-matin organization of the human genome, we pay a specific attention to chromatin interactions associated with enhancer regions and gene promoters. These inter-actions are likely to play a distinguished role in the regu-lation of gene transcription in a mechanistic fashion, bringing the genes and the regulatory elements close together or separating them in the nuclear space of the cell. We observe an interesting interplay between such genomic interactions and SVs.
Results
3D human genome
In this study, we use ChIA-PET interactions as a represen-tation of the higher-order spatial organization of the human genome. ChIA-PET targeting on CTCF and RNA-PII performed on the GM12878 cell line [17, 18] was selected as the most comprehensive ChIA-PET dataset for humans presently. CTCF was shown to be the key protein factor shaping the architecture of mammalian genomes [15, 19], whereas RNAPII is essential for gene transcrip-tion. Together, the ChIA-PET data of these two protein factors account for structural and functional aspects of the higher-order organization and multiscale folding of chro-matin 10 nm fiber in the human cell nucleus [20]. It was postulated that pools of interacting CTCF/cohesin-medi-ated loop anchors form the structural foci, toward which interactions mediated by RNAPII draw genes for coordi-nated transcription [17]. We will further refer to these structural foci as interaction centers.
ChIA-PET generates high-resolution (~ 100 bp) genome-wide chromatin contact maps. It identifies two types of chromatin interactions mediated by specific pro-tein factors. The first type is highly reliable enriched inter-actions which appear in the data as closely mapped on the genome clustered inter-ligation paired-end-tag products (PET clusters). The second type is singletons, which reflect higher-order topological proximity [17].
We inspected the anchoring sites of PET clusters iden-tified by the CTCF ChIA-PET experiment for the co-occupancy by CTCF and cohesin (SMC3 and RAD21 subunits), to select the set of high-quality chromatin in-teractions mediated by CTCF in GM12878 cell (see the
“Methods” section). We identified 44,380 such pairwise
The interactions mediated by CTCF are not uniformly distributed over the genome but rather form highly interacting, predominantly hundreds of kilobases-long chromatin blocks (which we will further refer to as chromatin contact domains (CCDs)) separated by segments of weak and rare contacts (gaps). Based on the CTCF ChIA-PET data, the genome of GM12878 cell was segmented into 2267 CCDs [18], and we adopt this segmentation in this study. The domains lengths vary from around 10 kb to few megabases with a median length of 750 kb. Only 1% of CCDs is longer than 2 Mb (Fig.1a).
Even though CTCF ChIA-PET captures only the interactions mediated by the CTCF protein, it detects structural features exhibited by the non-specific Hi-C data [21]. It was shown that at a global scale, whole-chromosome Hi-C and ChIA-PET contact maps are highly correlated (Spearman’s correlation coefficient in the range of 0.7–0.9) [17]. Locally, ChIA-PET and Hi-C heatmaps identify a very similar landscape of genomic structures, both at the scale of topological domains (Fig.1b) and chromatin loops (Fig.1c). A large fraction of TADs identified in high-resolution Hi-C data are de-marcated by anchors of chromatin loops highly enriched with CTCF and the cohesin subunits SMC3 and RAD21 [15]. Even though the borders of topological domains formed by CTCF loops identified in ChIA-PET data coincide with only a small fraction of anchors of those loops, they exhibit distinctively high levels of CTCF, SMC3, and RAD21 binding signals (Fig. 1b and Additional file 2: Figure S1). This underlines the specificity of those loci among CTCF loop anchors and is consistent with the findings based on Hi-C data. Fur-thermore, length distributions of chromatin loops and topological domains called from ChIA-PET data are concordant with the respective statistics for Hi-C (Fig.1a). All this indicates that CTCF ChIA-PET dataset generated for GM12878 cell is a high-quality representation of the human 3D genome.
Following the authors of the dataset, we investigated the directionality of CTCF motifs in the anchors of the CTCF chromatin loops. Thirty-seven thousand two hun-dred eighty-nine out of the 44,380 PET clusters had mo-tifs of unique orientation in both anchors. Among the 37,289, we found 24,181 (65%) interactions with motifs in the anchors having convergent orientation (conver-gent loops), 6118 (16%) interactions in tandem right orientation (tandem right loops), 6089 (16%) tandem left loops, and 901 (2%) divergent loops (see the “Methods”
section). We adopted the coordinates of the outermost CTCF motifs in CCDs as indicators of their borders (see the“Methods”section).
The described ChIA-PET dataset is further used as the reference 3D genome of a human lymphoblastoid cell.
Predicting chromatin architecture altered by SVs
It was demonstrated, by phasing CTCF PET clusters identified in GM12878, that allele-specific single-nucleotide variation in genome sequence can result in haplotype-specific chromatin topology [17].
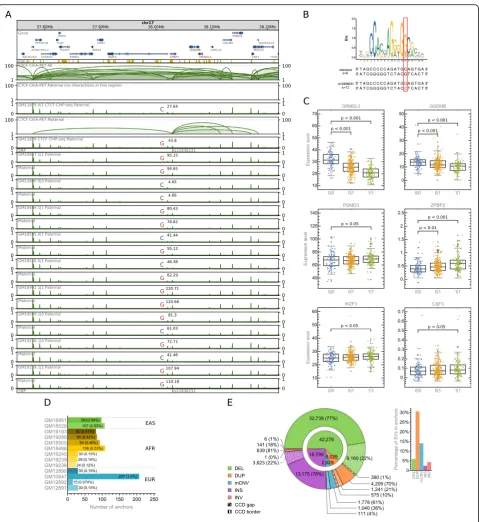
We further show that relative values of haplotype-specific CTCF binding signals (see the“Methods”section) accurately reflect genotypes determined by this variation in a number of lymphoblastoid cell lines (Fig. 2a, b; Additional file 2: Figure S2A and S2B). Furthermore, CTCF binding profiles around CTCF interaction anchors of unchanged nucleotide sequences are very similar across the cells. The analogy between the changes in CTCF binding caused by anchor-targeting allele-specific SNPs between homologous chromosomes of GM12878 and among lymphoblastoid cells suggests that the major diffe-rences in chromatin topology between chromosomes of two lymphoblastoid cells are an effect of genetic variation and can be predicted based on genomic interactions identified in GM12878. Such predictions can in turn uncover causal relations underlying the associations ob-served between genetic variations and gene transcription rates (Fig.2c).
In this study, we concentrate on predicting how SVs impact genome looping organization. SVs are the major source of sequence variation among human genomes and given their larger size have a higher potential than SNPs to induce changes in chromatin folding. They were also shown to contribute more than SNPs to variation in gene expression among human samples [22]. Chromatin contacts are thought to be largely invariant across individuals. To assess the level of conservation of CTCF-dependent genome architecture across individuals, we analyzed the abundance and arrangement of CTCF ChIP-seq peaks from 13 lymphoblastoid samples in ge-nomic segments which were identified as CTCF-mediated interaction anchors in the GM12878 cell line. The ChIP-seq data originate from one study [23, 24] and include 5 samples of European ancestry (GM10847, GM12878, GM12890, GM12891, GM12892), 7 samples of African ancestry (GM18486, GM18505, GM19099, GM19193, GM19238, GM19239, GM19240), and 2 samples of East Asian ancestry (GM18526, GM18951). GM12891, GM12892, GM12878 and GM19239, GM19238 and GM19240 are families of father, mother, and child respectively. The datasets were rigorously filtered for comparisons (see the “Methods” section).
For about 90% of all CTCF peaks identified in anchors of PET clusters in GM12878 cell, a CTCF peak in each of the compared cells can be found within a distance of 400 bp (Additional file2: Figure S3). CTCF-interacting anchors and borders of CCDs identified in GM12878 cell are highly enriched with CTCF ChIP-seq peaks found in the other 13 lymphoblastoid cells (Additional file2: Figure S4).
Similar analyses were performed for RNAPII-mediated interacting anchors using RNAPII ChIP-seq peaks (Additional file 2: Figure S5). Significantly bigger but moderate differences among samples were observed for this data.
Having tested the resemblance of genomic interaction site distribution in lymphoblastoid cells, we match SVs detected in human population in the 1000 Genomes Project [6] with the reference network of chromatin interactions to obtain individualized chromatin interaction patterns and assess the topological variability among human genomes.
There are 68,818 unique SVs deposited in the 1000 Genomes Catalog of Human Genetic Variation (CHGV) [25], including deletions, duplications, multi-allelic CNVs (mCNVs), inversions, and insertions (Fig. 2e). Forty-four percent of them are shorter than 1 kb, and only 22% is longer than 10 kb (Add-itional file 2: Figure S6).
Most of the SVs reside inside CCDs, not intersecting borders of domains nor CTCF-mediated interaction anchors (Fig.2e).
Computational algorithm for modeling SV-induced chromatin conformational changes
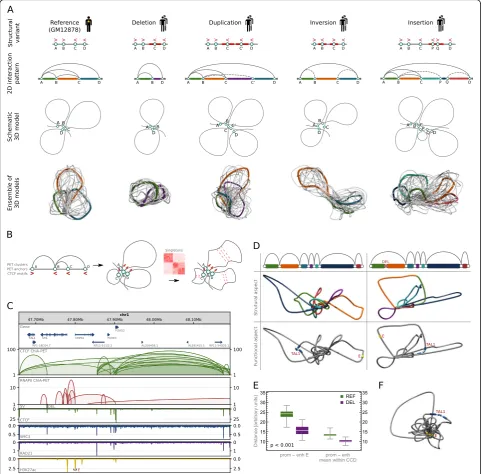
While the SVs that miss the interacting binding sites in most cases have limited impact on the final structure (resulting only in shortening, or extending of the cor-responding chromatin loops), the SVs that overlap the interacting sites may partially modify the interaction pattern and in turn cause serious changes of the 3D structure (Fig. 3a). Specifically, deletion removes an
interacting anchor therefore deleting all chromatin loops mediated by this genomic site; duplication introduces a new interaction site, which has the same underlying sequence specificity to form chromatin loops as the original duplicated site; inversion which encircles a CTCF binding motif will revert its directionality there-fore affecting the chromatin looping of the neighboring region; and finally, insertion containing CTCF motif enables new interaction sites capable of forming chro-matin loops with other CTCF binding sites.
We earlier demonstrated that using CTCF ChIA-PET data, a 3D model of an averaged genome structure which recovers architectural features of the genome can be built [26]. Chromatin models constructed with our computational tool (3D-GNOME) can be used to illus-trate the most probable arrangement of genomic struc-tural elements in 3D space: from chromosomes, through topological domains, to individual chromatin loops (see
the “Methods” section). 3D-GNOME uses PET clusters
to position the binding sites relative to each other first and then employs singletons, orientations of the CTCF motifs, and biophysical constraints to accurately model the shape of individual chromatin loops (Fig.3b).
We extended the 3D-GNOME modeling approach to include information on SVs in the recovery of 3D chro-matin structures (see the “Methods” section). Our algo-rithm models individual chromatin loops, meaning that the remodeling effect of a genetic variant disrupting a single pair of interacting genomic segments will be represented in the model (Fig. 3a). 3D-GNOME is an optimization algorithm which returns models that fulfill spatial constraints coming from genomic interaction data. Typically, a number of solutions exist for a given set of constraints (Fig.3a).
Analysis and modeling of genome organization levels of topological domains and chromatin loops are in the main scope of this study, as topological domains are believed to be the structural units regulating gene transcription by spatially isolating groups of enhancers
(See figure on previous page.)
and genes [7,15,17,27]. In our opinion, our 3D models constitute a supportive insight into SV effects; their in-spection can improve the understanding of functional impact and disease association of SVs.
As an example, deletion of a CTCF binding site insulat-ing the promoter of TAL1 gene from regulatory elements adjacent to the CMPK1 promoter was shown by CRISPR/ Cas9 experiments to cause activation of TAL1, an onco-genic driver of T cell acute lymphoblastic leukemia [11] (Fig.3c). 3D structures of the TAL1 locus generated with our algorithm illustrate fusion of the TAL1 promoter with the enhancer regions inside the insulated neighborhood formed as a consequence of the deletion (Fig. 3d). 3D distances calculated from the models quantify the accessi-bility of transcription-enhancing elements for the TAL1 promoter. The 3D distance between the promoter and a strong enhancer in the CMPK1 promoter and the mean distance between the promoter and enhancers located in the same CCD decrease significantly after the deletion (Fig. 3e). The models show how the promoter and the enhancer are brought even closer together within the insulated neighborhood by RNA-mediated chromatin interactions (Fig.3f). The models accurately illustrate the mechanisms pinpointed as causative for TAL1 overexpres-sion based on extensive experimental testing [11]. This demonstrates that their inspection can give insights into the functional consequences of SVs.
The chromatin modeling method including SV in-formation is provided as a web service at [28] together with a visualization tool.
Topological impact of structural variations
CTCF ChIP-seq data confirms that there are SVs which result in altered activity of reference interaction anchors. As an example, deletion chr14:35605439-35615196 of an interaction anchor leads to a significant depletion of CTCF signal in heterozygous samples and even to a complete vanishing of the signal in a homozygous sample (Fig. 4a). The CTCF signal drop reflects the lower or no potential of CTCF to bind to this segment. Therefore, in a cell line exhibiting the deletion, all of the chromatin contacts formed by this locus would not be present in one or both of the homologous chromosomes, depending on the genotype (Fig. 4b). The deletion is located in an intron of gene KIAA0391 but does not excise any coding sequence. Nevertheless, the genotypes show statistically significant differences in transcription rates of several genes (Fig. 4c). Even though the land-scape of functional elements around the affected genes is complex to the extent that refrains from drawing definite conclusions, certain explanations may be pro-posed based on the changes of interaction patterns reflected in 3D models (Fig. 4d) and direct design of experiments. First, deletion chr14:35605439-35615196
removes a CTCF-mediated interaction anchor, which could be involved in the formation of insulated neigh-borhoods separating the PPP2R3C gene (upstream) from a group of enhancers (downstream). The loss of the putative insulated neighborhood boundary would promote higher activation of PPP2R3C (Fig. 4c), by allowing interactions between the gene and the enhancers. H3K4me1 signal, primarily associated with active en-hancers [29], is notably stronger in deletion-affected homozygous GM18526 than in non-affected homozygous GM12878 in the enhancer region of interest (Fig. 4b and Additional file 2: Figure S7). This supports the proposed mechanism underpinning PPP2R3C increased activation. Moreover, the 3D distance between the PPP2R3C pro-moter and the strongest enhancer from the insulated neighborhood significantly decreases after introducing deletion in the 3D models (Fig. 4e) (see the “Methods” section). The existence of insulated neighborhoods is well established in the literature [11,30, 31]. Second, deletion chr14:35605439-35615196 removes chromatin contact bringing the NFKBIA gene and one of the enhancers together in 3D space (Fig.4d). This is reflected by the 3D distances between those two (Fig. 4e). The loss of the contact could explain lower NFKBIA expression in the samples carrying it (Fig. 4c). The association between NFKBIA transcription and genotype is not obvious as we did not find the difference in transcription between geno-types 0|0 and 1|1 statistically significant. However, we sus-pect that it would occur significant if the genotype 1|1 was represented by more samples than only 14. The deletion causes complex spatial rearrangements also around other genes, which contribute probably to the differences in their transcription rates between samples of different genotypes.
On the other hand, duplications of CTCF-mediated interacting genomic segments result in distinctively high relative values of CTCF signal in those segments in affected samples (Additional file2: Figure S8A and S8B). The signal enrichment caused by those duplications supports a hypothesis that they create additional CTCF-binding loci with the potential to form additional long-range genomic contacts in the affected genomes.
Inversions in CTCF binding sites also modulate CTCF signal (Additional file 2: Figure S9A), which indicates they introduce changes in chromatin looping.
Apart from SVs disrupting the long-range chromatin interactions that join genomic segments located within one topological domain, there are examples of SVs modifying do-main boundaries (Additional file2: Figure S10A and S11A).
Genotypes defined by such SVs exhibit significant dif-ferences in the expression of particular genes (Fig. 4c, Additional file2: Figure S8C, S9B, S10D, and S11E).
We analyze the 3D structures of a part of those loci in Additional file2: Figure S10B and S10C, Additional file2: Figure S11C and S11D, and Additional file2: Figure S13D. To statistically assess the impact of SVs on the spatial organization of the genome, we analyzed their positions in relation to genomic structural elements like anchors of PET clusters, borders of CCDs, or gaps between them.
We observe that anchors of CTCF PET clusters are depleted of SVs (Fig.4f) and that the rate of depletion is consistent among the loops of different directionality (Additional file2: Figure S14).
We further identified CTCF-mediated interaction an-chors intersected with enhancers and active and inactive gene promoters (see the “Methods” section). These an-chors have a distinguished potential to play an important role in gene regulation. We observe that enhancers and promoters located in CTCF-mediated interaction anchors are significantly more conserved than the respective functional regions residing outside them (Fig. 4f). This indicates the importance of the genomic architecture mediated by CTCF in proper genome regulation. We add-itionally examined the conservation of CTCF anchoring sites, which interact with enhancers and gene promoters through RNAPII ChIA-PET contacts, and they also seem to be more conserved than the respective genomic func-tional elements (Fig.4f).
Surprisingly, borders of CCDs do not seem to be dis-tinctively well conserved. CTCF binding motifs we iden-tified in CTCF ChIP-seq peaks outside CCD borders are significantly more depleted of SVs than the CTCF motifs indicating borders of CCDs (Fig. 4f). Moreover, CCD borders are enriched with rare insertions and are targets
of many duplications (Figs. 2e and 4f). There is also a slight enrichment of rare inversions in CCD borders, but because the set of inversions is small, the result is not statistically significant. However, we hypothesize that inverting the CTCF motifs at the borders of topological domains can be an important mechanism of genome reorganization and regulation. Six out of 786 inversions from the CHGV switch the directionality of CCD borders (Fig. 2e). Inversion chr10:15784798-15802449 is an example of such an event (Additional file 2: Figure S11A). It correlates with the transcription rate of a neighboring gene, VIM (Additional file2: Figure S11E).
Stronger conservation of CTCF-mediated interaction anchors intersected with and connected to the known enhancers and promoters as compared to the conser-vation of enhancers and promoters located outside the anchors suggests that mutations of these anchors may lead to serious deregulations of gene transcription and can be related to a disease. To test this hypothesis, we intersected CTCF anchors with SNPs previously asso-ciated with disease in GWAS [32]. Having in mind the type of cell examined, we created separate sets of GWAS SNPs associated with hematological parameters and autoimmune diseases. Our analysis indeed shows a significant enrichment of these SNP classes in CTCF anchors intersected with enhancers and active promoters (Fig. 4g). Particularly, the enrichment is high in CTCF anchors being in RNAPII-mediated contact with en-hancers and promoters. Both former and latter types of anchors are enriched with all GWAS SNPs. Importantly, enhancers and active promoters located outside the CTCF anchors are notably less enriched with GWAS SNPs than CTCF anchors associated with these functional elements (Fig. 4g). Generally, CTCF anchors and CCD boundaries are enriched with GWAS SNPs (Fig.4g). Our observations
(See figure on previous page.)
are consistent with the studies using capture Hi-C [33,34] and additionally highlight the role of CTCF in shaping the network of functionally important genomic contacts.
We investigated particular examples of SNPs associ-ated with autoimmune diseases (rheumatoid arthritis and vitiligo, rs4409785 T/C) and hematological parame-ters (red blood cell distribution width, rs57565032 G/T) (Additional file 2: Figure S15A and S16A). Both alter strongest CTCF binding motifs in the corresponding interaction anchors. However, their effect on CTCF binding is the opposite: rs4409785 increases the strength of CTCF motif it modifies (Additional file 2: Figure S15B), rs57565032 decreases (Additional file 2: Figure S16B). It is reflected in the CTCF signals corresponding to different genotypes (Additional file 2: Figure S15A and S16A). No other SNPs affect the CTCF motifs in those interaction anchors in presented genomes. Samples genotyped by these SNPs demonstrate significant dif-ferences in transcription rates of particular genes (Additional file2: Figure S15C and S16C). One of them, MAML2, has been associated with cancer traits.
The already presented SNP rs12936231 (Fig. 2a) has been reported as a high-risk allele for asthma and auto-immune diseases and suggested to cause chromatin remodeling and alter transcription of certain genes, including ZPBP2, GSDMB, and ORMDL3 [35]. We also found a correlation of genotypes set by rs12936231 with transcription rates of ZPBP2, GSDMB, and ORMDL3 (Fig. 2c). Gene IKZF3, which also exhibits a correlation with rs12936231, has been related to B cell chronic lymphocytic leukemia.
Examples of SNPs in interacting anchors, but not asso-ciated with disease so far, can also be found. SNP rs60205880 alters CTCF-mediated chromatin looping and transcription of certain genes (Additional file 2: Figure S2). One of them, CCDC19, has been associated with bilirubin levels; another, IGSF8, is a member of an immunoglobulin superfamily. This demonstrates the potential of investigating genetic variants which target genomic structural elements for the identification of the mechanisms relating them to a disease.
The important question is how large the structural variation among healthy individuals is. Individual genomes sequenced in the 1000 Genome Project carry from 2571 to 6301 SVs, which affect from 1024 to 1419 CCDs and 55–347 CTCF anchors (Additional file 2: Figure S17). Almost all CCDs (98%) have an overlap with at least one SV from the CHGV. However, serious changes in local genome architecture are introduced by disruptions of interaction anchors rather than modifications of genomic regions between them. We identified 4944 unique patterns of SVs altering the interaction anchors in CCDs (we treat 2 patterns as identical if anchor-intersecting SVs they con-tain are the same; patterns are limited to single CCDs).
Together with the 2267 reference CCDs, it gives the number of CTCF-mediated topologies of genomic do-mains occurring in the 1000 Genomes Project population. We note that types of SVs are well separated in those patterns (Additional file 2: Figure S18). Eighty-seven percent of the patterns are comprised of only one SV type. There are 1539 patterns consisting of 2 or more SVs, and in 902 (59%) of them, all SVs are of the same type.
Population-specific topological alterations affected by structural variations
We additionally analyzed the intersections of SVs with genomic structural elements in the context of five con-tinental groups: Africa (AFR), the Americas (AMR), East Asia (EAS), Europe (EUR), and South Asia (SAS). These populations are defined by the 1000 Genomes Project [36] (Additional file1: Table S2).
In all the populations, deletions of interacting anchors are more frequent than duplications (Fig.5a). This is not true for CCD borders (Fig. 5b), which agrees with the previous analyses showing that CCD borders are enriched with duplications (we note that there are significantly more deletions than duplications in the set of detected SVs (Fig. 2e)). Alterations of topological domain boun-daries can be a general mechanism of genome structure evolution. The above results suggest that such a generic mechanism—similarly to the evolutionary process of introducing gene alterations by duplications—could use redundancy as a security measure. It could leave one chromatin loop with the original transcriptional function under evolutionary pressure, whereas the second could be acquiring novel local spatial landscape for genes and regu-latory elements. This is in line with previous research on duplications [37,38].
Our analysis shows that individual genomes from populations of African ancestry have the largest number of deletions in CTCF interaction sites (Fig. 5a). This is partly due to an outstanding number of all deletions iden-tified in those genomes (Additional file 2: Figure S19). However, we still observe that African genomes, together with European genomes, have CTCF anchor sites less depleted of SVs unique to populations than genomes of other ancestries (Fig.5c).
A
B
C
D
F
G
H
I
J
K
E
[image:12.595.57.538.88.707.2]South Asian genomes, on the other hand, have a dis-tinctively large number of duplicated CTCF anchor (Fig. 5a) and CCD border (Fig. 5b) sites. Whereas the distinctive number of altered structural elements in genomes of African ancestry could be expected based on the large genomic sequence variability in this population reported earlier [36], high structural variability in popula-tions of South Asia is surprising. The ethnic groups which raise the statistics for South Asian continental group, especially those related to CNVs, are Indian Telugu in the UK (ITU), Punjabi in Lahore, Pakistan (PJL), and Sri Lankan Tamil in the UK (STU) (Fig.5f, g). As a compari-son, corresponding statistics for African and European continental groups seem to be more stable across the eth-nic groups (Additional file 2: Figure S22). To investigate this further, we analyzed homozygous SVs. We hypo-thesized that the elevated number of structural changes observed in South Asian genomes could be caused by the high number of homozygous SVs that some of the popu-lations in this continental group exhibit due to high con-sanguinity rates [39].
There are 13,767 homozygous SVs in the CHGV (we treat a CNV as homozygous, when there is a non-reference copy number on both homologous chromosomes). According to the data, genomes from East Asia, not South Asia, carry the largest number of the homozygous SVs (Fig. 5h). However, the differences in homozy-gous sequence variation are not reflected in the num-ber of homozygously altered CTCF anchors. The latter seems not to be changing across populations (Fig.5i).
The fruitful study of natural human knockouts per-formed on a cohort of 10,503 Pakistanis by the Human Knockout Project [40] made us investigate the homozy-gous SVs from the CHGV identified uniquely in a single population. We took the 1317 knocked out genes found in individuals from South Asia (in majority belonging to Urdu and Punjabi ethnic groups, over 70%) [40] and considered 656 CCDs they were located in. It turns out that homozygous SVs identified uniquely in Punjabi popu-lation intersect CTCF and RNAPII anchors in the largest number of CCDs (10 and 11 respectively) containing the
gene knockouts (Fig.5j), even though a moderate number of population-specific homozygous SVs was found for this group (Fig.5k). This suggests that gene knockouts may be accompanied (preceded, followed or assisted) by homo-zygous structural rearrangements.
For each of the continental groups, we prepared a list of patterns (similar to those described in the previous sec-tion) of anchor-intersecting SVs, which alter CCDs in the individuals belonging to this group. Even though most of the patterns are population-specific, we found 312 (6%) patterns common for all 5 continental groups (Fig. 5e). CCDs in which we found the common SV patterns are characterized by a particularly high number of gene pro-moters, including promoters of housekeeping genes (Fig. 5d). There are statistically more gene promoters in those CCDs than in other CCDs with modified anchors and in domains covering segments without changes in CTCF anchor sites. It is worth noticing that more pro-moters are located in CCDs containing CTCF anchors under variation than in those without them, which may suggest that the architecture of transcriptionally active genomic regions is more prone to mutation. CCDs with CTCF anchors under rare variation contain statistically more promoters of active genes than CCDs with CTCF anchors affected only by frequent SVs (Fig.5d). Moreover, rare SVs happen to affect CTCF anchors in domains con-taining outstanding number of promoters (Fig.5d). CCDs with rare variants in CTCF-interacting anchors can have up to 96 promoters of active genes (compared to 39 in CCDs with frequent SVs in anchors).
Regulation of gene transcription altered by topological variations in population
By combining information on chromatin interactions and population-scale genetic variation with transcriptome data from 462 lymphoblastoid cell lines gathered by the gEU-VADIS Consortium [41,42], we were able to draw first to our knowledge population-scale evidence-supported con-clusions on the functional relation between SVs and gen-ome architecture and provide a deeper insight into the functional role of genetic variation in the human genome.
(See figure on previous page.)
The results of our analysis indicate that SVs influence gene transcription primarily by rearranging local looping structure of the genome.
For 445 out of the 462 samples provided by the gEUVA-DIS Consortium, there are also genotypes available in the 1000 Genomes Project database. We thus used PEER-normalized [41] gene expression levels of these 445 individuals for the association with their geno-types to identify expression quantitative trait loci (eQTLs). We use the term eQTL for any variation of gen-omic sequence which is identified as having an effect on the gene transcription level. The eQTL analysis was per-formed only with SVs, excluding SNPs.
We performed principal component analysis (PCA) on the expression data, which pinpointed 14,853 genes having the biggest variation in expression rates among individuals from all 23,722 genes present in the gEUVADIS dataset. We then related the expression levels of each of the 14, 853 genes to genotypes (see the“Methods”section).
In the studies on eQTLs published so far [6,41,43–46], a genomic region of arbitrary size around a gene in ques-tion was convenques-tionally set, and only the genetic variants located within this linear region were tested for being eQTLs for this gene. We argue that a more natural ap-proach is to look for eQTLs within the whole topological domain the gene is located in. Therefore, for each of the selected genes, we evaluated the associations of its ex-pression levels with all the genotyped SVs residing in the same CCD. For every gene-SV pair, least-square linear regression was performed and the significance of the slope was then tested in the permutation test. The resulting
p values were adjusted for multiple testing to control the false discovery rate (FDR). We set a threshold of acceptance for FDR≤10% (see the“Methods”section).
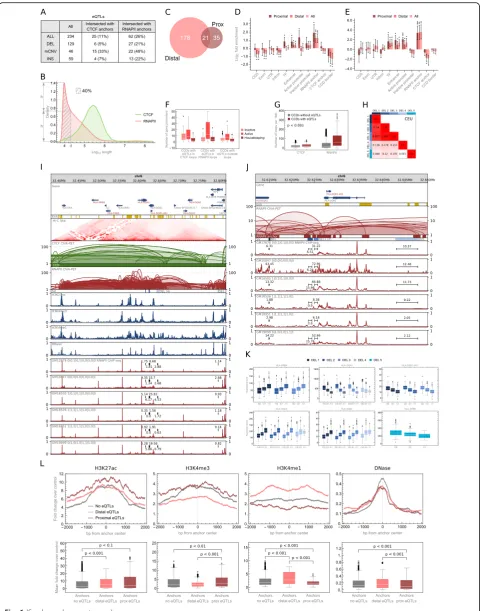
We identified 234 unique SV-eQTLs modifying ex-pression levels of 192 genes. The majority of the eQTLs found (55%) are deletions (Fig.6a).
Earlier studies on eQTLs were limited in exploring the causal relation between genetic variation and gene expression to analyzing gene-variant and exon-variant intersections [43, 45], or the influence of genetic variation on transcription factor binding sites (TFBSs), transcription start sites (TSSs), or transcription end sites (TESs) [41,46,47]. In particular, one of the latest to our knowledge big study on the impact of structural va-riation on human gene expression reported that over 88% of predicted causal SVs did not alter gene structure or dosage [22]. The study showed enrichment of causal non-coding SVs in regions occupied by transcription factors or surrounding genes at distances up to 10 kb, but no deepened analysis of these regions was per-formed. Our analysis gives a broader idea of this relation and sheds light on the mechanisms through which SVs take part in genome regulation.
In agreement with [22, 46, 47], we observe an enrich-ment of eQTLs in TFBSs, but we see significantly higher enrichment of these in the genomic regions responsible for chromatin spatial organization. We divided the identi-fied eQTLs into two sets: those located on the DNA chain closer than 17,800 bp to the genes they modify (proximal) and those located further apart (distal) (see the“Methods” section). The splitting value of 17,800 bp was chosen based on the distribution of RNAPII PET clusters lengths. It is a value for which the density of lengths of RNAPII clusters is equal to the half of the maximum density (Fig. 6b). The division is not exclusive—some of the eQTLs correlated with more than one gene are distal for one of them and proximal for other (Fig.6c).
Active promoters and TFBSs are enriched with proximal eQTLs demonstrating their importance as gene-adjacent regulatory sites. Enhancers apart from being enriched with proximal eQTLs are enriched with the distal ones and represent regulatory elements interacting with genes by the nuclear space. However, the genomic elements most enriched with both proximal and distal eQTLs are anchors of RNAPII PET clusters (Fig. 6d). The abundance of eQTLs in the anchoring regions of the strong chromatin interactions mediated by RNAPII reaffirms the crucial role of this element of genome architecture in gene regulation.
As an example of eQTLs altering chromatin looping mediated by RNAPII, we investigate 5 deletions located in a HLA region (Fig. 6i). All of these deletions affect RNAPII interacting anchors (Fig. 6j) and are correlated with one or more of 5 HLA genes neighboring them (Fig. 6k). Three of the deletions are in a very strong linkage disequilibrium (LD) with each other (tested on the Central European population, Fig.6h).
We hypothesize that proximal eQTLs modify TFBSs, TSSs, and TESs of genes as well as gene sequences but mostly they alter genes’ spatial contacts with regulatory elements and possibly with interaction centers, which has an immediate and straightforward influence on genes’ expression levels. Distal eQTLs have in turn higher potential to, apart from altering long-range RNAPII interactions, disrupt CTCF interactions that are longer than RNAPII-mediated chromatin loops (Fig. 6b) and shape the spatial structures of the whole topological domains.
Another example of identified eQTL which alters CTCF-mediated chromatin structure is duplication chr17:44341412-44366497 (Additional file2: Figure S23A) . It duplicates the border of a CCD, and its emergence correlates with the transcription of the KANSL1-AS1 gene (Additional file2: Figure S23B).
Even though we observed examples, we did not find anchors of CTCF PET clusters to be enriched with distal eQTLs (Fig.6d). The fact we note, however, is that 17 of the identified eQTLs (24% of the anchor-intersecting eQTLs) intersect both RNAPII and CTCF anchors (Fig.6a) and 36 (58%) of the eQTLs intersecting RNAPII anchors were detected in CCDs in which eQTLs target-ing CTCF anchors were also found. This suggests that a change in gene expression observed among individuals can often be a result of a coordinated modification of RNAPII and CTCF anchors, but more investigation is needed to confirm this claim. Interestingly, CCDs in which eQTLs alter RNAPII anchors tend to embrace more active genes and housekeeping genes than CCDs with eQTLs not overlapping any interacting segments (Fig.6f). On the other hand, CCDs with eQTLs in CTCF anchors contain many inactive genes (Fig.6f).
Furthermore, we suspect that the enrichment analysis does not indicate that alterations of CTCF anchors significantly contribute to the variation of gene ex-pression in population because the disruption of CTCF chromatin contacts would often provoke drastic changes in the local spatial organization of a genome not ob-served in healthy people. As we showed earlier, SNPs associated with disease favorably emerge in CTCF anchors (Fig. 4g).
For comparison with capture Hi-C (CHi-C) data, we mapped the identified eQTLs on genomic interactions reported in Mifsud et al. [33, 48]. Anchors of promoter-promoter and promoter-other CHi-C inter-actions were analyzed for the enrichment with the eQTLs (Additional file2: Figure S24). The analysis shows that CHi-C anchors containing promoters are enriched with proximal eQTLs and depleted of the distal ones. A similar effect can be observed for ChIA-PET RNAPII anchors intersected with promoters (Additional file 2: Figure S24). However, unlike CHi-C anchors containing enhancers, ChIA-PET anchors intersected with enhancers are significantly enriched with distal eQTLs. The results for ChIA-PET data highlight the role of distal enhancers in gene regulation and may suggest that the interactions identified in RNAPII ChIA-PET are more transcriptionally active than the ones reported from CHi-C.
To state more firmly the relationship between pro-ximal and distal eQTLs and chromatin activity, we collected (see the“Methods” section) sequencing (ChIP-seq) data for three histone modifications (H3K27ac, H3K4me3, H3K4me1) and information on chromatin accessibility (DNase-seq) and analyzed it in interaction anchors intersected with the eQTLs. H3K4me3 is primarily associated with promoters, H3K4me1 with active enhancers, and H3K27ac with active promoters and enhancers [29]. As expected, the interaction anchors altered by proximal eQTLs are enriched with promoter signal, whereas those affected by distal eQTLs with enhancer signal (Fig. 6l). This confirms that proximal eQTLs disrupt promoter-enhancer communication at the site of the promoter and distal eQTLs at the site of
(See figure on previous page.)
Fig. 6Role of chromatin rearrangements in the regulation of gene transcription.aTable summarizing identified eQTLs and their intersections with interaction anchors.bDensity plot showing genomic span distribution of PET clusters.dis the value (17,800 bp) by which eQTLs were split into proximal and distal.cVenn diagram showing the number of proximal (Prox) and distal eQTLs.dEnrichment/depletion of genomic elements with eQTLs. Error bars represent SD.eEnrichment/depletion of genomic elements with eQTLs of housekeeping genes. Error bars represent SD. fAbundance of gene promoters in CCDs, in which eQTLs were identified, see Fig.2c for box plot description.n= 16 (CCDs with eQTLs in CTCF loops), 32 (CCDs with eQTLs in RNAPII loops), and 106 (CCDs with eQTLs outside loops) sample points.gDistributions of chromatin loop density in CCDs in which eQTLs were identified and in other CCDs. The density is measured for a particular CCD as an average number of CTCF-/RNAPII-mediated chromatin loops covering a 1-Mb fragment of this CCD. Differences between the groups are significant (pvalues < 0.001), see Fig.2c for box plot description.n= 2125 (CCDs without eQTLs) and 142 (CCDs with eQTLs) sample points.hLinkage disequilibrium (measured asr2
the enhancer. The results are statistically significant, even though interaction anchors are enriched with chromatin marks in general (Fig. 6l) [17]. Furthermore, eQTLs emerge in densely connected genomic regions (Fig.6g, l). This is also reflected by the fact that a single eQTL often intersects more than one RNAPII interaction anchor (Fig. 6j).
We repeated the eQTL analysis described above for housekeeping genes only (selected based on Eisenberg and Levanon [49]) to see if we find eQTLs for them and where the potential eQTLs are localized (see the
“Methods” section). We found 36 unique eQTLs for 33
different housekeeping genes. None of the eQTLs is located within CTCF anchor, but we observe significant enrichment of them in RNAPII anchors (Fig.6e). There-fore, there are differences in the expression rates of housekeeping genes among the samples, and they are mainly correlated with alternations of long-range chroma-tin contacts mediated by RNAPII.
On the other hand, we separately analyzed immune-related genes as genes specific to the lymphoblastoid cell lines (see the “Methods” section). Fourteen eQTLs were identified for these genes, out of which 4 intersect CTCF anchors. Three of these are anchors which contain enhancers and 1 contains a promoter region.
Two of the immune-related eQTLs (deletion chr22: 39357694-39388574 and CNV chr22:39359355-39379392) cover the same CTCF anchor (Additional file 2: Figure S25A). Both are eQTLs for genes APOBEC3A, APO-BEC3B, and CTA-150C2.16 (Additional file 2: Figure S25B), but the deletion completely excises APOBEC3B gene. In the presented samples (Additional file2: Figure S25A), both of the SVs were identified, meaning that locus chr22:39357694-39388574 is (haplotype-specific-ally) excised in those genomes, which is reflected in CTCF signal for these samples.
Another example of an eQTL altering a CTCF anchor and regulating an immune-related gene is deletion chr17: 73107713-73108273 (Additional file2: Figure S26A). It is located over 750 kb apart from the correlated gene TRIM47 (Additional file2: Figure S26B).
Whether cell type-specific genes are distinguished targets for SVs altering core chromatin architecture (as CTCF is believed to form the backbone network of genomic inter-actions) is an interesting question. However, more exten-sive testing has to be done to explore this hypothesis.
Discussion
It is already well established that part of the transcriptional variation between genomes or pathogenic phenotypes can be caused by chromatin topological alterations, but we still lack extensive genome-wide testing to assess the abun-dance and importance of these events. Our understanding of the importance of chromatin architecture in genome
regulation is based mainly on particular cases of SVs dis-rupting local 3D chromatin structure and subsequently leading to the deregulation of transcription of particular genes (in most of the studied cases associated with dis-ease) [7, 9, 11]. There were more general insights into chromatin spatial rearrangements, but only in cancer ge-nomes and at a less detailed level of the whole topological domains and their boundaries [8, 10]. No attempt was made so far to assess the abundance of chromatin archi-tecture alterations in normal genomes, their functional impact, and the frequency with which genetic variations (related and not related with pathogenic phenotypes) tar-get genomic regions responsible for the proper chroma-tin folding. The latter is specifically intriguing in the context of genome-wide association studies showing that over 95% of identified SNPs are located outside coding sequences [5]. This study is the first such attempt.
We mapped genetic variants identified in individuals from 26 human populations in the 1000 Genomes Project and disease-associated SNPs from GWAS onto chromatin three-dimensional structure of human lymphoblastoid cell line represented by CTCF and RNAPII ChIA-PET data. Our strategy for analyzing high-resolution CTCF and RNAPII genomic interaction data gives a comprehen-sive insight into the impact of SVs on chromatin organization. In agreement with previous studies [15, 50,
structure. This hypothesis is consistent with the model presented by Tang et al. [17]. However, we suspect that the fact that we did not identify many examples of eQTLs located in CTCF anchors may also mean that the linear model used to detect eQTLs is too simple to account for complex nonlinear changes in gene transcription caused by modification of CTCF-mediated chromatin looping. This requires further investigation. Intriguingly, the evi-dence provided in this study identifies CTCF binding sites involved in the insulation of topological domains as frequently affected by duplications. This suggests that du-plications of domain boundaries can have a distinguished role in evolutionary adaptation, similarly to duplications of genome coding sequences [37,38].
We identified African and South Asian genomes as exhibiting the highest rates of structural variation in genomic interaction anchors and topological domain boundaries (Fig. 5a, b). South Asian genomes further stand out from the rest by having distinctively high numbers of mCNVs occurring in these genomic elements. This statistic is high within the continental group of South Asia mainly due to the input of three ethnic groups: Indian Telugu in the UK (ITU), Punjabi in Lahore, Pakistan (PJL) and Sri Lankan Tamil in the UK (STU) (Fig.5f, g). We attempted to link the high rates of genome topology-affecting SVs observed in South Asia continental group to high consanguinity rates exhibited by some of the populations in this group. However, we did not detect an association between those two. A further investigation is needed including chromatin conformation capture experiments for different ethnic groups to address this question. On the other hand, we do note that SVs unique for the PJL ethnic group target genomic interaction anchors in the highest number of topological domains carrying knocked out genes found in the Human Knock-out Project from all the populations sequenced in the 1000 Genomes Project (Fig. 5j). This suggests that gene knockouts may be accompanied (preceded, followed, or assisted) by homozygous structural rearrangements. Interestingly, we observe that the rate of depletion of population-specific SVs in structural elements of the re-ference 3D genome is the smallest for European genomes (Fig.5c and Additional file2: Figure S20). Given that the 3D genome we use as the reference was obtained from a sample of European ancestry, it may suggest that part of the SVs specific for genomes of other ancestry target genomic interactions unique for those populations and not represented by the reference. This is an argument for more diversity in generating 3D genome data. Interest-ingly, domains which topology is affected by SV patterns occurring in genomes from all continental groups carry a distinctively high number of genes, including house-keeping genes (Fig. 5d). We generally observe that domains in which we identified SVs targeting CTCF/
cohesin-mediated interaction anchors carry signifi-cantly more genes than domains in which SVs occur only outside the anchors. These results may suggest that the replication process exhibits specificity in gene-rich ge-nomic regions which causes common faults in copying sequences around genomic interaction sites which could be involved in this process. Another explanation could be that there is a set of topology-affecting SVs which occurred in gene-rich domains early in the evolution. The latter, however, does not explain the high abun-dance of genes in domains affected by rare SVs targeting CTCF/cohesin-mediated interaction anchors (Fig.5d).
The analysis of spatially interacting genomic segments was possible using data from ChIA-PET experiments which identify such segments with high accuracy genome-wide. We applied additional filtering on CTCF ChIA-PET interacting segments, checking them for the co-occupancy by CTCF and cohesin ChIP-seq peaks, to obtain a highly credible set of CTCF-mediated chromatin interactions supported by cohesin. In case of CTCF ChIA-PET, it is even possible to identify individual CTCF binding motifs involved in the formation of the interactions, which brings high precision to the analysis. Such analysis would not be possible using Hi-C data in case of which genomic inter-action segments are demarcated artificially, by segmenting the genome into adjacent bins of equal size and which resolution is rarely under the order of tens of kilobases, as a high resolution is obtained at the cost of very deep genome sequencing. The limitation of ChIA-PET ex-periment is that it captures chromatin interactions me-diated by a particular protein, in contrast to Hi-C which identifies interactions of all kinds. Thus, Hi-C is a more complete representation of chromatin contacts present in the cell nucleus. However, CTCF ChIA-PET detects struc-tural features exhibited by the non-specific Hi-C data. Data from these sources are highly correlated at the global whole-chromosome scale (Spearman’s correlation co-efficient in the range of 0.7–0.9) [17] and identify a very similar landscape of genomic structures at the local scale of topological domains (Fig. 1b) and chromatin loops (Fig. 1c). Moreover, the distinction between CTCF- and RNAPII-mediated interactions enabled us to spot the differences in the impact of SVs on them.
individualized chromatin interaction patterns and in silico models of chromatin structures in the absence of experimental data, which generation requires expertise and certain money investments. On the other hand, because of the data unavailability, we could not confront our predictions with experimentally generated genomic interaction maps. No new biological experiments were conducted to support the correctness of our predictions, as this is purely computational analysis. However, we presented examples supported by available ChIP-seq data-sets (Figs.2a,4a, and6j; Additional file2: Figure S2, S8, S9, S10, S11, S13, S15, S16, S23, S25, and S26) and genome-wide ChIP-seq analyses (Fig. 2d and Additional file 2: Figure S3 and S12) showing that predicting chromatin interactions based on ChIA-PET data for GM12878 and SVs from other lymphoblastoid cells is reasonable. Further-more, we presented 3D models of an extensively studied (including the execution of CRISPR/Cas9 experiments) genomic region showing that their features are perfectly in line with discoveries and claims reported on this region [11] and that they could serve as accurate models for the mechanisms described in the earlier study. We do not claim that the models generated with our modeling method can alone explain the mechanisms underpinning associations of some SVs with gene transcription or con-stitute a proof of such mechanisms actually being the cause of observed changes in gene transcription rates. However, we believe that they can be a supporting tool in the analysis of potential disruptive effects of studied SVs on chromatin spatial organization and functional conse-quences of these alterations, helping to design a compre-hensive study and to plan experiments more strategically.
We show that the topological variability of the human genome is rather limited (Additional file 2: Figure S18). However, because of the data used, the predictions are rather confined to lymphoblastoid cell lines. None-theless, our modeling method and web service providing the modeling tool can operate on uploaded data, if such data is at user’s disposal.
Conclusions
This is the first genome-wide study on the influence of genetic variants on the chromatin organization and topo-logical variability in the human population. It shows the critical impact of genetic variants on the higher-order organization of chromatin folding and provides a unique insight into the mechanisms regulating gene transcription at the population scale, among which the local arrange-ment of chromatin loops seems to be the leading one. This study highlights the importance and reason for further study on the role of chromatin architecture in genome regulation. It shows that further work on com-putational prediction of the chromatin 3D structures based on different factors changing among individuals is
required, as the emerging evidence shows that chromatin spatial organization is a crucial element to understand the genome regulation.
Methods
Genomic interactions
Genomic interactions analyzed in this study are 92,808 CTCF PET clusters and 100,263 RNAPII PET clusters identified by Tang et al. [17] for the GM12878 cell line (Additional file 1: Table S3 and S4) [18]. We refer the reader to this work for details on data processing pipe-line used to find these interactions. Briefly, pair-end reads (PETs) sequenced in long-read ChIA-PET ex-periment were mapped to the human reference genome (hg19). Inter-ligation PETs were selected by the criterion of genomic span between the two ends of a PET ex-ceeding 8 kb. Inter-ligation PETs overlapping at both ends were clustered together creating unique contacts (PET clusters) between 2 specific interaction loci, of strength equal to the size of the cluster. Anchors of CTCF PET clusters located within the distance of 500 bp along the DNA sequence were merged to more accurately corres-pond to loci covered by single CTCF binding peaks. This step led to further clustering of CTCF PET clusters and reduced their number from 92,808 to 80,157. Individual inter-ligation PET clusters and PET clusters of strength smaller than 4 are referred to as singletons.
ChIP-seq consensus peaks
We analyzed the directionality of CTCF interactions similarly to Tang et al. [17]. CTCF, SMC3 and RAD21 uniform ChIP-seq peaks available for the GM12878 cell line were downloaded from the ENCODE database (Additional file 1: Table S5) [52]. We extracted the 4-way consensus regions from all 4 sets of CTCF peaks to get highly credible CTCF-binding peaks. The same con-sensus was performed on SMC3 and RAD21 ChIP-seq segments to identify cohesin-binding peaks. Finally, 25, 250 consensus regions from the CTCF and cohesin consensus peaks were obtained.
CTCF motif identification
24,013 out of the 25,250 CTCF/cohesin consensus peaks. Only the motifs having a score higher than 0 were consid-ered as valid, and for each peak, a motif with the highest score was selected.
Assigning orientation to CTCF loops
The CTCF motifs were overlapped with CTCF PET clus-ters. Forty-four thousand three hundred eighty out of the 80,157 CTCF PET clusters had both anchors overlapped by CTCF/cohesin consensus peaks (Additional file 1: Table S1), and only 2334 (3%) of them had no inter-sections with the consensus peaks at neither of sides. For 40,624 out of the 44,380 clusters (92%), at least one CTCF motif was found at both anchors. Thirty-three thousand sixty-two of these had exactly one motif at either side. PET clusters with anchors having more than one CTCF motif and of contradictory orientations were filtered out. From the 37,289 CTCF PET clusters with motifs of unique orientation in both anchors, 24,181 (65%) had motifs of convergent orientation at the two anchors, 6118 (16%) had motifs of tandem right orientation, 6089 (16%) PET clusters were of tandem left orientation, and 901 (2%) were of divergent orientation.
Chromatin contact domains
In this study, we used 2267 CTCF-mediated chroma-tin contact domains (CCDs) identified by Tang et al. (Additional file1: Table S6) [18]. We refer the reader to this work for the details of CCD calling. Briefly, CCDs were identified by searching each chromosome for ge-nomic segments continuously covered with CTCF PET clusters supported by CTCF/cohesin consensus peaks. Each identified CCD starts where the most upstream CTCF anchor from all the anchors of the CTCF PET clusters comprising the CCD starts and ends where the most downstream CTCF anchor ends. To define the borders of the CCDs more accurately, CTCF motifs found in the CTCF/cohesin consensus peaks and positioned within outermost anchors were identified. From these, the outermost CTCF motifs were selected as CCD borders. CTCF/cohesin consensus peaks with CTCF motifs were found in 4346 (96%) out of the 4534 outermost anchors. In case of the remaining 188 anchors, the strongest CTCF motifs identified in the full DNA sequence covered by the anchors were selected as indicators of CCD boundaries. Genomic regions complementary to CCDs (less hg19 reference genome assembly gaps) were defined as CCD gaps.
Enhancers and promoters
Definitions of enhancers used throughout this study were extracted from ChromHMM [56] hg19 annotations for the GM12878 cell line downloaded from the ENCODE database (Additional file1: Table S5) [52]. Both weak and
strong enhancer annotations were adopted. Promoters were defined as ± 2 kb regions surrounding the gene tran-scription start sites (TSSs). The TSS coordinates were adopted from the GENCODE release 27 (mapped to hg19) [57, 58]. Only the promoters for protein-coding genes were considered. Promoters were defined as active if overlapped with anchors of RNAPII PET clusters or with RNAPII consensus ChIP-seq peaks and defined as in-active otherwise. RNAPII consensus peaks were obtained by performing consensus on 3 sets of RNAPII uniform ChIP-seq peaks available for the GM12878 cell line in the ENCODE database (Additional file1: Table S5).
Enrichment analyses of SVs in genomic elements
In this study, we tested various genomic elements for the enrichment or depletion with structural variants (SVs). These tests were conducted according to a com-mon scenario. Genomic elements of a given type repre-sented by their positions in the hg19 reference genome were intersected with the positions of SVs. The ones hav-ing at least 1 bp overlap with at least 1 SV were counted. The genomic elements were then intersected with simu-lated SVs from 1000 sets generated by randomly shuffling positions of the original SVs, and the null distribution of counts of genomic elements overlapped with SVs was calculated. Each shuffled set contained the same number of elements in total and the same number of elements in subsets (deletions, duplications, etc.) as the real SV set. Elements of these sets were equally distributed on chro-mosomes and equally distributed in length to the real SVs. The operations of shuffling and intersecting genomic seg-ments were performed with BEDTools (version 2.26.0) [53]. The enrichment or depletion of genomic elements overlapped with the real SVs compared to the same ele-ments overlapped with randomly positioned simulated SVs was expressed as log2 fold change of the number of the former versus the mean of the distribution of the number of the latter. Values of the measure were re-presented by the height of bars in the plots. Error bars in the plots show standard deviations of log2 fold changes in each permutation test. To estimate the sta-tistical significance of the test results, one-sided pvalues were calculated from the simulated distributions and marked above the bars by stars (3 stars,pvalue < 0.001; 2 stars,pvalue < 0.01; 1 star,pvalue < 0.1).
Subsets of SVs in enrichment analyses
expression (eQTLs) was subdivided into 2 sets: a set of eQTLs located closer on the DNA chain than 17,800 bp apart from the genes they modified and a set of eQTLs located further apart from their genes. The distances were calculated between TSSs (as defined in GENCODE version 12) [58] and centers of eQTL segments.
Subsets of GWAS SNPs
The set of GWAS SNPs used in this study was derived from the NHGRI-EBI GWAS Catalog, version from January 31, 2018 [32]. SNPs of traits associated with autoimmune diseases and hematological parameters were extracted as separate sets and mapped to dbSNP Build 150 for hg19 human genome assembly. SNPs mapping outside the main chromosome contigs, not having dbSNP ID or without coordinates on the hg19 and records containing multiple SNPs were excluded. This resulted in 2330 and 3919 unique SNPs associated with autoimmune diseases and hematological parameters respectively. For permutation tests with SNPs identified in healthy samples in the 1000 Genomes Project, we extracted a random sample of 1 million elements from the whole set of SNPs to limit the computation time and storage space.
Genomic elements in enrichment analyses
Analyzed in permutation tests, genomic elements asso-ciated with genes (annotated protein-coding sequence regions (CDSs), untranslated regions (UTRs) in protein-coding regions, exons, and introns) were adopted from the GENCODE release 27 (mapped to hg19). Permutation tests with eQTLs were an exception—in this case, gene elements from version 12 of GENCODE were used to maintain the consistency with the expression data which was analyzed with the earlier version of GENCODE. The positions of transcription factor-binding sites (TFBSs) were adopted from a file with uniform TFBS peaks downloaded from ENCODE (Additional file1: Table S5).
Analysis of CTCF interaction anchors altered by SNPs To test the impact of SNPs on the probability of CTCF binding to a CTCF anchor, we searched the nucleotide sequence of the anchor for CTCF motifs and compared the number and scores of these motifs with the CTCF motifs identified in the nucleotide sequence of this anchor after the introduction of alternative alleles. Only the motifs with a score higher than 0 were taken into consideration. Identification of CTCF motifs was per-formed as described in the“CTCF motif identification” section above.
We used ggseqlogo R package [59] to generate sequence logos from the frequency matrix MA0139.1 downloaded from the JASPAR database.
mRNA quantifications
PEER-normalized expression levels of 23,722 genes provided by the gEUVADIS Consortium [42] were used in our analyses. We refer the reader to Lappalainen et al. [41] for details on the process of transcriptome quantifi-cations. In short, RNA-seq read counts over genes anno-tated in GENCODE (version 12) were calculated. This was done by summing all transcript RPKMs per gene. Read counts were corrected for variation in sequencing depth by normalizing to the median number of well-mapped reads among the samples and for technical noise. The latter was removed using PEER [60]. We logarithmized the corrected quantifications and stan-dardized the distributions of transcription rates (for each gene individually).
Genotypes
Definitions of genomic sequence variations were taken from Sudmant et al. [25]. This SV set is a refined version of the callset released with the 1000 Genomes Project marker paper [36]. Only SVs (deletions, duplications, copy number variants, inversions, and insertions) were considered; SNPs were not included in the analysis. The genotype of an individual was represented as a sum of SV copies present on homologous chromosomes of the individual. Deletions were indicated by negative num-bers. For example, if an individual had a deletion on both copies of a chromosome, the genotype was−2. If it had 2 more copies of a genomic region (in relation to the reference genome) on one chromosome from the pair and 1 additional copy of this region on the second chromosome from the pair, the genotype was 3. Geno-types unchanged compared to the reference sequence (hg19 in this case) had codes 0. Genotypes of abundance lower than 1% in the studied population were neglected.
Linear models
genes of the largest contribution to the variance in gene transcription between samples. Every SV lying in the same CCD as one of these genes was tested for being eQTL for this gene. Least-squares linear regression between expres-sion rates and genotypes was performed for each gene-SV pair. The slopes of the linear models were tested for statis-tical significance. First, for each linear model, two-sided
p value was calculated in the test with a null hypo-thesis that slope is 0 (Wald test with t-distribution of the test statistics). Second, for each gene, we permu-tated the expression rates relative to genotypes 1000 times, recalculating at each iteration the linear regression for each gene-SV pair and recording the minimalpvalue among all pairs. Adjusted p values were calculated for each gene by dividing the ranks of the observedpvalues in the list of p values obtained in permutations by the number of permutations. Finally, to correct for multiple testing across genes, we applied the Benjamini-Hochberg procedure to the adjustedpvalues, estimatingqvalues. At FDR 0.1, we found 192 genes with eQTLs. The same pro-cedure was employed to identify eQTLs for housekeeping genes, except that PCA step was omitted. By mapping the names of housekeeping genes reported in Eisenberg and Levanon [49] on GENCODE (version 12), we obtained a list of 3784 genes. We found eQTLs for 33 of them. Lists of discovered eQTLs are provided in Additional file 1: Table S7 and S8.
Immune-related genes
Names and coordinates on the hg19 assembly of immun-ity genes were downloaded from InnateDB [61]. The gene names were mapped on GENCODE (version 12) for the purpose of the eQTL analysis. The final gene set contained 1051 elements.
ChIP-seq signal tracks
Raw sequencing data from ChIP-seq experiments published by Kasowski et al. [23] was processed to obtain signal tracks of CTCF and histone marks for 10 lymphoblastoid cell lines (GM12878, GM10847, GM12890, GM18486, GM18505, GM18526, GM18951, GM19099, GM19238, GM19239) [24]. The sequencing reads were aligned to the hg19 as-sembly using Bowtie2 (version 2.3.4.1) aligning tool [62]. The alignments were then passed to the bam-Coverage utility from the deepTools2.0 (version 3.0.2) toolkit [63] to obtain RPM values genome-wide (the fol-lowing command was evoked: bamCoverage -b input.bam -o output.bw -of bigwig --binSize 10 --numberOfProcessors max/2 --normalizeUsing CPM --ignoreForNormalization chrX --extendReads --samFlagInclude 64). Sequencing reads for every sample and for every experimental replicate were processed separately. Signals prepared for different biological replicates but for the same sample were merged to an averaged signal using the mean operator from the
WiggleTools1.2 package [64]. Each CTCF signal track included in the figures presents RPM values for a par-ticular genomic region divided by the maximal value of the signal in this region.
The same post-alignment steps were applied to obtain signal tracks for SMC3 and RAD21 from the alignments downloaded from ENCODE (Additional file1: Table S5).
H3K27ac, H3K4me3, H3K4me1, and DNase-seq data analyzed in the “Regulation of gene transcription altered
by topological variations in population”section was down-loaded from ENCODE in a form of bigWig files con-taining signal fold change over control (Additional file1: Table S5).
Presented RNAPII signals were downloaded from the UCSC database (Additional file1: Table S5).
Phased ChIP-seq signal tracks
Haplotype-specific CTCF and H3K4me1 ChIP-seq signals for 10 lymphoblastoid cell lines (GM12878, GM10847, GM12890, GM18486, GM18505, GM18526, GM18951, GM19099, GM19238, GM19239) were obtained from the raw sequencing data [24]. The reads sequenced for a par-ticular cell line were aligned with Bowtie2 (version 2.3.4.1) aligning tool to the individualized nucleotide sequences of maternal and paternal chromosomes of this cell line. Only perfectly aligned reads were considered as valid. The sequences of maternal and paternal chromosomes were prepared with the vcf2diploid (version 0.2.6) tool from the AlleleSeq pipeline [65] using SNP phasing information from phase 3 of the 1000 Genomes Project. Additionally, the sequences of maternal and paternal chromosome 1 including SNP and SV phasing information from phase 3 of the 1000 Genomes Project were prepared. VCF files for chromosome 1 were processed by a custom script to represent alternative alleles as a sequence rather than SV identifier. Then, CTCF and H3K4me1 ChIP-seq data for 10 lymphoblastoid cell lines were mapped to those mater-nal and patermater-nal sequences. To enable the comparison of phased ChIP-seq signals including SNP and SV infor-mation between individuals, aligned reads were re-mapped to hg19 reference with CrossMap (version 0.2.5) [66]. This step required chain files which were prepared as described in Minimal Steps For LiftOver [67]. Separate ChIP-seq signals for maternal and pa-ternal chromosomes of the individual samples were calculated from the alignments prepared for the respective chromosomes analogously to the non-phased signals.
Linkage disequilibrium calculation