M E T H O D
Open Access
Quantifying the benefit offered by
transcript assembly with Scallop-LR on
single-molecule long reads
Laura H. Tung
1,2, Mingfu Shao
3and Carl Kingsford
1*Abstract
Single-molecule long-read sequencing has been used to improve mRNA isoform identification. However, not all single-molecule long reads represent full transcripts due to incomplete cDNA synthesis and sequencing length limits. This drives a need for long-read transcript assembly. By adding long-read-specific optimizations to Scallop, we developed Scallop-LR, a reference-based long-read transcript assembler. Analyzing 26 PacBio samples, we quantified the benefit of performing transcript assembly on long reads. We demonstrate Scallop-LR identifies more known transcripts and potentially novel isoforms for the human transcriptome than Iso-Seq Analysis and StringTie, indicating that long-read transcript assembly by Scallop-LR can reveal a more complete human transcriptome.
Keywords: Transcript assembly, Third-generation sequencing, Long read, RNA-seq
Background
More than 95% of human genes are alternatively spliced to generate multiple isoforms [1]. Gene regulation through alternative splicing can create different functions for a single gene and increase protein-coding capacity and proteomic diversity. Thus, studying the full transcrip-tome is crucial to understanding the functionality of the genome. In the past decade, high-throughput, short-read sequencing technologies have become powerful tools for the characterization and quantification of the transcrip-tome. However, due to limited read lengths, identify-ing full-length transcripts from short reads and assem-bling all spliced RNAs within a transcriptome remain challenging problems. In recent years, third-generation sequencing technologies offered by Pacific Biosciences (PacBio) and Oxford Nanopore Technologies (ONT) pro-duce sequences of full cDNA or RNA molecules, promis-ing to improve isoform identification and reducpromis-ing ambi-guity in mapping reads [2]. Long reads offer various benefits such as covering the entire molecule in the major-ity of cases and determining the allele from which the
*Correspondence:[email protected]
1Computational Biology Department, School of Computer Science, Carnegie Mellon University, Pittsburgh, PA, 15213 USA
Full list of author information is available at the end of the article
RNA molecule originated by identifying single nucleotide variations (SNVs) affecting each single RNA molecule [3]. Long reads are also able to capture gene structures accurately without annotation and identify novel splice patterns that are not found by short reads [2]. Long reads have been used for genome assembly and can be used to identify functional elements in genomes that are missed by short-read sequencing [4–6]. Hybrid sequencing com-bining long reads and short reads can improve isoform identification and transcriptome characterization [7, 8]. Hybrid genome assemblers taking advantages of both short and long reads have also been developed [9–12]. Long reads are also useful in identifying novel long non-coding RNAs and fusion transcripts [13] and in studying specific disease-determinant genes [14].
A main challenge associated with long-read technolo-gies is high error rates. PacBio produces reads with average lengths up to 30 kb, and its error rate for “sub-reads” (raw reads, which are original lower quality reads as opposed to consensus reads) is ∼10–20%. Continu-ous long read (CLR) is the original polymerase read (by reading a template with the DNA polymerase), and sub-reads are sequences generated by splitting the CLR by the adapters (a full-pass subread is flanked on both ends by adapters). However, PacBio’s “ROI” (“Read of Insert”, consensus reads) displays a higher quality than subreads.
Circular Consensus Sequence (CCS) reads are a type of ROI and are generated by collapsing multiple subreads when≥2 full-pass subreads are present. ONT produces longer reads with even higher error rates (error rates for “1D” raw reads, > 25%; error rates for “2D” consen-sus reads, 12-20%) [15]. Error-correction methods using short reads (such as the error correction tool LSC [16]) have been created to correct the high rate of errors in long reads; however, error correction may create artifacts so that the corrected long reads may no longer be true single-molecule reads [17].
We focus on transcript assembly of long reads, aiming to discover more novel isoforms. Although it is often thought that long reads are full-length transcripts and isoforms with no assembly required1, in fact the success rate of the sequenced cDNA molecules containing all splice sites of the original transcripts depends on the completeness of cDNA synthesis [17]. Sharon et al. [17] found that a CCS read could correspond to an incomplete transcript as a consequence of incomplete cDNA synthesis, although a CCS read represents the full cDNA molecule. They found that, in their experiment, for transcripts > 2.5 kb, full-length reads that represent the original transcripts are less likely to be observed than those for transcripts < 2.5 kb. Tilgner et al. [3] also found that, in their experiment, reads representing all splice sites of the original tran-scripts are more likely to be observed for trantran-scripts≤3 kb. The cDNA synthesis methods impose limitations on long reads [18] even though with increasing performance the sequencing technologies can be capable of sequenc-ing long full-length transcripts. In addition, long reads may still be limited by the sequencing length limit of the platform [19]. Thus, incomplete cDNA synthesis plus the sequencing length limit could cause PacBio’s consensus long reads to miss a substantial number of true transcripts [19], especially longer transcripts. This suggests that the transcript assembly of long reads is still needed, since it is possible that those CCS reads corresponding to incom-plete transcripts could be assembled together to recover the original full transcripts.
Long read lengths and high error rates pose compu-tational challenges to transcript assembly. No published transcript assembler has been adapted and systematically tested on the challenges of long-read transcript assem-bly yet. Aiming to handle these challenges, we developed a reference-based long-read transcript assembler called Scallop-LR, evolved from Scallop, an accurate short-read transcript assembler [20]. Scallop-LR is designed for PacBio long reads. Scallop-LR’s algorithms are tai-lored to long-read technologies, dealing with the long read lengths and high error rates as well as taking advantage
1Pacific Biosciences. ARCHIVED: Intro to the Iso-Seq Method: Full-length
transcript sequencing. June 2, 2014. https://www.pacb.com/blog/intro-to-iso-seq-method-full-leng
of long-read-specific features such as the read bound-ary information to construct more accurate splice graphs. A post-assembly clustering algorithm is also added in Scallop-LR to reduce false negatives.
We analyzed 26 long-read datasets from NIH’s Sequence Read Archive (SRA) [21] with Scallop-LR, Iso-Seq Analysis2 and StringTie [22, 23]. Iso-Seq Anal-ysis, also known as Iso-Seq informatics pipeline, is a software system developed by PacBio that takes subreads as input and outputs polished isoforms (transcripts) through collapsing, clustering, consensus calling, etc. Iso-Seq Analysis does not perform assembly per se. The clustering algorithm in Iso-Seq Analysis clusters reads based on their isoform of origin. An algorithm that clusters long reads based on their gene family of origin was recently proposed [24]. StringTie was originally designed as a short-read transcript assembler but can also assemble long reads. StringTie outperforms many leading short-read transcript assemblers [22].
Through combined evaluation methods, we demon-strate that Scallop-LR is able to find more known tran-scripts and novel isoforms that are missed by Iso-Seq Analysis. We show that Scallop-LR can identify 2100– 4000 more known transcripts (in each of 18 human datasets) or 1100–2200 more known transcripts (in each of eight mouse datasets) than Iso-Seq Analysis. The sen-sitivity of Scallop-LR is 1.33–1.71 times higher (for the human datasets) or 1.43–1.72 times higher (for the mouse datasets) than that of Iso-Seq Analysis. Scallop-LR also finds 2.53–4.23 times more (for the human datasets) or 2.38–4.36 times more (for the mouse datasets) potential novel isoforms than Iso-Seq Analysis. Further, Scallop-LR assembles 950–3770 more known transcripts and 1.37– 2.47 times more potential novel isoforms than StringTie and has 1.14–1.42 times higher sensitivity than StringTie for the human datasets.
Methods
Scallop-LR algorithms for long-read transcript assembly Scallop-LR is a reference-based transcript assembler that follows the standard paradigm of alignment and splice graphs but has a computational formulation dealing with “phasing paths.” “Phasing paths” are a set of paths that carry the phasing information derived from the reads spanning more than two exons. The reads are first aligned to a reference genome and the alignments are transformed into splice graphs, in which vertices are inferred (par-tial) exons, edges are splice junctions, the coverage of exon is taken as the vertex weight, and the abundance of splice junction is used as the edge weight. We decom-pose the splice graph to infer a small number of paths (i.e.,
2Pacific Biosciences. SMRT Tools Reference Guide v5.1.0. 2018.https://www.
predicted transcripts) that cover the topology and fit the weights of the splice graph.
Scallop-LR represents long reads as long phasing paths, preserved in assembly
Unlike short reads, most long reads span more than two exons. Thus, if the multi-exon paths of long reads are bro-ken when decomposing splice graphs (which is more likely to occur since the majority of long reads span large num-bers of exons), many long reads would not be correctly covered by assembled transcripts. Thus, Scallop-LR rep-resents long reads as long phasing paths and preserves phasing paths in assembly. This is particularly impor-tant since we want every phasing path (and thus every long read) to be covered by some transcript so that the assembly can represent the original mRNAs. Scallop-LR adapted the phasing-path preservation algorithm from Scallop when decomposing splice graphs into transcripts. The Scallop algorithm uses an iterative strategy to grad-ually decompose the splice graph while achieving three objectives simultaneously:
a) Preserving all phasing paths in assembled transcripts when decomposing the splice graph,
b) Minimizing the read coverage deviation using linear programming, and
c) Minimizing the number of predicted transcripts by reducing an upper bound on the number of required paths.
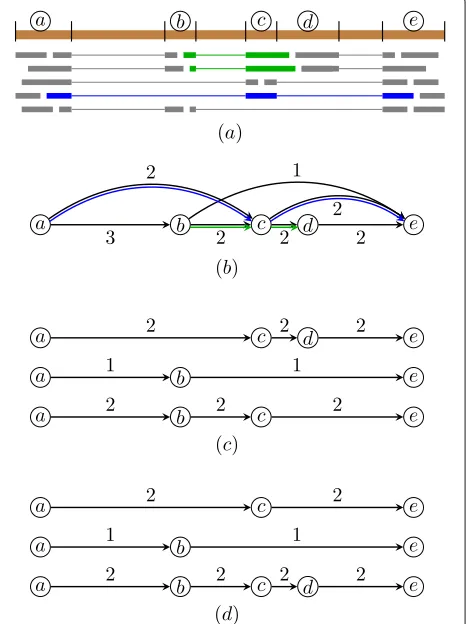
Figure1 shows a simple example of a splice graph by representing long reads as phasing paths and its decom-position without and with preservation of long reads’ phasing paths. The example illustrates that when decom-posing the splice graph without preserving long reads’ phasing paths, the multi-exon paths of some long reads are broken, and thus not all long reads are correctly covered by assembled transcripts. When decomposing the splice graph by preserving long reads’ phasing paths, all long reads are correctly covered by assembled transcripts.
By representing long reads as long phasing paths, Scallop-LR makes full use of the information in long reads through phasing-path preservation, so that assembled transcripts can best represent the input long reads.
Additional Scallop-LR algorithms
To improve long-read assembly accuracy, Scallop-LR extracts the boundary information from long reads and identifies transcript boundaries to build a more accu-rate splice graph. In single-molecule sequencing, there are two types of long reads produced: full-length reads and non-full-length reads. Full-length reads are the reads that have a 5 primer, 3 primer, and polyA tail, which are the reads that represent full-length transcripts they originated from. Non-full-length reads do not represent
Fig. 1Example of a splice graph by representing long reads as phasing paths and its decomposition with and without preservation of long reads’ phasing paths.aAlignment of reads to the reference genome. Inferred (partial) exons are marked with letters. Green and blue colored reads are long reads spanning more than two exons. Scallop-LR represents these long reads as a set of phasing paths:
{(a,c,e),(b,c,d)}.bThe corresponding splice graph (with weights for all edges) and associated phasing paths (in green and blue).c
Decomposition of the splice graph without preservation of long reads’ phasing paths. Although all weights are perfectly matched, both phasing paths are “broken” (none of the three decomposed paths contains(b,c,d)or(a,c,e)).dDecomposition of the splice graph with preservation of long reads’ phasing paths. All phasing paths are correctly covered by assembled transcripts
[image:3.595.307.540.89.401.2]We refer to non-full-length boundary reads (with one side boundary) and full-length reads (with two side boundaries) as “boundary reads” for the side they have a boundary. We use theClassify tool in Iso-Seq Analy-sis to obtain full-length and non-full-length CCS reads. The Scallop-LR algorithm extracts the boundary infor-mation of each read from the Classify results and uses it to deduce starting/ending boundaries in the splice graph. Specifically, when there are a certain number of bound-ary reads whose boundaries align within an exonic region in the genome with very similar boundary positions (the default minimum number is 3), the algorithm defines it as a starting or ending boundary:
Suppose there are some 5end boundary reads aligned to the genome at positions [a+δ1,x1], [a+δ2,x2], [a+ δ3,x3], etc., where|δ1|,|δ2|,|δ3|,. . .are within a predefined
allowance of difference for matching positions andx1,x2,
x3, . . . are the ending positions of the aligned genomic
regions of these reads, then this is a signal that positiona corresponds to a starting position of a transcript. Thus, in the splice graph, we add an edge connecting the sources to the vertex corresponding to the exonic region [a,c] in the genome (wherecis the ending position of this exonic region).
Similarly, suppose there are some 3end boundary reads aligned to the genome at positions [x1,b+δ1], [x2,b+ δ2], [x3,b+δ3], etc., where|δ1|,|δ2|, |δ3|,. . .are within
a predefined allowance of difference for matching posi-tions and x1, x2, x3, . . .are the starting positions of the
aligned genomic regions of these reads, then this is a sig-nal that positionbcorresponds to an ending position of a transcript. Thus, in the splice graph, we add an edge connecting the vertex corresponding to the exonic region [d,b] in the genome (wheredis the starting position of this exonic region) to the targett.
This is for the forward strand. For the reverse strand, the situation is opposite. Specifically, the algorithm first sorts all boundary positions from boundary reads together with splice positions. The algorithm identifies a new transcript boundary if the number of closely adjacent boundary posi-tions of the same type (i.e., not separated by any different type of boundary or splice position in the sorted list) reaches a threshold (by default 3). For these closely adja-cent boundary positions of the same type in the sorted list, if they are 5 boundary positions, the algorithm reports the leftmost one as the 5transcript boundary coordinate. Similarly, if they are 3boundary positions, the algorithm reports the rightmost one as the 3 transcript boundary coordinate.
To increase the precision of long-read assembly, Scallop-LR uses a post-assembly clustering algorithm to reduce the false negatives in the final predicted tran-scripts. For transcripts with very similar splice positions, the algorithm clusters them into a single transcript. “Very
similar splice positions” means (a) these transcripts have the same number of splice positions and (b) for each splice position, their position differences are within a predefined allowance (the default allowance is 10 bp; the allowance can be set in a parameter). This allowance is for the sum of the difference (absolute value) of starting position and the difference of ending position for a splice position. We use a single-linkage clustering method to group the assembled transcripts. Specifically, we first build an undi-rected graph in which vertices represent all assembled transcripts. We iterate through all pairs of assembled tran-scripts, and if any two transcripts are “very similar” (i.e., all their splice positions’ differences are less than a pre-defined allowance), we add an edge between these two transcripts (i.e., vertices). We then find all connected com-ponents in this graph; each connected component is a cluster. For each cluster, we identify the transcript with the highest (predicted) abundance and use this transcript to represent this cluster. The abundance of this consensus transcript is then set to the sum of the abundances of all transcripts in this cluster. We modify this consensus tran-script so it spans the trantran-scripts in the cluster by extending the boundary positions of its two end-exons as needed: its left position is set to the leftmost position among all transcripts in the cluster; its right position is set to the rightmost position among all transcripts in the cluster. This clustering collapses “nearly redundant” transcripts and thus increases the precision of assembly.
The Scallop-LR algorithm deals with the high error rates in long reads when building the splice graph. Errors in long reads are mostly insertions and deletions, which may lead to mis-alignments around splice positions. When identifying splice positions from long-read alignments during the construction of the splice graph, the algorithm takes into account that a single insertion or deletion in the middle of the alignment may be caused by sequenc-ing errors in long reads and therefore ignore these small indels (by treating them as alignment match and count-ing towards to the coverage of the correspondcount-ing ver-tex) when determining the splice positions. Moreover, long deletions due to sequencing errors may be falsely marked as splice junctions by aligners. Thus, Scallop-LR introduces a parameter (by default 50) as the minimum size of introns to filter out such false-negative splice junctions.
Combined evaluation methods
Gffcompare3 is used to identify correctly predicted transcripts and the resulting sensitivity and precision by comparing the intron chains of predicted transcripts to the reference annotation for matching intron-exon struc-tures. A correctly predicted known transcript has an exact intron-chain matching with a reference transcript. Sen-sitivity is the ratio of the number of correctly predicted known transcripts over the total number of known tran-scripts, and precision is the ratio of the number of cor-rectly predicted known transcripts over the total number of predicted transcripts. We generate the precision-recall curve (PR curve) based on the results of Gffcompare by varying the set of predicted transcripts sorted with cov-erage and compute the metric PR-AUC (area under the PR curve) which measures the overall performance. Gff-compare also reports “potential novel isoforms” that are predicted transcripts sharing at least one splice junction with reference transcripts, though this criterion for poten-tial novel isoforms is weak when transcripts contain many splice junctions.
To further examine novel isoforms, we use the evalua-tion method SQANTI [25] that classifies novel isoforms into Novel in Catalog (NIC) and Novel Not in Catalog (NNC). A transcript classified as NIC either contains new combinations of known splice junctions or contains novel splice junctions formed from known donors and accep-tors. NNC contains novel splice junctions formed from novel donors and/or novel acceptors. The criterion for NIC is stronger compared with that of potential novel iso-forms in Gffcompare, and we conjecture that NICs may be more likely to be true novel isoforms than wrongly assembled transcripts. SQANTI also reports Full Splice Match (FSM) that is a predicted transcript matching a ref-erence transcript at all splice junctions and Incomplete Splice Match (ISM) that is a predicted transcript match-ing consecutive, but not all, splice junctions of a reference transcript.
Gffcompare and SQANTI report transcripts that fully match, partially match, or do not match reference tran-scripts, but do not report how many trantran-scripts, for example, have 75–95% or 50–75% of bases matching a reference transcript. These ranges of matched fractions would give us a more detailed view of the overall quality of assembly. Thus, we use rnaQUAST [26] that measures the fraction of a predicted transcript matching a ref-erence transcript. rnaQUAST maps predicted transcript sequences to the reference genome using GMAP [27] and matches the alignments to the reference transcripts’ coor-dinates from the gene annotation database. rnaQUAST measures the fraction of a reference transcript that is cov-ered by a single predicted transcript, and the fraction of
3The Center for Computational Biology at Johns Hopkins University.
GffCompare: Program for processing GTF/GFF files.https://ccb.jhu.edu/ software/stringtie/gffcompare.shtml
a predicted transcript that matches a reference transcript. Based on the results of rnaQUAST, we compute the dis-tribution of predicted transcripts in different ranges of fractions matching reference transcripts, and the distribu-tion of reference transcripts in different ranges of fracdistribu-tions covered by predicted transcripts. rnaQUAST also reports unaligned transcripts (transcripts without any significant alignments), misassembled transcripts (transcripts that have discordant best-scored alignments, i.e., partial align-ments that are mapped to different strands, different chromosomes, in reverse order, or too far away), and unannotated transcripts (predicted transcripts that do not cover any reference transcript).
We use Transrate [28] for sequence-based evaluation to obtain statistics of predicted transcripts such as the mini-mum, maximini-mum, and mean lengths; the number of bases in the assembly; and numbers of transcripts in different size ranges.
The reference annotations we use in Gffcompare,
rnaQUAST, and SQANTI are Ensembl Homo sapiens
GRCh38.90 and Mus musculus GRCm38.92. The refer-ence genomes we use are Ensembl GRCh38 for human and GRCm38 for mouse when running rnaQUAST and SQANTI or aligning long reads to the genome (“Analysis workflow for analyzing the SRA PacBio datasets” section).
Data acquisition and preprocessing
We obtained PacBio datasets for Homo sapiens and Mus musculus from SRA [4, 21, 29–32]. In most of the PacBio datasets in SRA, one BioSample has multi-ple SRA Runs because the experimenters used multimulti-ple “movies” to increase the coverage so that low-abundance, long isoforms can be captured in analysis. The exper-imenters also used a size selection sequencing strat-egy, and thus, different SRA Runs are designated for different size ranges. Therefore, we use one BioSam-ple instead of one SRA Run to represent one dataset in our analysis, and we merge multiple SRA Runs that belong to the same BioSample into that dataset (see Addi-tional file1: Section 1 about “movies” and size selection strategy).
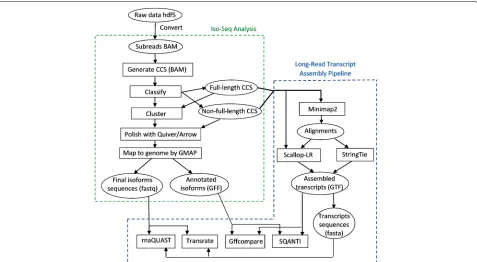
sequencing-Fig. 2Workflow for analyzing the SRA PacBio datasets, combining the long-read transcript assembly pipeline (right) with the Iso-Seq Analysis pipeline (left)
chemistry combinations. (e) For a BioSample, the number of SRA Runs should be ≤ 50. This is because a huge dataset is very computationally expensive for Iso-Seq Analysis. With the above conditions, we identified and extracted 18 human datasets and eight mouse datasets—a total of 26 PacBio datasets from SRA. These 26 datasets are sequenced using RS II or RS platform, and their SRA information is in Additional file1: Table S9.
We convert the PacBio raw data to subreads and merge the subreads from multiple movies belonging to the same BioSample into a large dataset for analysis.
Analysis workflow for analyzing the SRA PacBio datasets Combining our long-read transcript assembly pipeline with the Iso-Seq Analysis pipeline (Iso-Seq2), we build an analysis workflow to analyze the SRA datasets, as shown in Fig.2.
After obtaining subreads and creating the merged dataset, we generate CCS reads from subreads. After classifying the CCS reads into full-length and non-full-length reads, the non-full-length CCS reads are clus-tered—they are run through the ICE (Iterative Clustering and Error correction) algorithm to generate clusters of isoforms. Afterwards, the non-full-length CCS reads are attributed to the clusters, and the clusters are polished using Quiver or Arrow. Quiver is an algorithm for calling accurate consensus from multiple reads, using a
pair-HMM exploiting the basecalls and QV (quality values) metrics to infer the true underlying sequence.4 Quiver is used for RS and RS II data (for data from the Sequel platform, an improved consensus model Arrow is used). Finally, the polished consensus isoforms are mapped to the genome using GMAP to remove the redundancy, and the final polished isoform sequences and annotated isoforms are generated.
The right side of the analysis workflow in Fig.2is our long-read transcript assembly pipeline. We chose Min-imap2 [33] and GMAP as the long-read aligners. GMAP has been shown to outperform RNA-seq aligners STAR [34], TopHat2 [35], HISAT2 [36], and BBMap [37] in aligning long reads [15]. The recently published RNA-seq aligner Minimap2 is specifically designed for long reads. Minimap2 outperforms GMAP, STAR, and SpAln in junction accuracy, and is 40×faster than GMAP [33]. We did a pre-assessment on the accuracy of Minimap2 vs. GMAP on a set of datasets which are either error-corrected or not error-error-corrected (results are not shown). Comparing the assembly results, we found that Min-imap2 is more accurate than GMAP for long reads with-out error corrections, and Minimap2 and GMAP have
4Pacific Biosciences. Understanding accuracy in SMRT sequencing.https://
[image:6.595.61.538.86.348.2]nearly the same accuracy for long reads with error cor-rections. Thus, we use Minimap2 to align CCS reads (which are not error-corrected), while in the Iso-Seq Analysis pipeline, GMAP is used to align polished iso-forms (which are error-corrected). For assembly perfor-mance comparison, we choose StringTie as a counterpart, as StringTie outperforms leading transcript assemblers Cufflinks, IsoLasso, Scripture, and Traph in short-read assembly [22,23].
We use the full-length CCS and non-full-length CCS reads as the input of our long-read transcript assembly pipeline for Scallop-LR (v0.9.1) and StringTie (v1.3.2d) to assemble those CCS reads. We first align those CCS reads to the reference genome using Minimap2, and then the alignments are assembled by the transcript assem-blers. In addition to taking the alignments as input, Scallop-LR also extracts the boundary information (see the “Additional Scallop-LR algorithms” section) from CCS reads.
The software versions and options used in this analysis workflow are summarized in Additional file1: Section 2. The code to reproduce the analysis is available at Scallop-LR: https://github.com/Kingsford-Group/scallop/tree/ isoseq; long-read transcript assembly analysis: https:// github.com/Kingsford-Group/lrassemblyanalysis.
Results
Scallop-LR and StringTie predict more known transcripts than Iso-Seq Analysis
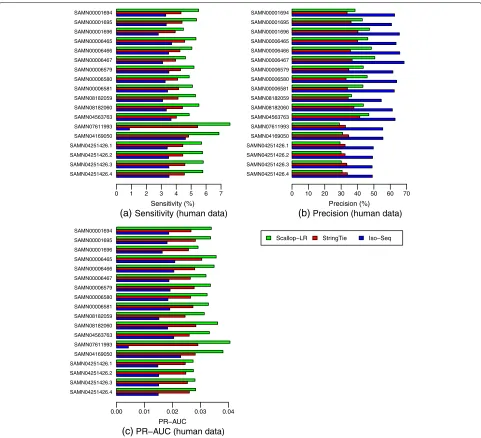
From the Gffcompare results for the human data, Scallop-LR and StringTie consistently predict more known tran-scripts than Iso-Seq Analysis and thus consistently have higher sensitivity than Iso-Seq Analysis. Scallop-LR finds 2100–4000 more known transcripts than Iso-Seq Analy-sis, and the sensitivity of Scallop-LR is 1.33–1.71 times higher than that of Iso-Seq Analysis (Figs.3and4, Addi-tional file1: Tables S1 and S2). StringTie finds 350–1960 more known transcripts than Iso-Seq Analysis, and the sensitivity of StringTie is 1.05–1.4 times higher than that of Iso-Seq Analysis. Scallop-LR and StringTie have higher sensitivity than Iso-Seq Analysis because Scallop-LR and StringTie do assembly but Iso-Seq Analysis does not. This supports the idea that the transcript assembly of long reads is needed. Assembly is likely useful because the suc-cess level of transcriptomic long-read sequencing depends on the completeness of cDNA synthesis, and also long reads may not cover those transcripts longer than a certain length limit [19].
In the human data, Scallop-LR also consistently assem-bles more known transcripts correctly than StringTie and thus consistently has higher sensitivity than StringTie. Scallop-LR finds 950–3770 more known transcripts than StringTie, and the sensitivity of Scallop-LR is 1.14– 1.42 times higher than that of StringTie (Figs. 3 and 4,
Additional file 1: Tables S1 and S2). Scallop-LR’s higher sensitivity is likely due to its phasing path preservation and its transcript boundary identification in the splice graph based on the boundary information extracted from long reads.
Scallop-LR has higher precision than StringTie for the majority of the datasets. For the first 12 datasets in Fig.3 and Additional file1: Table S1, Scallop-LR has both higher sensitivity and higher precision than StringTie. Scallop-LR’s higher precision is partially contributed by its post-assembly clustering. However, for the last six datasets in Fig.3and Additional file 1: Table S1, Scallop-LR has lower precision than StringTie. The last six datasets in Fig. 3 (each has 11, 12, 24, or 27 movies) are signifi-cantly larger than the first 12 datasets (each has 7 or 8 movies). Scallop-LR’s precision decreases in the six larger datasets as it assembles significantly more transcripts in total in these larger datasets (Additional file1: Table S2), while StringTie’s precision does not seem to change much with the size of the sample. As the sequencing depth goes up in larger datasets, more lowly expressed transcripts can be captured by RNA-seq reads. Thus, Scallop-LR is able to identify more lowly expressed transcripts (Addi-tional file 1: Tables S2 and S5 show that Scallop-LR finds many more potential novel isoforms in these six much larger datasets), as its core algorithm can preserve all phasing paths (the Scallop paper illustrated the sig-nificant improvement of Scallop over other methods in assembling lowly expressed transcripts). However, over-all lowly expressed transcripts are harder to assemble (as transcripts may not be fully covered by reads), which may lead to the relatively lower precision on these six larger datasets. Assembling more potential novel isoforms would also lower the precision on these larger datasets as the precision is computed based on the predicted known transcripts.
SAMN04251426.4 SAMN04251426.3 SAMN04251426.2 SAMN04251426.1 SAMN04169050 SAMN07611993 SAMN04563763 SAMN08182060 SAMN08182059 SAMN00006581 SAMN00006580 SAMN00006579 SAMN00006467 SAMN00006466 SAMN00006465 SAMN00001696 SAMN00001695 SAMN00001694
0 1 2 3 4 5 6 7
(a) Sensitivity (human data)
Sensitivity (%)
SAMN04251426.4 SAMN04251426.3 SAMN04251426.2 SAMN04251426.1 SAMN04169050 SAMN07611993 SAMN04563763 SAMN08182060 SAMN08182059 SAMN00006581 SAMN00006580 SAMN00006579 SAMN00006467 SAMN00006466 SAMN00006465 SAMN00001696 SAMN00001695 SAMN00001694
0 10 20 30 40 50 60 70
(b) Precision (human data)
Precision (%)
SAMN04251426.4 SAMN04251426.3 SAMN04251426.2 SAMN04251426.1 SAMN04169050 SAMN07611993 SAMN04563763 SAMN08182060 SAMN08182059 SAMN00006581 SAMN00006580 SAMN00006579 SAMN00006467 SAMN00006466 SAMN00006465 SAMN00001696 SAMN00001695 SAMN00001694
0.00 0.01 0.02 0.03 0.04
(c) PR−AUC (human data)
PR−AUC
Scallop−LR StringTie Iso−Seq
Fig. 3Human data:asensitivity,bprecision, andcPR-AUC of Scallop-LR, StringTie, and Iso-Seq Analysis. Evaluations were on 18 human PacBio datasets from SRA, each corresponding to one BioSample and named by the BioSample ID (except that the last four datasets are four replicates for one BioSample). The first nine datasets were sequenced using the RS, and the last nine datasets were sequenced using the RS II. Sensitivity, precision, and PR-AUC are as described in the “Combined evaluation methods” section
On the other hand, Iso-Seq Analysis consistently has higher precision than Scallop-LR and StringTie (Fig. 3, Additional file 1: Table S1). Iso-Seq Analysis has higher precision partially because the full-length CCS reads are run through the ICE (Iterative Clustering and Error cor-rection) algorithm and the isoforms are also polished with Quiver to achieve higher accuracy.
Scallop-LR consistently has higher PR-AUC than Iso-Seq Analysis and StringTie, indicating better overall per-formance of Scallop-LR. The PR-AUC of Scallop-LR is 1.62–2.07 times higher than that of Iso-Seq Analysis,
and 1.1–1.4 times higher than that of StringTie (Fig. 3, Additional file1: Table S1).
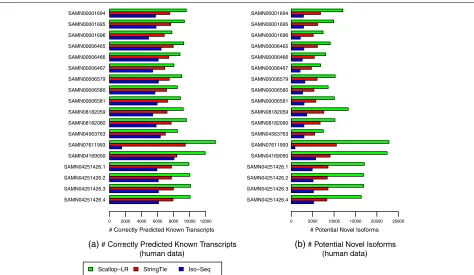
Scallop-LR and StringTie find more potential novel isoforms than Iso-Seq Analysis
[image:8.595.57.538.85.523.2]SAMN04251426.4 SAMN04251426.3 SAMN04251426.2 SAMN04251426.1 SAMN04169050 SAMN07611993 SAMN04563763 SAMN08182060 SAMN08182059 SAMN00006581 SAMN00006580 SAMN00006579 SAMN00006467 SAMN00006466 SAMN00006465 SAMN00001696 SAMN00001695 SAMN00001694
0 2000 4000 6000 8000 10000 12000
(a) # Correctly Predicted Known Transcripts (human data)
# Correctly Predicted Known Transcripts
SAMN04251426.4 SAMN04251426.3 SAMN04251426.2 SAMN04251426.1 SAMN04169050 SAMN07611993 SAMN04563763 SAMN08182060 SAMN08182059 SAMN00006581 SAMN00006580 SAMN00006579 SAMN00006467 SAMN00006466 SAMN00006465 SAMN00001696 SAMN00001695 SAMN00001694
0 5000 10000 15000 20000 25000
(b) # Potential Novel Isoforms (human data) # Potential Novel Isoforms
Scallop−LR StringTie Iso−Seq
Fig. 4Human data:acorrectly predicted known transcripts andbpotential novel isoforms of Scallop-LR, StringTie, and Iso-Seq Analysis. The same 18 human PacBio datasets as described in Fig.3are evaluated. A correctly predicted known transcript has the exact intron-chain matching with a transcript in the reference annotation. A potential novel isoform is a predicted transcript that shares at least one splice junction with a reference transcript
than Iso-Seq Analysis, and 1.37–2.47 times more poten-tial novel isoforms than StringTie (Fig.4, Additional file1: Table S2). This is likely due to the same reasons that led to the higher sensitivity of Scallop-LR. This shows the poten-tial benefit that long-read transcript assembly could offer in discovering novel isoforms.
Scallop-LR finds more novel isoforms in catalog than Iso-Seq Analysis
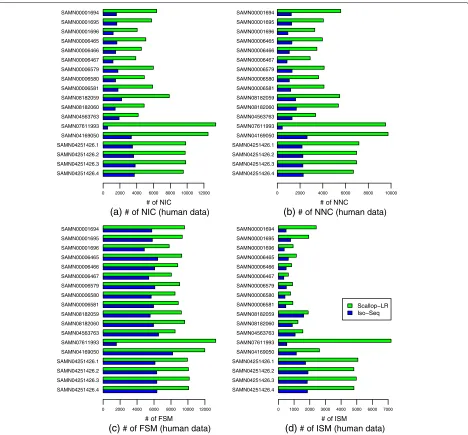
We use SQANTI to evaluate Scallop-LR and Iso-Seq Anal-ysis (SQANTI does not work for the transcripts assembled by StringTie). Figure5and Additional file1: Table S5 show the SQANTI evaluation results for Scallop-LR and Iso-Seq Analysis on the 18 human datasets.
The NIC (transcripts containing either new combina-tions of known splice junccombina-tions or novel splice junccombina-tions with annotated donors and acceptors) results show that Scallop-LR finds more novel isoforms in catalog than Iso-Seq Analysis consistently. Scallop-LR finds 2.2–4.02 times more NIC than Iso-Seq Analysis (Fig.5, Additional file1: Table S5). This is an important indication of Scallop-LR’s ability to find more new transcripts that are not yet anno-tated, as we conjecture that the novel isoforms in catalog may be more likely to be new transcripts than wrongly assembled transcripts since the novel splice junctions are
formed from annotated donors and acceptors. This find-ing further supports the advantage of assembly of long reads.
The NNC (transcripts containing novel splice junctions with novel donors and/or acceptors) results indicate that Scallop-LR also finds more novel isoforms not in catalog than Iso-Seq Analysis consistently (Fig.5, Additional file1: Table S5). The novel isoforms not in catalog could be either new transcripts or wrongly assembled transcripts.
SQANTI’s results on novel isoforms are roughly consis-tent with Gffcompare’s results on novel isoforms. Com-paring Additional file1: Table S5 with Additional file1: Table S2, we can see that the sums of NIC and NNC from SQANTI are similar to the numbers of potential novel isoforms reported by Gffcompare, except that for the last four datasets in Additional file 1: Table S5, for Iso-Seq Analysis, the sums of NIC and NNC are notably larger than the corresponding numbers of potential novel isoforms in Additional file 1: Table S2 (this may be because some NIC or NNC may not contain an annotated splice junction although they contain an annotated donor and/or acceptor).
[image:9.595.64.538.85.360.2]SAMN04251426.4 SAMN04251426.3 SAMN04251426.2 SAMN04251426.1 SAMN04169050 SAMN07611993 SAMN04563763 SAMN08182060 SAMN08182059 SAMN00006581 SAMN00006580 SAMN00006579 SAMN00006467 SAMN00006466 SAMN00006465 SAMN00001696 SAMN00001695 SAMN00001694
0 2000 4000 6000 8000 10000 12000
(a) # of NIC (human data)
# of NIC
SAMN04251426.4 SAMN04251426.3 SAMN04251426.2 SAMN04251426.1 SAMN04169050 SAMN07611993 SAMN04563763 SAMN08182060 SAMN08182059 SAMN00006581 SAMN00006580 SAMN00006579 SAMN00006467 SAMN00006466 SAMN00006465 SAMN00001696 SAMN00001695 SAMN00001694
0 2000 4000 6000 8000 10000
(b) # of NNC (human data)
# of NNC
SAMN04251426.4 SAMN04251426.3 SAMN04251426.2 SAMN04251426.1 SAMN04169050 SAMN07611993 SAMN04563763 SAMN08182060 SAMN08182059 SAMN00006581 SAMN00006580 SAMN00006579 SAMN00006467 SAMN00006466 SAMN00006465 SAMN00001696 SAMN00001695 SAMN00001694
0 2000 4000 6000 8000 10000 12000
(c) # of FSM (human data)
# of FSM
SAMN04251426.4 SAMN04251426.3 SAMN04251426.2 SAMN04251426.1 SAMN04169050 SAMN07611993 SAMN04563763 SAMN08182060 SAMN08182059 SAMN00006581 SAMN00006580 SAMN00006579 SAMN00006467 SAMN00006466 SAMN00006465 SAMN00001696 SAMN00001695 SAMN00001694
0 1000 2000 3000 4000 5000 6000 7000
(d) # of ISM (human data)
# of ISM
Scallop−LR Iso−Seq
Fig. 5Human data: numbers ofaNIC,bNNC,cFSM, anddISM transcripts of Scallop-LR and Iso-Seq Analysis based on SQANTI evaluations. The same 18 human PacBio datasets as described in Fig.3are evaluated. NIC, NNC, FSM, and ISM are as described in the “Combined evaluation methods” section
correctly than Iso-Seq Analysis. Comparing Addi-tional file 1: Table S5 with Additional file 1: Table S2, we can see that the numbers of FSM from SQANTI are very close to the numbers of correctly predicted known transcripts from Gffcompare for these datasets.
The ISM (Incomplete Splice Match) results show that Scallop-LR also yields more partially matched transcripts than Iso-Seq Analysis (Fig.5, Additional file1: Table S5). The NNC and ISM results support the trend we found from Gffcompare that Iso-Seq Analysis has higher preci-sion than Scallop-LR.
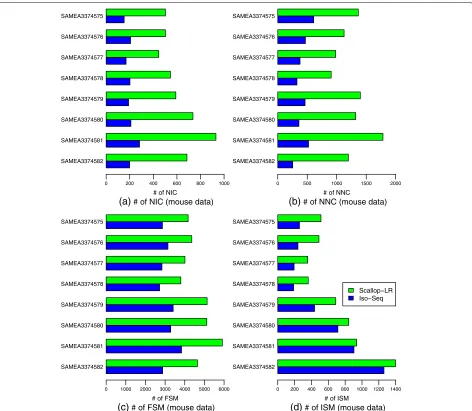
The mouse data exhibit the same trends as the human data as summarized above, which can be seen from Fig.6
and Additional file 1: Table S6 and by comparing Addi-tional file1: Table S6 with Additional file1: Table S4. In the mouse data, Scallop-LR finds significantly more novel isoforms in catalog (2.43–3.5 times more) than Iso-Seq Analysis consistently (Fig.6, Additional file1: Table S6). This further supports our finding on Scallop-LR’s abil-ity to discover more new transcripts that are not yet annotated.
Assessment of predicted transcripts that partially match known transcripts
[image:10.595.70.538.85.520.2]SAMEA3374582 SAMEA3374581 SAMEA3374580 SAMEA3374579 SAMEA3374578 SAMEA3374577 SAMEA3374576 SAMEA3374575
0 200 400 600 800 1000
(a) # of NIC (mouse data) # of NIC
SAMEA3374582 SAMEA3374581 SAMEA3374580 SAMEA3374579 SAMEA3374578 SAMEA3374577 SAMEA3374576 SAMEA3374575
0 500 1000 1500 2000
(b) # of NNC (mouse data) # of NNC
SAMEA3374582 SAMEA3374581 SAMEA3374580 SAMEA3374579 SAMEA3374578 SAMEA3374577 SAMEA3374576 SAMEA3374575
0 1000 2000 3000 4000 5000 6000
(c) # of FSM (mouse data) # of FSM
SAMEA3374582 SAMEA3374581 SAMEA3374580 SAMEA3374579 SAMEA3374578 SAMEA3374577 SAMEA3374576 SAMEA3374575
0 200 400 600 800 1000 1200 1400
(d) # of ISM (mouse data) # of ISM
Scallop−LR Iso−Seq
Fig. 6Mouse data: numbers ofaNIC,bNNC,cFSM, anddISM transcripts of Scallop-LR and Iso-Seq Analysis based on SQANTI evaluations. Evaluations were on eight mouse PacBio datasets from SRA, each corresponding to one BioSample and named by the BioSample ID. All eight datasets were sequenced using the RS. Metrics descriptions are the same as in Fig.5
to predicted transcripts by the tools being evaluated. Here, we inherit these terminologies. Figures7,8, and9show box-whisker plots of matched transcripts in matched fraction bins, assembled isoforms in assembled fraction bins, “mean isoform assembly,” and “mean fraction of transcript matched” for Scallop-LR, StringTie, and Iso-Seq Analysis on the 18 human datasets based on rnaQUAST evaluations. Full results are shown in Additional file 1: Tables S7.1–S7.18.
Scallop-LR predicts more transcripts that have a high fraction of their bases matching reference transcripts than both Iso-Seq Analysis and StringTie. The metric “x–y% matched transcripts” is the number of transcripts that have at leastx% and at mosty% of their bases matching an isoform from the annotation database. We report
this measure in four different bins to examine how well predicted transcripts match reference transcripts. From Additional file 1: Tables S7.1–S7.18, in the high % bins of the “x–y% matched transcripts” (75–95% and 95–100% matched), Scallop-LR predicts morex–y% matched tran-scripts than both Iso-Seq Analysis and StringTie (with one exception compared with StringTie). This trend is visu-alized in Fig.7(75–95% and 95–100% matched bins). In the high % bins, StringTie mostly has morex–y% matched transcripts than Iso-Seq Analysis. These further support the advantage of transcript assembly on long reads.
[image:11.595.67.539.85.496.2]% 0 0 1 − 5 9 %
5 9 − 5 7 %
5 7 − 0 5 %
0 5 − 0
0
5000
10000
15000
20000
25000
Range of matched fraction (x−y%) of transcript
Number of x−y% matched tr
anscr
ipts
Scallop−LR StringTie Iso−Seq
Fig. 7Human data: box-whisker plots of matched transcripts in four matched fraction bins for Scallop-LR, StringTie, and Iso-Seq Analysis, based on rnaQUAST evaluations. This is to compare numbers ofx–y% matched transcripts. The same 18 human PacBio datasets as described in Fig.3are evaluated. “Number ofx–y% matched transcripts” is as described in the “Assessment of predicted transcripts that partially match known transcripts” section. The four bins of matched fraction (x–y%) of transcript are 0–50%, 50–75%, 75–95%, and 95–100%
% 0 0 1 − 5 9 %
5 9 − 5 7 %
5 7 − 0 5 %
0 5 − 0
0
2000
4000
6000
8000
1
0000
12000
14000
Range of assembled fraction (x−y%) of isoform
Number of x−y% assemb
led isof
or
ms
Scallop−LR StringTie Iso−Seq
[image:12.595.57.540.88.353.2] [image:12.595.58.539.403.681.2]0.2
0.4
0.6
0.8
Mean isoform assembly Mean fraction of transcript matched
Mean fr
actions
Scallop−LR StringTie Iso−Seq
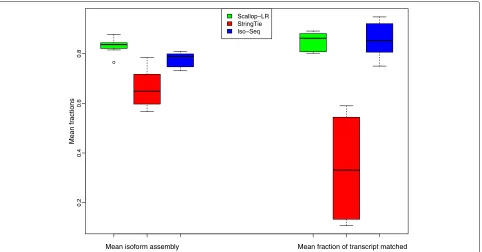
Fig. 9Human data: box-whisker plots of mean isoform assembly and mean fraction of transcript matched for Scallop-LR, StringTie, and Iso-Seq Analysis, based on rnaQUAST evaluations. The same 18 human PacBio datasets as described in Fig.3are evaluated. “Mean isoform assembly” and “mean fraction of transcript matched” are as described in the “Assessment of predicted transcripts that partially match known transcripts” section
fraction of a transcript is computed as the number of its bases covering an isoform divided by the transcript length. This measure indicates on average how well pre-dicted transcripts match reference transcripts. In Addi-tional file 1: Tables S7.1–S7.18, Scallop-LR consistently has much higher values of “Mean fraction of transcript matched” than StringTie, indicating its better assembly quality than StringTie. Scallop-LR performs slightly bet-ter than Iso-Seq Analysis on this measure. These trends are visualized in Fig.9(right: “Mean fraction of transcript matched”).
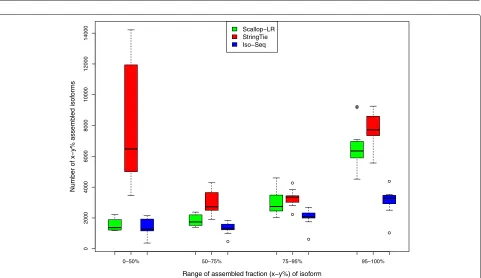
There are more reference transcripts that have a high fraction of their bases being captured/covered by Scallop-LR transcripts than by Iso-Seq Analysis predicted tran-scripts. The metric “x–y% assembled isoforms” is the number of isoforms from the annotation database that have at leastx% and at mosty% of their bases captured by a single predicted transcript. We report this mea-sure in four different bins to examine how well reference transcripts are captured/covered by predicted transcripts. From Additional file 1: Tables S7.1–S7.18, in the high % bins of the “x–y% assembled isoforms” (75–95% and 95–100% assembled), Scallop-LR consistently has more x–y% assembled isoforms than Iso-Seq Analysis. However, Scallop-LR mostly (with six exceptions in the 75–95% bin and two exceptions in the 95–100% bin) has fewer x–y% assembled isoforms than StringTie in the high %
bins. These trends are visualized in Fig. 8(75–95% and 95–100% assembled bins).
However, on average, reference transcripts are bet-ter captured/covered by Scallop-LR transcripts than by StringTie transcripts and Iso-Seq Analysis transcripts. The metric “Mean isoform assembly” is the average value of assembled fractions, where the assembled fraction of an isoform is computed as the largest number of its bases captured by a single predicted transcript divided by its length. This measure shows on average how well refer-ence transcripts are captured by predicted transcripts. In Additional file 1: Tables S7.1–S7.18, Scallop-LR consis-tently has higher values of “Mean isoform assembly” than both StringTie and Iso-Seq Analysis. This trend is visual-ized in Fig.9(left: “Mean isoform assembly”). This trend is consistent with the higher sensitivity of Scallop-LR in the Gffcompare results.
[image:13.595.60.542.86.338.2]There are a few notable findings regarding StringTie transcripts. First, StringTie consistently has significantly more unannotated transcripts than both Scallop-LR and Iso-Seq Analysis (Additional file 1: Tables S7.1–S7.18). Second, in Fig. 7, in the 0–50% matched bin, StringTie has significantly higher numbers of transcripts than Scallop-LR and Iso-Seq Analysis. This indicates that StringTie assembled many more lower quality transcripts than Scallop-LR and Iso-Seq Analysis, consistent with StringTie predicting many more unannotated transcripts. Lastly, in Fig.8, in the 0–50% assembled bin, StringTie has significantly higher numbers of isoforms than Scallop-LR and Iso-Seq Analysis. This indicates that, compared with Scallop-LR and Iso-Seq Analysis, there are many more isoforms from the annotation which are just marginally covered by StringTie transcripts.
The mouse data exhibit trends partially similar to those of the human data for the rnaQUAST results, and the quality of StringTie transcripts in the mouse data is somewhat improved compared to that in the human data. The detailed discussions on the rnaQUAST results for the mouse data are in Additional file1: Section 3.
We also evaluated Scallop-LR and StringTie on a sim-ulated human dataset from Liu et al. [38]. The results and discussions for the simulated dataset are in Addi-tional file1: Section 4.
Scallop-LR and StringTie predict more known transcripts and potential novel isoforms than Iso-Seq Analysis in mouse data
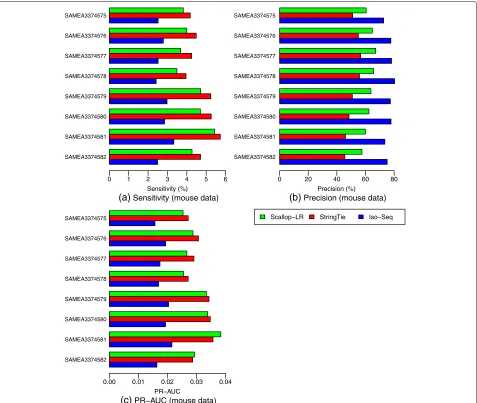
From the Gffcompare evaluation for the mouse data (Fig.10, Additional file 1: Tables S3 and S4),
Scallop-SAMEA3374582 SAMEA3374581 SAMEA3374580 SAMEA3374579 SAMEA3374578 SAMEA3374577 SAMEA3374576 SAMEA3374575
0 1 2 3 4 5 6
(a) Sensitivity (mouse data) Sensitivity (%)
SAMEA3374582 SAMEA3374581 SAMEA3374580 SAMEA3374579 SAMEA3374578 SAMEA3374577 SAMEA3374576 SAMEA3374575
0 20 40 60 80
(b) Precision (mouse data) Precision (%)
SAMEA3374582 SAMEA3374581 SAMEA3374580 SAMEA3374579 SAMEA3374578 SAMEA3374577 SAMEA3374576 SAMEA3374575
0.00 0.01 0.02 0.03 0.04
(c) PR−AUC (mouse data) PR−AUC
[image:14.595.62.539.298.701.2]Scallop−LR StringTie Iso−Seq
LR and StringTie consistently predict more known tran-scripts (Scallop-LR predicts 1100–2200 more) correctly than Iso-Seq Analysis and thus consistently have higher sensitivity (Scallop-LR’s is 1.43–1.72 times higher) than Iso-Seq Analysis. Scallop-LR and StringTie also find more potential novel isoforms (Scallop-LR finds 2.38– 4.36 times more) than Iso-Seq Analysis (Additional file1: Table S4). Scallop-LR and StringTie consistently have higher PR-AUC than Iso-Seq Analysis (Fig. 10, Addi-tional file1: Table S3).
We also found some trends different from those in the human data. In the mouse data, Scallop-LR consistently has higher precision than StringTie, but consistently has lower sensitivity than StringTie (Fig.10, Additional file1: Table S3). Thus, for StringTie, we computed the adjusted sensitivity by matching Scallop-LR’s precision and the adjusted precision by matching Scallop-LR’s sensitivity. These adjusted values are shown inside the parentheses on Additional file1: Table S3. Scallop-LR’s sensitivity and precision are consistently higher than StringTie’s adjusted sensitivity and adjusted precision, indicating that when comparing on the same footing, Scallop-LR does better on these measures than StringTie.
In the mouse data, the trend of PR-AUC between Scallop-LR and StringTie is mixed (Fig. 10, Addi-tional file1: Table S3). Scallop-LR also finds fewer poten-tial novel isoforms than StringTie (Additional file 1: Table S4).
Before this work, Scallop was never systematically eval-uated on organisms besides human, for either short reads or long reads. In fact, Scallop’s parameters were opti-mized by targeting the human transcriptome. The current annotated mouse transcriptome is relatively less com-plex than the annotated human transcriptome although they share many similarities. It may be possible that some of Scallop-LR’s advantages (such as preserving phasing paths) become less significant in a relatively less complex transcriptome.
Discussion
The combined evaluations using Gffcompare, SQANTI, and rnaQUAST yield consistent observations that Scallop-LR not only correctly assembles more known transcripts but also finds more possible novel isoforms than Iso-Seq Analysis, which does not do assembly. Scallop-LR finding more NIC especially shows its ability to discover new transcripts. These observations further support the idea that transcript assembly of long reads is needed, and demonstrate that long-read assembly by Scallop-LR can help reveal a more complete human transcriptome using long reads.
Two factors may limit the CCS read length: the read length of the platform and the cDNA template sizes. In many cases, the primary limiting factor for CCS read
lengths is the cDNA template sizes [17]. When a cDNA is very long so that the continuous polymerase read is unable to get through at least two full passes of the template, the CCS read is not generated for that cDNA. Thus, the maximum possible CCS read length is limited by the read length of the platform. The read lengths of sequenc-ing platforms have been increassequenc-ing; however, there are limitations imposed by the cDNA synthesis methods.
cDNA synthesis can be incomplete with respect to the original mRNAs [17]. A CCS read represents the entire cDNA molecule; however, the CCS read could correspond to a partial transcript as a result of incomplete cDNAs [17]. The longer the transcripts are, the lower the fraction of CCS reads that can represent the entire splice struc-tures of mRNAs is [17]. This is likely a reason that Scallop-LR is able to find more true transcripts through assembly: a fraction of CCS reads can be partial sequences of those long transcripts, and Scallop-LR is able to assemble them together to reconstruct the original transcripts.
Iso-Seq Analysis may also sacrifice some true transcripts in order to achieve a higher quality (i.e., less affected by the sequencing errors) in final isoforms. The “polish” step in Iso-Seq Analysis keeps only the isoforms with at least two full-length reads to support them. This increases the isoform quality and gives Iso-Seq Analysis a higher preci-sion than Scallop-LR, but may cause Iso-Seq Analysis to miss those low-abundance, long transcripts with only one full-length read.
by StringTie, the single-exon alignments that overlap those spliced alignments turn into single-exon tran-scripts by themselves, although they could have been represented by the spliced multi-exon transcripts dur-ing the assembly if those spliced alignments they overlap were not ignored. Unlike StringTie, Scallop-LR attempts both strands if a read alignment has no transcript strand information.
Scallop-LR eliminates nearly redundant transcripts through post-assembly clustering. For reference-based assembly, clustering the transcripts with very similar splice positions into a single transcript could have a side effect that some true transcripts may also be eliminated by the clustering since some real transcripts may have very similar splice positions. Therefore, we investigated this effect by comparing the results of Scallop-LR without post-assembly clustering with the results of Scallop-LR with post-assembly clustering and computing the per-centages of correctly assembled known transcripts that are missing because of the clustering and the percent-ages of nearly redundant transcripts that are removed by the clustering (Additional file 1: Table S11). For the 18 human datasets, we found that the percentages of cor-rectly assembled known transcripts missing due to clus-tering are between 1.43% and 2.38% (this percentage < 2% for all datasets except for two) and the percentages of nearly redundant transcripts removed by clustering are between 9.22% and 15.52% (this percentage > 10% for all datasets except for four). These results indicate that the effect of missing correctly assembled known transcripts by the post-assembly clustering is relatively minor, while the post-assembly clustering substantially removes nearly redundant transcripts and significantly improves the pre-cision. Decreasing the allowance for splice positions’ dif-ferences (the parameter “--max_cluster_intron_distance”; the default is 10 bp) could further reduce the side effect of missing correctly assembled known transcripts due to the clustering.
We also compared the performance of Scallop-LR (v0.9.1) with the performance of the short-read assem-bler Scallop (v0.10.3) for the 18 human datasets using the Gffcompare evaluation (Additional file1: Table S10). We adjusted the parameters of Scallop so that it can also assemble long reads (by setting “--max_num_cigar 1000” and “--min_num_hits_in_bundle 1”). The precision of Scallop-LR increases compared with that of Scal-lop: on all 18 datasets, Scallop-LR gives higher preci-sion, and the average precision are 39.63% and 34.18% respectively for Scallop-LR and Scallop. The sensitivity of Scallop-LR also increases compared with that of Scal-lop (except for two datasets, ScalScal-lop has slightly higher sensitivity than Scallop-LR, and for another two datasets, there is a tie): the average numbers of correctly pre-dicted known transcripts are 9543 and 9421 respectively
for Scallop-LR and Scallop. These results show the ben-efits of the long-read-specific optimizations added in Scallop-LR.
A direction for future work is developing a hybrid tran-script assembler that combines short and long reads. Recently, two de novo transcript assembly methods using hybrid sequencing were developed: IDP-denovo [39] and a new version of Trinity [40]. However, both Trin-ity and IDP-denovo do not assemble long reads; they assemble short reads and use long reads to extend, supplement, or improve the assembly of short reads. A reference-based hybrid transcript assembler that can assemble both short reads and long reads simultane-ously, thus combining the advantages of short reads (low error rates, high throughput) and long reads (long read lengths), is an interesting direction for future work.
Conclusion
The sensitivity of the Iso-Seq method is limited by the factor that not all CCS reads represent full transcripts [19]. We demonstrate that our developed long-read tran-script assembler Scallop-LR can improve this situation by identifying more true transcripts and potential novel iso-forms through transcript assembly. Analyzing 26 PacBio datasets and using multiple evaluation methods, we quan-tified the amount by which transcript assembly improved the Iso-Seq results, demonstrating the advantage of long-read transcript assembly. Adding long-long-read-specific opti-mizations in Scallop-LR increases the advantage of assem-bling long reads, thus providing benefit to transcriptome studies.
Supplementary information
Supplementary informationaccompanies this paper at https://doi.org/10.1186/s13059-019-1883-0.
Additional file 1: Supplementary materials, Tables S1-S13, Figures S1-S3 Additional file 2: Review history
Peer review information
Andrew Cosgrove was the primary editor of this article and managed its editorial process and peer review in collaboration with the rest of the editorial team.
Review history
The review history is available as Additional file2.
Authors’ contributions
All authors designed the analysis experiments and the long-readspecific optimizations together. L.T. collected, processed, and analyzed all the data and quantified the benefit of transcript assembly on long reads. M.S. implemented the long-read-specific optimizations in Scallop-LR. C.K. directed the project. L.T., M.S., and C.K. wrote the manuscript. All authors read and approved the final manuscript.
Funding
Interfaces Initiative; the National Science Foundation Graduate Research Fellowship Program [DGE1745016 to L.H.T.] (any opinions, findings, and conclusions or recommendations expressed in this material are those of the authors and do not necessarily reflect the views of the National Science Foundation); the Gordon and Betty Moore Foundation’s Data-Driven Discovery Initiative [GBMF4554 to C.K.]; the US National Institutes of Health [R01GM122935, P41GM103712]; and The Shurl and Kay Curci Foundation.
Availability of data and materials
All data analyzed in this study are publicly available at the NCBI Sequence Read Archive and their SRA accessions are listed below:
Dataset BioSample SRA Study
1 SAMN00001694 ERP015321 [41]
2 SAMN00001695 ERP015321 [41]
3 SAMN00001696 ERP015321 [41]
4 SAMN00006465 ERP015321 [41]
5 SAMN00006466 ERP015321 [41]
6 SAMN00006467 ERP015321 [41]
7 SAMN00006579 ERP015321 [41]
8 SAMN00006580 ERP015321 [41]
9 SAMN00006581 ERP015321 [41]
10 SAMN08182059 SRP126849 [42]
11 SAMN08182060 SRP126849 [42]
12 SAMN04563763 SRP071928 [43]
13 SAMN07611993 SRP098984 [44]
14 SAMN04169050 SRP068953 [45]
15 SAMN04251426.1 SRP065930 [46]
16 SAMN04251426.2 SRP065930 [46]
17 SAMN04251426.3 SRP065930 [46]
18 SAMN04251426.4 SRP065930 [46]
19 SAMEA3374575 ERP010189 [47]
20 SAMEA3374576 ERP010189 [47]
21 SAMEA3374577 ERP010189 [47]
22 SAMEA3374578 ERP010189 [47]
23 SAMEA3374579 ERP010189 [47]
24 SAMEA3374580 ERP010189 [47]
25 SAMEA3374581 ERP010189 [47]
26 SAMEA3374582 ERP010189 [47]
The code to reproduce the analysis of long-read transcript assembly is available at GitHub [48]:https://github.com/Kingsford-Group/
lrassemblyanalysisunder the BSD 3-Clause “New” or “Revised” license, and Scallop-LR is available at GitHub [49]:https://github.com/Kingsford-Group/ scallop/tree/isosequnder the BSD 3-Clause “New” or “Revised” license and is also available at Zenodo [50]:https://doi.org/10.5281/zenodo.3522181under the Creative Commons Attribution 4.0 International license.
Ethics approval and consent to participate Ethics approval is not applicable for this study.
Competing interests
C.K. is a co-founder of Ocean Genomics, Inc. The other authors declare that they have no competing interests.
Author details
1Computational Biology Department, School of Computer Science, Carnegie
Mellon University, Pittsburgh, PA, 15213 USA.2Joint Carnegie Mellon University-University of Pittsburgh Ph.D. Program in Computational Biology, Pittsburgh, PA 15213 USA.3Department of Computer Science and
Engineering, The Pennsylvania State University, University Park, PA, 16802 USA.
Received: 31 May 2019 Accepted: 6 November 2019
References
1. Pan Q, et al. Deep surveying of alternative splicing complexity in the human transcriptome by high-throughput sequencing. Nat Genet. 2008;40(12):1413–5.
2. Cho H, et al. High-resolution transcriptome analysis with long-read RNA sequencing. PLoS ONE. 2014;9(9):e108095.
3. Tilgner H, et al. Defining a personal, allele-specific, and single-molecule long-read transcriptome. PNAS. 2014;111(27):9869–74.
4. Shi L, et al. Long-read sequencing and de novo assembly of a Chinese genome. Nat Commun. 2016;7:12065.
5. Koren S, et al. Canu: scalable and accurate long-read assembly via adaptive k-mer weighting and repeat separation. Genome Res. 2017;27:722–36. 6. Zimin A, et al. The MaSuRCA genome assembler. Bioinformatics.
2013;29(21):2669–77.
7. Au K, et al. Characterization of the human ESC transcriptome by hybrid sequencing. PNAS. 2013;110(50):E4821–30.
8. Weirather J, et al. Characterization of fusion genes and the significantly expressed fusion isoforms in breast cancer by hybrid sequencing. Nucleic Acids Res. 2015;43(18):e116.
9. Antipov D, et al. hybridSPAdes: an algorithm for hybrid assembly of short and long reads. Bioinformatics. 2016;32(7):1009–15.
10. Zimin AV, et al. Hybrid assembly of the large and highly repetitive genome ofAegilops tauschii, a progenitor of bread wheat, with the MaSuRCA mega-reads algorithm. Genome Res. 2017;27(5):787–92. 11. Wick RR, et al. Unicycler: resolving bacterial genome assemblies from
short and long sequencing reads. PLoS Comput Biol. 2017;13(6):e1005595. 12. Korhonen PK, et al. Common workflow language (CWL)-based software
pipeline for de novo genome assembly from long- and short-read data. GigaScience. 2019;8(4):giz014.
13. Wang B, et al. Unveiling the complexity of the maize transcriptome by single-molecule long-read sequencing. Nat Commun. 2016;7:11708. 14. Tseng E, et al. Altered expression of the FMR1 splicing variants landscape
in premutation carriers. Biochim Biophys Acta. 2017;1860(11):1117–26. 15. Križanovi´c K, et al. Evaluation of tools for long read RNA-seq splice-aware
alignment. Bioinformatics. 2018;34(5):748–54.
16. Au K, et al. Improving PacBio long read accuracy by short read alignment. PLoS ONE. 2012;7(10):e46679.
17. Sharon D, et al. A single-molecule long-read survey of the human transcriptome. Nat Biotechnol. 2013;31(11):1009–14.
18. Kuosmanen A, et al. On using longer RNA-seq reads to improve transcript prediction accuracy. 9th Int Joint Conf Biomed Eng Syst Technol. 2016;3(Bioinformatics):272–7.
19. Rhoads A, Au K. PacBio sequencing and its applications. Genomics Proteomics Bioinform. 2015;13:278–89.
20. Shao M, Kingsford C. Accurate assembly of transcripts through phase-preserving graph decomposition. Nat Biotechnol. 2017;35:1167–9. 21. Leinonen R, et al. The sequence read archive. Nucleic Acids Res.
2011;39(suppL1):D19–21.
22. Pertea M, et al. StringTie enables improved reconstruction of a transcriptome from RNA-seq reads. Nature Biotechnology. 2015;33(3): 290–295.
23. Pertea M, et al. Transcript-level expression analysis of RNA-seq experiments with HISAT, StringTie, and Ballgown. Nat Protocol. 2016;11(9):1650–67.
24. Sahlin K, Medvedev P. De novo clustering of long-read transcriptome data using a greedy, quality-value based algorithm. RECOMB. 2019;2019: 227–42.
25. Tardaguila M, et al. SQANTI: extensive characterization of long-read transcript sequences for quality control in full-length transcriptome identification and quantification. Genome Res. 2018;28:396–411. 26. Bushmanova E, et al. rnaQUAST: a quality assessment tool for de novo
transcriptome assemblies. Bioinformatics. 2016;32(14):2210–2. 27. Wu T, Watanabe C. GMAP: a genomic mapping and alignment program
for mRNA and EST sequences. Bioinformatics. 2005;21(9):1859–75. 28. Smith-Unna R, et al. TransRate: reference-free quality assessment of de
novo transcriptome assemblies. Genome Res. 2016;26(8):1134–44. 29. Komor M, et al. Identification of differentially expressed splice variants by
the proteogenomic pipeline splicify. Mol Cell Proteomics. 2017;16(10): 1850–63.
30. O’Grady T, et al. Global transcript structure resolution of high gene density genomes through multi-platform data integration. Nucleic Acids Res. 2016;44(18):e145.
31. Seo J, et al. De novo assembly and phasing of a Korean human genome. Nature. 2016;538(7624):243–7.
32. Hughes J, et al. Chimpanzee and human Y chromosomes are remarkably divergent in structure and gene content. Nature. 2010;463(7280):536–9. 33. Li H. Minimap2: fast pairwise alignment for long nucleotide sequences.
34. Dobin A, et al. STAR: ultrafast universal RNA-seq aligner. Bioinformatics. 2013;29(1):15–21.
35. Kim D, et al. TopHat2: accurate alignment of transcriptomes in the presence of insertions, deletions and gene fusions. Genome Biol. 2013;14(4):R36.
36. Kim D, et al. HISAT: a fast spliced aligner with low memory requirements. Nat Methods. 2015;12(4):357–60.
37. Bushnell B. BBMap: a fast, accurate, splice-aware aligner. 9th Ann Genomics Energy Environ Meet. 2014;LBNL-7065E.
38. Liu B, et al. deSALT: fast and accurate long transcriptomic read alignment with de Bruijn graph-based index. bioRxiv. 2019;612176.https://doi.org/ 10.1101/612176.
39. Fu S, et al. IDP-denovo: de novo transcriptome assembly and isoform annotation by hybrid sequencing. Bioinformatics. 2018;34(13):2168–76. 40. Grabherr MG, et al. Full-length transcriptome assembly from RNA-Seq
data without a reference genome. Nat Biotechnol. 2011;29(7):644–52. 41. DNALINK, INC. PacBio RNAseq (IsoSeq) for 1000 genome trio samples. Datasets. NCBI Seq Read Arch. 2016.https://trace.ncbi.nlm.nih.gov/ Traces/sra/?study=ERP015321.
42. Komor M, et al. Identification of differentially expressed splice variants by the proteogenomic pipeline splicify. Datasets. NCBI Seq Read Arch. 2017. https://trace.ncbi.nlm.nih.gov/Traces/sra/?study=SRP126849.
43. O’Grady T, et al. Global transcript structure resolution of high gene density genomes through multi-platform data integration: Iso-Seq. Datasets. NCBI Seq Read Arch. 2016.https://trace.ncbi.nlm.nih.gov/ Traces/sra/?study=SRP071928.
44. University of Washington. Sequence and assembly of great-ape genomes including annotation and comparative analyses using long- and short-read sequencing modalities. Datasets. NCBI Seq Read Arch. 2018. https://trace.ncbi.nlm.nih.gov/Traces/sra/?study=SRP098984.
45. Seo J, et al. Homo sapiens isolate:AK1 genome sequencing and assembly. Datasets. NCBI Seq Read Arch. 2016.https://trace.ncbi.nlm.nih.gov/ Traces/sra/?study=SRP068953.
46. Shi L, et al. HX1. Datasets. NCBI Seq Read Arch. 2016.https://trace.ncbi. nlm.nih.gov/Traces/sra/?study=SRP065930.
47. The Wellcome Trust Sanger Institute. Laboratory mouse whole transcript sequencing. Datasets. NCBI Seq Read Arch. 2015.https://trace.ncbi.nlm. nih.gov/Traces/sra/?study=ERP010189.
48. Tung LH, Shao M, Kingsford C. Long-read transcript assembly analysis. GitHub. 2019.https://github.com/Kingsford-Group/lrassemblyanalysis. 49. Shao M, Kingsford C, Tung LH. Scallop-LR. GitHub. 2019.https://github.
com/Kingsford-Group/scallop/tree/isoseq.
50. Shao M, Kingsford C, Tung LH. Scallop-LR. Zenodo. 2019.https://doi.org/ 10.5281/zenodo.3522181.
Publisher’s Note