© 2018, IRJET | Impact Factor value: 6.171 | ISO 9001:2008 Certified Journal | Page 557
Implementation of CAD system for Cancer Detection using SVM based
Classification
Pallavi Jadhav
1, U. A. Nuli
21P.G.Student, Department Of Computer Science And Engg, D.K.T.E. Society’s Textile And Engg Institute, Ichalkaranji
2Professor, Department Of Computer Science And Engg, D.K.T.E. Society’s Textile And Engg Institute, Ichalkaranji
---***---Abstract - Breast cancer is one of the most frequently
occurring diseases which cause death among women. Masses present in mammogram of breast, primarily indicates breast cancer and it is important to classify them as benign or malignant. Benign and malignant masses differ in geometry and texture characteristics. However, not every geometry and texture feature that is extracted contributes to the improvement of classification accuracy; thus, to select the best features from a set is important. Selecting best feature set again depends on the classification algorithm to be used. Different classification algorithm gives different performance on number of selected features. SVM can generally achieve better performance on using all extracted features. Proposed new system will examine the CAD system for mass classification. It will integrate a support vector machine (SVM).
Key Words: Mammogram, ROI extraction,
Segmentation, Features extraction, Feature Selection, Classification
1. INTRODUCTION
Breast cancer is the most common malignancy of women and is the second most common and leading cause of cancer deaths among them. At present, there are no effective ways to prevent breast cancer, because its cause is not yet fully known. Early detection is an effective way to diagnose and manage breast cancer which can give a better chance of full recovery. Therefore, early detection of breast cancer can play an important role in reducing the associated morbidity and mortality rates.
The manual analysis of breast lesions from mammograms presents large interpretation variability amongst radiologists. This variability can be reduced with the aid of Computer Aided Diagnosis (CAD) Systems that can act as a second reader in the analysis of breast lesions. However for a CAD system to be useful in clinical setting, it must effectively classify as benign or malignant.
Detection, segmentation and classification of breast lesions are the main three steps involved in fully automated CAD systems that can work in the analysis of mammograms. Building a CAD system is difficult because mammograms are marred by low signal to noise ratio for the visualization of breast lesions. In addition, breast lesions present a large variation in terms of shape, size and appearance. A large number of methods have been applied for building
automated CAD systems for both types of lesions, namely mass and micro-calcification, but in this work we focus only on the analysis of masses. The major drawback of current approaches is that they generate a large number of false positives and miss a fair amount of true positive regions during the mass detection stage. Furthermore, mass segmentation is generally based on active contour models and graph-based approaches that rarely capture the large shape and appearance variations of breast masses. Finally, mass classification is generally implemented using sub-optimal hand-crafted features and machine learning classifiers such as support vector machines (SVM), linear discriminant analysis (LDA), artificial neural net (ANN), etc. One major limitation of the majority of existing CAD systems is that most of them require manual intervention to obtain mass candidates for segmentation and classification.
This paper presents a new approach based on recently developed machine learning models to develop a fully automated CAD system for automated detection, segmentation and classification of masses from mammograms. Our proposed solution to the mass detection problem consists of four stages: 1) Segmentation of the Region of Interest (ROI) of the original input mammographic image. 2) Texture and Geometric Features Extraction from the segmented image 3) Feature Selection from the total number of extracted image 4) Classification of the mass (tumor) as benign or malignant.
2. LITERATURE SURVEY
Computer-aided diagnosis (CAD) (Nikhil et al 2008; Derya 2009; Leonardo 2009; Lee et al 2000) [1] techniques and systems support radiologists in the role of a second reader and prompting the radiologist to review areas in a mammogram considered. Therefore the development of a successful CAD scheme is necessary to investigate the usefulness for radiologists in their diagnosis to quantify the computer output for radiologists and how to maximize the effect of the computer output on their diagnosis.
© 2018, IRJET | Impact Factor value: 6.171 | ISO 9001:2008 Certified Journal | Page 558 false negative rate is to use double reading, which can
improve the detection rate by 5%–15% [3].
However, double reading is too expensive and time consuming. Thus, computer-aided cancer detection technology attracts researchers’ and radiologists’ attention. The adoption of a computer-aided detection (CAD) system could reduce the experts’ workload and can improve the early cancer detection rate [4], [5]. A recent report [4] demonstrates that the adoption of CAD improved the detection of breast cancer by 7.62%. Although the adoption of CAD systems has attracted great attention [5], further effort must be put on the investigation of related key technologies. These key technologies include calcification detection, mass detection, architectural distortion detection, and mass classification (malignant or benign).
In [6], the mass classification using gradients was investigated. In the proposed method, a mass boundary was segmented into concave and convex parts, and was polygonized. The features that quantify the extent of the spiculated nature of the boundary and the degree of narrowness of the spicules were extracted for mass classification.
In [7]–[8], morphological features with manually delineated boundaries were adopted for mass classification. Pohlman et al. [8] used an adaptive region growing technique to segment masses. Six features measuring mass shape and boundary roughness were extracted and used for classification. In [9], the mass classification based on the automated segmentation of masses was investigated.
3. PROPOSED SYSTEM
The Proposed CAD system has the following modules:
1. Input Images
2. Noise Reduction and ROI Extraction
3. Segmentation
4. Features Extraction
5. Feature Selection
6. Classification
The below shown is the architecture of the proposed CAD system.
Figure - 1: Architecture of proposed CAD System
3.1 Input Images Module
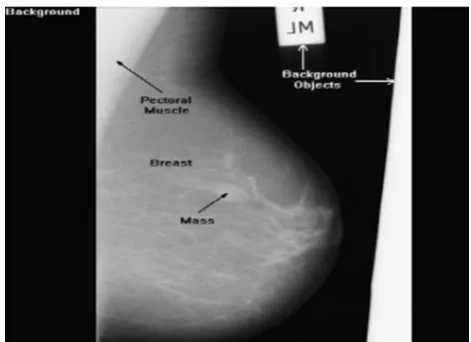
In this module we will take input images from Mammographic Image Analysis Society (MIAS), Digital Database for Screening Mammography (DDSM) and UCI Machine Learning Repository. Figure 4.2.1 shows the original mammographic image from the database.
Figure -2: Original mammogram
3.2 Noise Reduction and ROI Extraction
[image:2.595.315.551.456.627.2]© 2018, IRJET | Impact Factor value: 6.171 | ISO 9001:2008 Certified Journal | Page 559 Figure -2: ROI Extracted Image
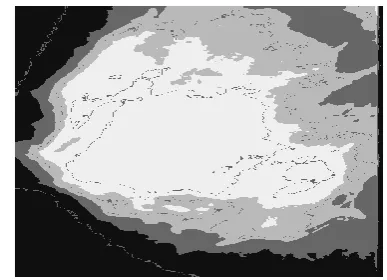
3.3 Segmentation
Once the required ROI is ready, it is then used for segmentation to get the segmented image. Result of image segmentation is a set of segments that collectively cover the entire image, or a set of contours extracted from the image. Fuzzy C-Means Clustering Algorithm is used for segmentation in proposed system. A clustering algorithm organizes items into groups based on similarity criteria. Here the data points can belong to more than one cluster, and associated with each of the points are membership grads which indicate the degree to which the data points belong to the different clusters. It tries to put each of the data points to one of the clusters. It does not decide the absolute membership of a data point to a given cluster; instead, it calculates the likelihood (i.e., the degree of membership). Each item may belong to more than one group (hence the word fuzzy), where the degree of membership for each item is given by a probability distribution over the clusters.
The FCM clustering is obtained by minimizing an objective function shown in below equation:
Fuzzy C-Means Algorithm
Step 1: Set the number of clusters, the fuzzy parameter (a constant > 1), and the stopping condition
Step 2: Initialize the fuzzy partition matrix
Step 3: Set the loop counter k = 0
Step 4: Determine the cluster centroids, calculate the objective value J
Step 5: For each pixel, for each cluster, compute the membership values in the matrix
[image:3.595.54.269.82.223.2]Step 6: If the value of J between consecutive iterations is less than the stopping condition, then stop; otherwise, set k=k+1 and go to step 4
Figure -3: Segmented image
3.4 Features Extraction
After segmenting the mass from the ROI, we computed a set of features that is related to the geometry and texture of the boundary. A typical benign mass has a round, smooth, and well-circumscribed boundary, whereas the boundary of a malignant tumor is usually speculated, rough, and blurry.
Geometry Features: The geometry features represent the shape of the contour of a mass. These are calculated from the boundary pixels after the segmentation. The geometry features can be any among compactness, Normalized Distance Moments, Fourier Features, Normalized Radial Length based features and relative gradient orientation based features.
Texture Features: In addition to the shape information of a mass contour, the texture information of the region surrounding the mass boundary also contains important information to discriminate the benign and malignant masses. Thus, we also used the texture information for the mass classification. The texture features extracted are based on Gray level Co-occurrence Matrix.
The libraries used to find out the features are as follows.
de.lmu.ifi.dbs.jfeaturelib.features.Haralick
de.lmu.ifi.dbs.jfeaturelib.shapeFeatures.Compactness de.lmu.dbs.ifi.jfeaturelib.examples.HaralickDemo de.lmu.dbs.ifi.jfeaturelib.examples.HaralickDemoTest
The extracted features are stored in attributes.csv file
3.5 Features Selection
In feature extraction module we have extracted total 31 geometry and texture features. We used WEKA library to select the optimum number of features for classification process.
© 2018, IRJET | Impact Factor value: 6.171 | ISO 9001:2008 Certified Journal | Page 560 combination of these attribute evaluator and search
algorithms can be used to determine the score and rank attribute in a data set.
WEKA tries to use a subset of features and train a model using them. Based on the inferences that WEKA draw from the previous model, it decide to add or remove features from your subset. The problem is essentially reduced to a search problem.
The libraries used to select the features of image are as follows:
Weka.associations Weka. attributeSelection Weka.classifiers
Then attributes.csv file is provided as input to the WEKA library. WEKA uses subset evaluation algorithm. On execution of algorithm, features are saved which will be further used for classification.
3.6 Classification
The main task of classifier is to categorize the ROI by considering the geometrical and textural features as benign or malignant. In training phase, data set which is labeled as benign and malignant mass are given to classifier as training data set and the classifier is trained. In testing phase, the unknown data (mammographic image) is given to classifier for actual classification.
Support Vector Machine is the algorithm used for classifying the image. The algorithmic steps are described below. LibSVM is being imported.
Support Vector Machine Algorithm
import libsvm.LibSVM;
import net.sf.javaml.classification.Classifier; import net.sf.javaml.core.Dataset;
import net.sf.javaml.core.Instance;
import net.sf.javaml.tools.data.FileHandler; Begin
1. class TutorialLibSVM 2. /* Load a data set */
Dataset data = FileHandler.loadDataset(new File("E:\\attributes.csv"), 31, ",");
3. /* Contruct a LibSVM classifier with default settings*/
Classifier svm = new LibSVM(); svm.buildClassifier(data);
4. /* Counters for correct and wrong predictions*/ int correct = 0, wrong = 0;
5. /* Classify all instances and check with the correct class values*/
for (Instance inst : dataForClassification) {
Object predictedClassValue = svm.classify(inst); Object realClassValue = inst.classValue(); if (predictedClassValue.equals(realClassValue)) correct++;
else wrong++; end
4. EXPERIMENTAL RESULTS
From the images, 430 ROIs that contains benign masses and 240 ROIs that contains malignant masses were extracted. Totally, 670 ROIs were used as input for training data set; which contained 430 benign training dataset and 240 malignant training dataset. After that segmentation, feature extraction is carried out on provided training dataset; where the segmented images get stored in the Project0 folder. Then, by clicking TEXTURE and GEOMETRIC FEATURES button, all the 31 texture and geometric features get extracted and get stored in attributes.arff file. Here we have selected all the 31 features since inclusion of all 31 features gives us better results for SVM classifier, as per experiment. Below are the snapshots of execution of the classification program.
For testing, we have taken some benign and malignant images from the same datasets. In the testing GUI, ROI of original mammographic image is provided as input. Then its segmented image is popped after clicking SEGMENTATION button. After that its texture and geometric features are calculated by clicking TEXTURE FEATURES and GEOMETRIC FEATURES button and displayed in the textbox. By clicking CLASSIFY button we will get the message in the message box as “The image is benign/ malignant”.
5. RESULT ANALYSIS
© 2018, IRJET | Impact Factor value: 6.171 | ISO 9001:2008 Certified Journal | Page 561 From 430 Benign ROIs, TP = 390, FN= 40,
From 240 Malignant ROIs, TN= 207, FP= 33
From the above obtained mathematical values and equations of TP, TN, FN and FP we get
[image:5.595.36.286.278.339.2]
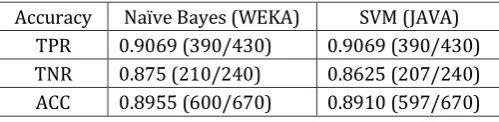
These results have been cross checked on WEKA explorer using Naïve Bayes algorithm to check the efficiency of the proposed SVM method. The comparative classification performance is shown in below table.
Table -1: The comparative classification performance
Accuracy Naïve Bayes (WEKA) SVM (JAVA) TPR 0.9069 (390/430) 0.9069 (390/430) TNR 0.875 (210/240) 0.8625 (207/240) ACC 0.8955 (600/670) 0.8910 (597/670)
From the above observation table the accuracy given by Naïve Bayes algorithm on WEKA explorer is 89.55% while that shown by SVM on JDK is 89.10%.
6. CONCLUSION
Breast cancer is the most common form of cancer among women and is the second leading of death after lung cancer. Early detection and diagnosis of breast cancer increase the treatment options and a cure is more likely. In this thesis, a breast mass classification system is implemented under the JDK environment for benign-malignant mass classification of previously segmented mass candidates. Also, the inclusion of all 31 features for classification stage has a positive effect on the results of classification. The proposed work is carried out on JDK environment using JAVA programming language. Test cases are cross checked on WEKA explorer which gave significant results. Standard datasets like DDSM, MIAS and UCI Machine learning repository are used. A Real Test case from Siddhivinayak Cancer Hospital is being tested which gave positive results. Comparative study shows SVM efficiently gives good accuracy.
REFERENCES
[1] Nikhil et al 2008; Derya 2009; Leonardo 2009; Lee et al
2000, “Computer Aided Diagnosis (CAD) system”.
[2] S. V. Destounis, P. DiNitto, W. Logan-Young, E. Bonaccio,
M. L. Zuley, and K. M. Willison, “Can computer-aided detection with double reading of screening mammograms help decrease the false-negative rate? Initial experience,” Radiology, vol. 232, no. 2, pp. 578– 584, Aug. 2004.
[3] M. Bazzocchi, F. Mazzarella, C. Del Frate, F. Girometti,
and C. Zuiani, “CAD systems for mammography: A real opportunity? A review of the literature,” Radiol Med., vol. 112, no. 3, pp. 329–353, Apr. 2007.
[4] M. J. Morton, D. H. Whaley, K. R. Brandt, and K. K.
Amrami, “Screening mammograms: Interpretation with computer-aided detection - Prospective evaluation,” Radiology, vol. 239, no. 2, pp. 375–383,Mar. 2006.
[5] J. Tang, R. Rangayyan, J. Xu, I. Naqa, and Y. Yang,
“Computer-aided detection and diagnosis of breast cancer with mammography: Recent advances,” IEEE Trans. Inf. Technol. Biomed., vol. 13, no. 2, pp. 236–251, Mar. 2009.
[6] R. Rangayyan, N. Mudigonda, and J. Desautels,
“Boundary modeling and shape analysis methods for classification of mammographic masses,” Med. Biol. Eng. Comput., vol. 38, no. 5, pp. 487–496, 2000.
[7] N. Mudigonda, R. Rangayyan, and J. Desautels, “Gradient
and texture analysis for the classification of mammographic masses,” IEEE Trans. Med. Imag., vol. 19, no. 10, pp. 1032–1043, Oct. 2000.
[8] S. Pohlman, K. Powell, N. Obuchowski, W. Chilcote, and S.
Grundfest Broniatowski, “Quantitative classification of breast tumors in digitized mammograms,” Med. Phys., vol. 23, no. 8, pp. 1337–1345, Aug. 1996
[9] A. Rojas Dominguez and A. Nandi, “Toward breast
cancer diagnosis based on automated segmentation of masses in mammograms,” Pattern Recog., vol. 42, no. 6, pp. 1138–1148, Jun. 2009
[10] Xiaoming Liu, Member, IEEE, and Jinshan Tang, Senior
Member “Mass Classification in Mammograms Using Selected Geometry and Texture Features, and a New SVM-Based Feature Selection Method,” IEEE TRANSACTIONS, VOL. 8, NO. 3, SEPTEMBER 2014
[11] I. Andreadis, G. Spyrou, A. Antaraki, G.Zografos, D.
Kouloheri, G. Giannakopoulou, K. Nikita & P. Ligomenides ,” Combining SVM and Rule-Based classifiers for optimal classification in breast cancer diagnosis”, Hellenic European Research on Mathematics and Informatics Science,2009
[12] S. Shanthi and V. Murali Bhaskaran,”Computer Aided
System for Detection and Classification of Breast Cancer”, (IJITCA) Vol.2, No.4, October 2012
[13] S. Deepa, Dr. V.Subbiah Bharathi,”Textural Feature