© 2018, IRJET | Impact Factor value: 6.171 | ISO 9001:2008 Certified Journal | Page 2127
An Experimental Study on Effect of Flexibility of Vegetation on
Resistance to Flow
Parismita Bora
1, Utpal Kumar Misra
21ME Student, Department of Civil Engineering, Assam Engineering College, Guwahati, India 2Associate Professor, Department of Civil Engineering, Assam Engineering College, Guwahati, India
---***---Abstract – Vegetation reduces the flow capacity of the channel and retards the flow to a remarkable extent. This effect depends mainly on height, density, distribution, stiffness, and type of vegetation. For flow of water through rigid and flexible vegetation, previous investigations show different results. Hence, the purpose of this study is to have a better knowledge on the impact of flexibility of vegetation on flow resistance. The experiments are carried out in a laboratory flume instead of natural channel, and Manning’s n is used to denote the resistance coefficient. PVC wires are used to simulate the flexible vegetation in this study. The results show a decreasing trend in resistance with the increase in the flexibility of vegetation. For a particular depth, the flow resistance is found to be more in rigid vegetation than in flexible vegetation.
Key Words: Rigid Vegetation, Flexible Vegetation, Stiffness, Resistance Coefficient, Manning’s n.
I. INTRODUCTION
Vegetation growing in the natural open channels is recognized to have a significant impact on the water flow. It has been generally agreed that vegetation increases flow resistance, changes backwater profiles and therefore it has been the subject of several studies. Flow resistance of natural open channels is affected by height, density, distribution, stiffness, and type of vegetation. The affect of flexible and rigid vegetation on flow resistance has been a well-established key of research in literature, from the past (e.g. Chow 1959, Barnes 1967) till now a days (e.g. Ghisalberti & Nepf2002, Järvelä 2004, Carolloet al. 2005). The conveyance of river is greatly affected by the flow resistance due to vegetation and hence evaluating the flow resistance has become a critical task in river engineering. Nevertheless, a considerable number of flow resistance formulas or models have been developed after studying the affect of rigid and flexible vegetation on flow resistance. The purpose of this paper is to explore the effect of rigid vegetation and flexible vegetation on the flow resistance coefficient, Manning’s n under submerged conditions.
Manal M. Abood et al., (2006) conducted a laboratory study to analyze the effects of different types of vegetation on the roughness coefficient Manning’s n in an open channel. Two type of vegetation were used in this study, namely Napier grass (Pennisetum Purpureum), which is quite flexible and Cattail grass (Typha SPP), which has a rigid
stem. The results showed that Manning's, n, for flows with Napier grass increased with the increase in flow depth for both submerged and emergent conditions. In the presence of Cattail grass and for high density, the effects were reversed and the decrease in Manning's, n was found to be 41% for same increase in degree of submergence. It was due to the effect of branching stems (resistance to the flow) which existed in Napier grass while Cattail grass has no branching stems (less resistance to the flow). A linear relationship was found between Manning's, n and grass density for both submerged and emergent flow conditions. When the density increased from 20 veg/ to 40 veg/ , the value of Manning's n increased by 35% for Napier grass and 25% for Cattail grass. arrangement gave less effect on Manning's n.
Wilson C.A.M.E (2007) investigated the variation of hydraulic roughness parameters with flow depth for submerged flexible vegetation in an experimental study. They used flexible grass canopies to examine the impact of stem height, grass type and degree of submergence on the flow resistance properties. Results revealed that Manning's n roughness coefficient increases with decreasing flow depth reaching an asymptotic constant at lower levels of vegetation submergence.
© 2018, IRJET | Impact Factor value: 6.171 | ISO 9001:2008 Certified Journal | Page 2128 II. EXPERIMENTAL SETUP
[image:2.595.313.557.87.200.2]All experimental data were collected in the Hydraulics Laboratory of the Civil Engineering Department at Assam Engineering College, Guwahati, India. Tests were conducted in a rectangular flat bottomed open channel with metallic bed and sides made of Perspex having a length of 5.3 m, width of 0.101 m and a depth of 0.21 m. The flume bed was covered with a layer of cement mortar. PVC wires of diameter 4 mm were used to simulate vegetation stems and they could be bent as per requirement. The wires were drilled into the cement layer and thus were attached to the flume bed. The top of the wires averaged 8.5 cm above the surface of the cement mortar bed. In this study three forms of flexible vegetation were used along with rigid vegetation in order to study the influence of flexibility of vegetation on Manning’s n. The three forms of flexible vegetations simulated were named as flexibility 1, flexibility 2 and flexibility 3. When the top of the wires were kept at 8.5cm from the channel bed i.e. the wires were kept completely straight then they had simulated rigid vegetation and when the top of the wires were bend by 3.5cm, 6cm and 8cm from the original position then they had simulated flexibility 1, flexibility 2 and flexibility 3 vegetation respectively. The whole flume was divided into eleven sections and the readings were taken at each section. In this study 20 experimental runs were carried out (Table 1), five discharges each with rigid vegetation, flexibility 1, flexibility2 and flexibility 3 (Fig 1, 2, 3 and 4 respectively). The bed slope was kept constant at 1:117.64 and the velocity was measured by Pitot tube.
Table 1- Experimental data related to all the experimental runs
Section Slope Discharge (m3/s)
Type of Vegetation
1 1:117.64 0.00529
Rigid
2 1:117.64 0.00726
3 1:117.64 0.00866
4 1:117.64 0.01199
5 1:117.64 0.01244
6 1:117.64 0.005
Flexibility 1
7 1:117.64 0.00685
8 1:117.64 0.00807
9 1:117.64 0.01016
10 1:117.64 0.01175
11 1:117.64 0.00386
Flexibility 2 12 1:117.64 0.005135
13 1:117.64 0.006315
14 1:117.64 0.00846
15 1:117.64 0.010915
16 1:117.64 0.00290
Flexibility 3
17 1:117.64 0.00374
18 1:117.64 0.00459
19 1:117.64 0.006125
20 1:117.64 0.00812
Chart 1- Flow through rigid vegetation
Chart 2-Flow through flexibility 1
Chart 3- Flow through flexibility 2
Chart 4- Flow through flexibility 3
III. EXPERIMENTAL RESULTS
© 2018, IRJET | Impact Factor value: 6.171 | ISO 9001:2008 Certified Journal | Page 2129 channel the variation was studied. The computation of
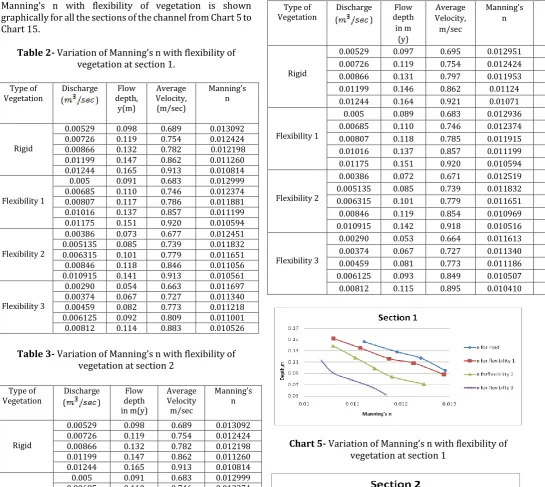
[image:3.595.35.581.117.604.2]Manning’s n at three different sections of the channel is shown from Table 2 to Table4 and the variation of Manning’s n with flexibility of vegetation is shown graphically for all the sections of the channel from Chart 5 to Chart 15.
Table 2- Variation of Manning’s n with flexibility of vegetation at section 1.
Type of
Vegetation (Discharge )
Flow depth, y(m) Average Velocity, (m/sec) Manning’s n Rigid
0.00529 0.098 0.689 0.013092
0.00726 0.119 0.754 0.012424
0.00866 0.132 0.782 0.012198
0.01199 0.147 0.862 0.011260
0.01244 0.165 0.913 0.010814
Flexibility 1
0.005 0.091 0.683 0.012999
0.00685 0.110 0.746 0.012374
0.00807 0.117 0.786 0.011881
0.01016 0.137 0.857 0.011199
0.01175 0.151 0.920 0.010594
Flexibility 2
0.00386 0.073 0.677 0.012451
0.005135 0.085 0.739 0.011832
0.006315 0.101 0.779 0.011651
0.00846 0.118 0.846 0.011056
0.010915 0.141 0.913 0.010561
Flexibility 3
0.00290 0.054 0.663 0.011697
0.00374 0.067 0.727 0.011340
0.00459 0.082 0.773 0.011218
0.006125 0.092 0.809 0.011001
0.00812 0.114 0.883 0.010526
Table 3- Variation of Manning’s n with flexibility of vegetation at section 2
Type of
Vegetation (Discharge )
Flow depth in m(y) Average Velocity m/sec Manning’s n Rigid
0.00529 0.098 0.689 0.013092
0.00726 0.119 0.754 0.012424
0.00866 0.132 0.782 0.012198
0.01199 0.147 0.862 0.011260
0.01244 0.165 0.913 0.010814
Flexibility 1
0.005 0.091 0.683 0.012999
0.00685 0.110 0.746 0.012374
0.00807 0.117 0.786 0.011881
0.01016 0.137 0.857 0.011199
0.01175 0.151 0.920 0.010594
Flexibility 2
0.00386 0.073 0.677 0.012451
0.005135 0.085 0.739 0.011832
0.006315 0.101 0.779 0.011651
0.00846 0.118 0.846 0.011056
0.010915 0.141 0.913 0.010561
Flexibility 3
0.00290 0.054 0.663 0.011697
0.00374 0.067 0.727 0.011340
0.00459 0.082 0.773 0.011218
0.006125 0.092 0.809 0.011001
0.00812 0.114 0.883 0.010526
Table 4- Variation of Manning’s n with flexibility of vegetation at section 3
Type of
Vegetation (Discharge ) depth Flow
in m (y) Average Velocity, m/sec Manning’s n Rigid
0.00529 0.097 0.695 0.012951
0.00726 0.119 0.754 0.012424
0.00866 0.131 0.797 0.011953
0.01199 0.146 0.862 0.01124
0.01244 0.164 0.921 0.01071
Flexibility 1
0.005 0.089 0.683 0.012936
0.00685 0.110 0.746 0.012374
0.00807 0.118 0.785 0.011915
0.01016 0.137 0.857 0.011199
0.01175 0.151 0.920 0.010594
Flexibility 2
0.00386 0.072 0.671 0.012519
0.005135 0.085 0.739 0.011832
0.006315 0.101 0.779 0.011651
0.00846 0.119 0.854 0.010969
0.010915 0.142 0.918 0.010516
Flexibility 3
0.00290 0.053 0.664 0.011613
0.00374 0.067 0.727 0.011340
0.00459 0.081 0.773 0.011186
0.006125 0.093 0.849 0.010507
0.00812 0.115 0.895 0.010410
Chart 5- Variation of Manning’s n with flexibility of vegetation at section 1
© 2018, IRJET | Impact Factor value: 6.171 | ISO 9001:2008 Certified Journal | Page 2130 Chart 7- Variation of Manning’s n with flexibility of
vegetation at section 3
Chart 8- Variation of Manning’s n with flexibility of vegetation at section 4
Chart 9- Variation of Manning’s n with flexibility of vegetation at section 5
Chart 10- Variation of Manning’s n with flexibility of vegetation at section 6
Chart 11- Variation of Manning’s n with flexibility of vegetation at section 7
Chart 12- Variation of Manning’s n with flexibility of vegetation at section 8
Chart 13- Variation of Manning’s n with flexibility of vegetation at section 9
© 2018, IRJET | Impact Factor value: 6.171 | ISO 9001:2008 Certified Journal | Page 2131 Chart 15- Variation of Manning’s n with flexibility of
vegetation at section 11
IV. CONCLUSIONS
This experimental study explored the effect of submerged bending vegetations on the roughness coefficient, Manning’s n. The results of all the experimental tests were analyzed and the following conclusions could be drawn from the present study:
1. From the graphical presentation (Chart 7 to Chart 15), it could be seen that irrespective of the vegetation being rigid or flexible, the Manning’s coefficient n decreases with the increase in depth of flow.
2. The results have revealed that rigid vegetation has more resistance to flow than flexible vegetation under similar flow condition.
3. When the variation of n with flexibility of vegetation was being studied at every cross-section, it was observed that for a given depth of flow Manning’s n decreases with the increase in the flexibility of the vegetation. Thus, the sequence of n values for the different types of vegetation can be written as nrigid > nflexibility1 > nflexibility2 > nflexibility3.
REFERENCES
[1] Abood M. M., Yusuf B., Mohammed T.A., Ghazali A.H. (2006), “Manning Roughness Coefficient for Grass-Lined Channel”, Suranaree J. Sci. Technol., 13(4): 317-330.
[2] Baptist M.J. (2003), “A flume experiment on sediment transport with flexible, submerged vegetation”, International workshop on Riparian Forest Vegetated Channels: hydraulic, morphological and ecological aspects, 20-22
[3] Cheng N.S., Nguyen H.T. (2011), “Hydraulic Radius for Evaluating Resistance Induced by Simulated Emergent Vegetation in Open-Channel Flows”, Journal Of Hydraulic Engineering, 137(9): 995-1004.
[4] Cheng N.S., Nguyen H.T., Tan S.K., Shao S. (2012), “Scaling of Velocity Profiles for Depth-Limited Open Channel Flows over Simulated Rigid Vegetation”, Journal Of Hydraulic Engineering, 138(8): 673-683.
[5] Fathi-Maghadam M., Drikvandi K. (2012), “Manning Roughness Coefficient for Rivers and Flood Plains with Non-Submerged Vegetation”, International Journal of Hydraulic Engineering, 1(1): 1-4.
[6] Hamimed A., Nehal L., Benslimane M.M, Khaldi A. (2013), “Contribution To The Study Of The Flow Resistance In A Flume With Artificial Emergent Vegetation”, Larhyss Journal, ISSN 1112-3680, pp. 55-63
[7] Noarayanan L., Murali K., Sundar V. (2013), “Manning’s ‘n’ for Staggered Flexible Emergent Vegetation”, Journal of Earthquake and Tsunami, Vol. 7, No. 5, 1250029 (18 pages).
[8] Stephan U., Gutknecht D. (2002), “Hydraulic resistance of submerged flexible vegetation”, Journal of Hydrology, 269, 27–43