© 2017, IRJET | Impact Factor value: 5.181 | ISO 9001:2008 Certified Journal | Page 482
“Determination of Optimum Parameters affecting the properties of O
Rings”
Thejas Shetty A
1, Sudheer D Kularni
2,
1
MTech Student, Dept of IEM, Ramaiah Institute of Technology, Bengaluru, Karnataka, India
2
Assistant Professor, Dept of IEM, Ramaiah Institute of Technology, Bengaluru, Karnataka, India
---***---Abstract -
An abstract summarizes, in one paragraph(usually), the major aspects of the entire paper in the following prescribed sequence.
Design of experiment is a structured statistical technique used for analyzing the behavior of a product by changing various parameters in a specific manner and thereby recording the responses. Design of experiment includes choosing between different alternatives, thus selecting a key factor affecting the response. Application of DOE includes choosing between alternatives, selecting the factors affecting a response, regression modelling etc. The interpretation of results determining the set of factors that is responsible for each response measured in the experiment, finding the relationship between each measured response and determining the range of statistically significant factors.
In the present we use DOE to identify the optimum parameters affecting the properties of EPDM G2 flange. A design with four factors and two levels was used to find the optimum temperature that is affecting the various mechanical properties that affects the O ring. The factors used are curing temperature, curing time, heat treatment temperature and heat treatment time which are experimented at various combinations. The O rings tested for tensile strength, elongation at break, load at break and elongation at break. The effect of curing and heat treatment on various mechanical properties is studied. MINITAB is used for generating contour plots such as regression analysis and interaction plots are generated and the optimum parameters are selected. The plots are interpreted to find the optimal parameter.
Key Words: Design of Experiment, ANOVA, Tensile strength,
Load at break, Elongation at break, Percentage elongation of G2 Flange.
1. INTRODUCTION
Design of experiments is a systematic approach to the engineering problem solving that applies principles and techniques at the stage of data collection so as to ensure the generation of valid, defensible and supportable engineering conclusion. In addition, all these are carried out with minimal expenditure of engineering runs, time and money. The four general problem were DOE can be applied are (a) Comparative (b) Screening/ Characterizing (c) Modeling (d)
Optimizing. Various important concepts in creating designed experiment include blocking, randomizing and replication. Design of experiments (DOE) is used to understand the effects of the factors and interactions that impact the output of a process. DOE is used to methodically understand and enhance the predictability of the process. The variation that might impact the process output is investigated through design of experiment approach. The potential factors are derived from variety of sources including understanding the process map, brain storming, and fishbone diagram and cause and effect matrices. With a designed experiment, you change the process settings to see the effect this has on the process output. Design of experiment refers to the structured way you change these parameters, so as to study the effect of changing multiple setting simultaneously. This active approach allows you to effectively and efficiently explore the relationship between multiple process variables (x’s) and the output, or process performance variables (y’s).
DOE identifies the “vital few” sources of variation (x’s)—the factors that have the biggest impact on the results DOE identifies the x’s that have little effect on the results. It quantifies the effects of the important x’s, including their interactions. It produces an equation that quantifies the relationship between the x’s and the y’s.It predicts how much gain or loss will result from changes in process conditions
1.1 Advantages of DOE
Many factors can be evaluated simultaneously, making the DOE process economical and less interruptive to normal operations. Sometimes factors having an important influence on the output cannot be controlled (noise factors), but other input factors can be controlled to make the output insensitive to noise factors.
© 2017, IRJET | Impact Factor value: 5.181 | ISO 9001:2008 Certified Journal | Page 483 Since the designs are balanced, there is confidence in the
conclusions drawn. The factors can usually be set at the optimum levels for verification.
If important factors are overlooked in an experiment, the results will indicate that they were overlooked.
Precise statistical analysis can be run using standard computer programs.
Frequently, results can be improved without additional costs (other than the costs associated with the trials). In many cases, tremendous cost savings can be achieved.
1.3 Full Factorial design
A full factorial design is an experiment whose design consists of two or more factors, each with discrete possible values or “levels” and whose experimental units take on all possible combination of these levels across all such factors. The full factorial design may also be called as fully crossed design. The full factorial design allows studying the effect of each factor on the response variable, as well as the effect of interaction between factors on the response variable. It provides the most response information about the factor main effects and factor interaction. When validated it allows process to be optimized. In full factorial DOE the ANOVA analysis will show which factors are significant, regression analysis will provide the coefficient for the prediction equation i.e. Mean and Standard deviation and the residual analysis will show the fit of the model.
1.4 ANOVA
ANOVA is a particular form of Statistical hypothesis testing significantly used in the analysis of experimental data. A statistical hypothesis test is a method of making decision using the analysis of experimental data. A test is called statistical significant if it is deemed unlikely to have occurred by chance, assuming the truth of the null hypothesis. A statistically significant result (when a probability p value) is less than a significant level justifies the rejection of null hypothesis. In the typical application of ANOVA the null hypothesis is that all groups are simply random group samples of same population which implies that all treatments have the same effect. Rejection of null hypothesis implies that different treatment result in altered effect.
1.5 Software used
To analyze, to identify the data distribution, to conduct a DOE and analyze the outputs statistical software like Minitab, Excel is used.
1.5.1 Minitab
Minitab is a statistical package developed at Pennsylvania State University by researcher Barbara F. Ryan and Bryan L. Joiner in 1972. It began as a light version of OMNITAB, a statistical
analysis program by NIST; the documentation of OMNITAB was published in 1986, and since then there has been no significant development. Minitab is distributed by Minitab Inc, a privately
owned company headquartered in State college, Pennsylvania.
At present, Minitab is used often in conjunction with the implementation of Six sigma, CMMI and other statistic based process improvement method.
1.5.2 Excel
Excel is a Microsoft product
It is used widely to store data and analyze it. Mathematical formulations can be easily done on
this package
It has graphical representation and provides better understating of real time problems.
Excel is widely used in Engineering, Banking sector, Medical, Industries etc.
2. METHODOLOGY
Steps followed during Experimentation
The 3 main steps to be followed during the experimentation are as follow
Design
© 2017, IRJET | Impact Factor value: 5.181 | ISO 9001:2008 Certified Journal | Page 484
3. DATA COLLECTION
3.1 Design
3.1.1 System analysis and clear definition of
objective
Process flow chart
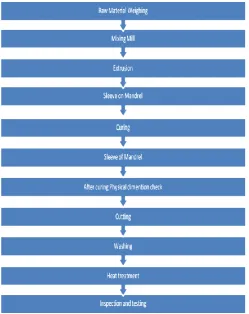
[image:3.595.36.286.283.598.2]Process flow chart indicates the firm’s graphical representation. It represents the procedure of operations that is involved in making of a final product. The below flow chart represents the process flow of material for G2 flange O ring.
Figure 3.1Process flow chart
3.1.2 Definition of the objective function
The process involved in the manufacturing of EPDM G2 flange was clearly observed. Brainstorming on the current process carried out in the plant was done in the presence of the process engineer of the plant. The factors that are considered in each process were discussed. On observation of the process it is found that the Curing and Heat treatment parameters are chosen randomly through previous results obtained of the mechanical properties. Further in conversation with the process engineer it was seen that that
Curing and heat treatment parameters could be varied, if it yielded the same mechanical properties as that compared with present mechanical properties. The various factors and responses to be considered in the curing and heat treatment process of G2 flange manufacturing are discussed with the process engineer.
3.1.3 Experimental design
The experiment was conducted using 2^4 design with 3 replicates in order to find the optimum parameters of G2 flange O rings. Totally 48 runs were formed using Minitab Software Package. The factors considered and their different low and high values are listed in the table
.
Table 3.1 Process control parameters and their levels
CONTROL FACTORS LOW HIGH
Curing Temperature
(degree) 150 170
Curing Time (min) 20 30
Heat Treatment Temp
(degree) 120 130
Heat Treatment Time
(min) 45 60
3.1.4 Response Variables
In general variables of interest in an experiment are called responses or dependent variables. Other variables in the experiment that affect the response and can be set or measured by the experimenter are called predictor, explanatory, or independent variables.
The main objective of response variables are
Determining which variables are most influential on the response.
Determining where to set the influential X’s so as Y is near to the nominal value.
Determining where to set the influential X’s as the variability in Y is small
[image:3.595.312.557.308.438.2]© 2017, IRJET | Impact Factor value: 5.181 | ISO 9001:2008 Certified Journal | Page 485 Table 3.2 Responses and its allowable range
Responses considered Allowable range
Tensile strength Above 6 N/sq m
Elongation at break Above 170%
Load at break Above 200%
Percentage elongation of G2
flange Above 230%
Responses that are considered for curing and heat treatment parameters.
3.2 Run order
The experiment was conducted using 2^4 design with 3 replicates in order to find the optimum parameters of G2 flange O rings. Totally 48 runs were formed using Minitab Software Package
.
For various combinations of control factors chosen the corresponding response values are found using universal tester machineInteraction plots
Two independent variables interact if the effect of one of the variables differs depending on the level of the other variable. The means from the hypothetical experiment described in the section on factorial designs are reproduced below.The dependent variable (response time) is shown on the Y axis.
[image:4.595.307.572.137.255.2]3.2.1 Interaction plot for Tensile strength of G2
flange O rings
Figure 3.1 Interaction plot for Tensile strength
From the interaction plots it is seen that some of the lines are parallel and not interacting. It is also seen that some of the lines are completely interacting which shows that there is an interaction between them. The plot for curing time and heat time is interacting completely and however the contrast value for rest of the interaction plots is low and hence insignificant.
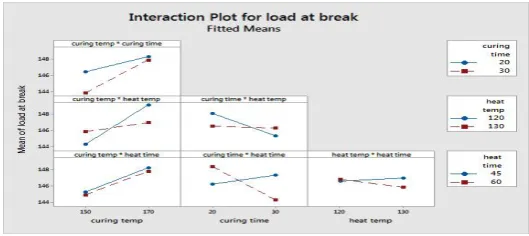
3.2.2 Interaction plots for load at break of G2 flange
O rings
Figure 3.2 interaction plots for load at break
It is seen from the interaction plots that there is interaction between curing parameters and heat temperature parameters. However the contrast values are low, so they are insignificant.
[image:4.595.310.567.386.504.2]3.2.3 Interaction plots for elongation at break of G2
flange O ring
Figure 3.3 Interaction plots for elongation at break
From the interaction plots for elongation at break shows that there is significant interaction between curing temperature and curing time. However the interaction between various other factors is low and hence insignificant.
[image:4.595.37.283.481.634.2]3.2.4 Interaction plots for percentage elongation of
G2 flange
[image:4.595.309.558.636.746.2]© 2017, IRJET | Impact Factor value: 5.181 | ISO 9001:2008 Certified Journal | Page 486 From the interaction plots for percentage elongation at
break, there is significant interaction between curing temperature and curing time. However the interaction between various other factors is low and hence insignificant.
4. ANALYSIS OF VARIANCE
Analysis of variance (ANOVA) is a collection of statistical models in analyzing the differences among group means and their associated procedures (such as "variation" among and between groups), developed by statistician and evolutionary biologist Ronald Fisher. In the ANOVA setting, the observed variance in a particular variable is divided into components attributable to different sources of variation. In its simplest form, ANOVA provides a statistical test of whether or not the means of several groups are equal, and therefore generalizes the t-test to more than two groups. ANOVAs are useful for comparing (testing) three or more means (groups or variables) for statistical significance. It is conceptually similar to multiple two-sample t-tests, but is more conservative and is therefore suited to a wide range of practical problems.
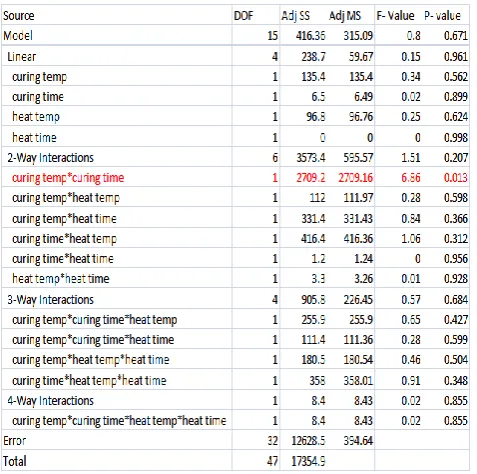
4.1 ANOVA table for elongation at break of G2
flange
[image:5.595.308.547.170.407.2]The below table shows that the p-value for linear model, 3 way and 4 way interaction is greater than 0.05. But in the 2 way model, the p value for curing temperature and curing time is 0.013 which is less than 0.05. This shows that there is a significant change with the curing parameters.
Table 4.1 ANOVA table for elongation at break
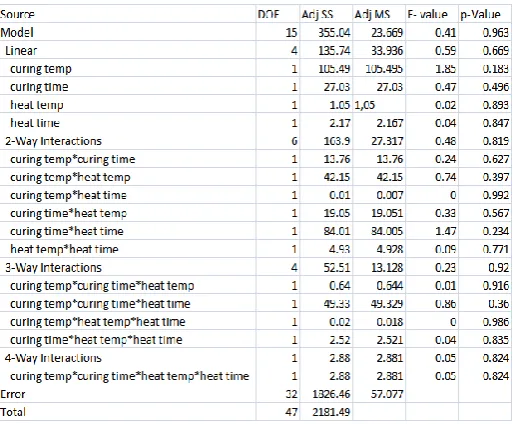
4.2 ANOVA table for percentage elongation at break
of G2 flange
Table 4.2 ANOVA table for percentage elongation of G2 flange O ring
The above table shows that the p-value for linear model, 3 way and 4 way interaction is greater than 0.05. But in the 2 way model, the p value for curing temperature and curing time is 0.013 which is less than 0.05. This shows that there is a significant change with the curing parameters.
4.3 ANOVA table for tensile strength of G2 flange
Table 4.3 ANOVA table for tensile strength
[image:5.595.35.283.500.733.2]© 2017, IRJET | Impact Factor value: 5.181 | ISO 9001:2008 Certified Journal | Page 487
4.4 ANOVA table for load at break of G2 flange
[image:6.595.35.289.84.324.2]From the above table it is seen that all the p values for 2- way interaction, 3 way interaction and 4 way interaction is greater than 0.005. Therefore it is seen that all combination of interactions are insignificant.
Table 4.4 ANOVA table for load at break
4.5 Present Plant operation cost at a curing temp of
170 degree and curing time of 25 min
No of hours in one shift =12 hrs No of shifts per day =2
Cycle time of each batch =35 min (ie. Curing time in oven=25 min , set up time in curing oven)
No of batches per shift =20 Cost of one kg of steam = Rs 2.60
Average consumption of steam per day = 1400 kg Steam consumed per hour = 58.34 kg/hr
Cost of steam per hour = Rs 151.684
No of hours of steam required for 1 shift running at 25 min per batch = 500/60= 8.83hr/shift
Steam cost per shift = Rs 1263.52 Steam cost for one day = Rs 2527
Steam cost for one month = Rs 2527*25= Rs 63,176
4.5 Proposed Plant operation cost taking Curing
temp as 170 degree and curing time as 20 min
Cycle time of each batch = 30 min (Curing time in oven =20 min , Set up time in curing oven=10 min No of batches per shift =20
Cost of one kg of steam = Rs 2.60 Steam cost per hour =Rs 151.684
No of hours of steam required for one shift running at 20 min/batch =400 min/shift=6.67 hrs/shift Steam cost per shift = Rs 1,011.73
Steam cost for one day = Rs 2023.46 Steam cost for one month = Rs 50586.614
5. RESULT
5.1 Cost calculation
It has been observed that, the present plant cost of energy consumed for curing process (i.e. running at a curing temperature of 170 degree for 25 min) is Rs 63,176. By the implementation of the proposed design (i.e. running the curing oven at a temperature of 170 degree and for 20 min) the energy cost for the curing oven was reduced to Rs 50,586. Thus the total energy cost saved per month by the implementation of proposed curing parameters is Rs 12,590.
Table 5.1 Energy cost Calculation
Initial cost Rs 63,176
Proposed cost Rs 50,586
Total cost saved per
month Rs12590
5.2 Time calculation
[image:6.595.37.294.447.659.2]© 2017, IRJET | Impact Factor value: 5.181 | ISO 9001:2008 Certified Journal | Page 488 Table 5.2 Time calculation
Initial time 700 min
Proposed time 600 min
Total time saved 100 min
6. CONCLUSION
• As per ANOVA table or Factorial Regression model there is a 2 way interaction between curing temperature and curing time in elongation at break and Percentage elongation of G2 flange as p value is less than .05 in the above cases
• As per interaction plots for Tensile strength, Load at break, Elongation at Break and Percentage elongation of G2 flange it seen that Curing temperature and curing time of (150 degree, 30 min) and (170degree, 20 min) both are significant and yields satisfactory results as per industry requirements
• The curing temp of 170 degree and a curing time of 20 min is chosen as there is decrease in cycle time and energy consumption in each batch
• At present the curing temperature and curing time is 170 degree and 25 min from this we can conclude that there is 5 min reduction in the curing time, which contributes to increase in productivity and decrease in the total energy consumed
• As per calculations there is a cost saving of Rs 12,590 per month and a time saving of 100 min per batch
REFERENCES
[1] Astha Kukreja, Pankaj Chopra, Akshay Aggarwal, and
Pradeep Khanna “Application of Full Factorial Design for Optimization of feed Rate of Stationary Hook Hopper” International Journal of Modeling and Optimization, Vol. 1, No. 3.
[2] Drégelyi-Kiss Á & Horváth R, Mikó B “Design Of
Experiments (DOE) in Investigation of Cutting Technologies” Cracow University of Tehnology, August 2013. p.20-34. ISBN 978-83-7242-697-0.
[3] Dr. D. Dixon, Dr. J. Eatock, Prof. B.J. Meenan, and M.
Morgan “Application of Design of Experiment (DOE) Techniques to Process Validation in Medical Device Manufacture” Journal of Validation Technology, February 2006 Volume. 12, Number 2
[4] Irene S. Fahim, Salah M. Elhaggar and Hatem
Elayat“Experimental Investigation of Natural Fiber Reinforced Polymers” Materials Sciences and Applications, 2012, 3, 59-66.
[5] Jan Hron & Tomáš Macák “Application of Design of
Experiments to Welding Process of Food Packaging”
International Journal of Operations and Production Management, 21, 5–6: 812–822. ISSN 0144-3577.
[6] Meera Balachandran, Lisha P Stanly, R. Muraleekrishnan
and S.S. Bhagawan Design of experiments for optimizing NBR nano composite formulations”
[7] Martín Tanco, Elisabeth Viles, Laura Ilzarbe & María
Jesus Álvarez “Manufacturing Industries Need Design of Experiments (DOE)” Proceedings of the World Congress on Engineering 2007 Vol II.
[8] Mara Tânia S. Alcântara, Maria Elena S. Taqueda and
Ademar B. Lugão “Experimental Design of Mixture Applied to Study Pvp Hydrogels Properties Crosslinked by Ionizing Radiation” International Nuclear Atlantic Conference - INAC 2009.
[9] Nadeem Irfan Bukhari, Simran Kaur, Saringat H. Bai,
Yuen Kah Hay, Abu Bakar Abdul Majeed, Yeow Beng Kang and Mark J. Anderson “Statistical Design of Experiments on Fabrication of Starch Nano particles – A Case Study for Application of Response Surface Methods (RSM)” The American Statistician, V44, No. 1, Feb.
[10] S.Rajalinga, Awang Bono and Jumat bin Sulaiman