© 2017, IRJET | Impact Factor value: 5.181 | ISO 9001:2008 Certified Journal
| Page 1679
Graphical User Interface for Universal Testing Machine Using Qt
Gore Snehalata Shivajirao
1, Y.B.Mane
21
Department of Electronics Engineering,Walchand College of Engineering,Sangli,Maharashtra,India
2
Assistant Professor, Dept. of Electronics Engineering,Walchand College of Engineering,Sangli,Maharashtra,India
---***---Abstract -
GUI (Graphical User Interface) is one of themajor achievements on computer development, compared with the traditional interface. It is more acceptable visually for users. This paper gives the design methods about Universal Testing Machine, which is based hardware platform and Linux2.6 kernel as Qt/Embedded application development. To develop GUI based control system for UTM machine to control its operation with selected control methodology.
Key Words
: Universal testing machine, Qt, GUI
1. INTRODUCTION
A universal testing machine (UTM), also known as a universal tester, materials testing machine or materials test frame, is used to test the tensile strength and compressive strength of materials. Universal Testing Machines have a wide range of applications, and number of materials, metals in different form and shapes can be tested for variety of test like Tension, Compression, Transverse, Bend, shear, Brinell Hardness etc. Special attachments are also available for testing of Flat Belts, Chain Links, and Wire Ropes etc.
Graphical User Interface:
Qt Software controls testing systems for test setup, test control, data collection, result generation and report preparation. The software features a graphical user interface fully implemented in Windows. It provides up to four real-time numerical displays (digital and/or analog) of test data as well as graphs, results tables and reports. Simple, memorable icons represent system functions for rapid learning and quick test setups.
GUI testing is the process of ensuring proper functionality of the graphical user interface (GUI ) for a given application and making sure it conforms to its written specifications.
In addition to functionality, GUI testing evaluates design elements such as layout, colors, fonts, font sizes, labels, text boxes, text formatting, captions, buttons, lists, icons, links and content. GUI testing processes can be either manual or automatic, and are often performed by third -party companies, rather than developers or end users.
GUI testing can require a lot of programming and is time consuming whether manual or automatic. Usually the software author writes out the intended function of a menu or graphical button for clarity so that the tester will not be confused as to the expected outcome. GUI testing also tends to test for certain program behaviors that users expect, like an hourglass when the program is busy, the F1 key bringing up the help system and many other common details.
1.2 Qt:
Qt is a cross-platform application framework that is used for developing application software that can be run on various software and hardware platforms with little or no change in the underlying codebase, while still being a native application with native capabilities and speed
.
Qt uses standard C++ with extensions including signals and slots that simplify handling of events, and this helps in development of both GUI and server applications which receive their own set of event information and should process them accordingly. Qt supports many compilers, including the GCC C++ compiler and the Visual Studio suite. Qt also provides Qt Quick, that includes a declarative scripting language called QML that allows using JavaScript to provide the logic. With Qt Quick, rapid application development for mobile devices became possible, although logic can be written with native code as well to achieve the best possible performance.
Qt can be used in several other programming languages via language bindings. It runs on the major desktop platforms and some of the mobile platforms.
1.3 Sqlite Database:
DB Browser for SQLite is a high quality, visual, open source tool to create, design, and edit database files compatible with SQLite.
© 2017, IRJET | Impact Factor value: 5.181 | ISO 9001:2008 Certified Journal
| Page 1680
2. Proposed System & Methodology:
Figure 1: System Architecture
UTM is connected to data acquisition system The change in load or other parameters related to UTM we can observe on this data acquisition system. These parameters are provided to embedded system board by data acquisition system & according to that we can take any action using embedded system board. Now this is we can say on physical layer. Directly user cannot change anything so GUI is required on application layer. This GUI is deployed on embedded system board. We have created this GUI to directly control the tests and display the results
3. Working
According to the actual requirements of Universal testing machine, we have to follow following steps:
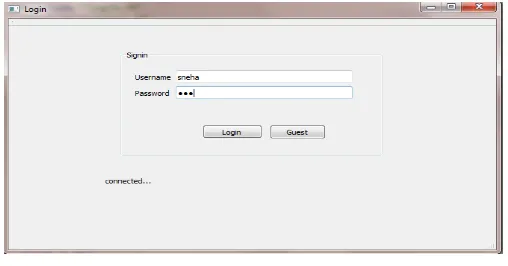
Step 1:
1st of all login with correct Id & password,if we enter the
incorrect Id & Password then it will not open the next window.
Fig-2: Login window
Step 2:
Once the login id & password is matched then we will connected to the Home Screen as shown bellow.
In this window there are three buttons:
1.Test:For testing the materials.
2.Admin:To add or delete the users entry.
3.Help:
It
shows the necessary details.Fig-3: Home window
Step3:
How to start the test?
After clicking the test button the window is displayed which is shown in below fig.This is the window in which we can test the materials by using different type of methods. 1stly we create some batches for different types of materials.
Step1: Select batch from already created batches, then
automatcally It shows next specimen No. which we want to test.Step2: Select speciman type circuilar, rectangular or pipe.
Step3: Fill the speciman geometry details, if the specimen is
in rectangular shape then set its height,width & thickness,if the specimen is circular then set its diameter & thickness,if the specimen is in pipe then set its thickness & diameStep4: Select test method from exising methods.
Step5: Select material type i.e Iorn
Gold
Silver
Copper
Rubber
Step6: Set the specimen Guage lengths there are two guage
lengths i.e Guage length 1 & Guage length 2.Step7: If Extensometer is used then select it & set the
Extensometer guage length. [image:2.595.34.288.539.672.2]© 2017, IRJET | Impact Factor value: 5.181 | ISO 9001:2008 Certified Journal
| Page 1681
Fig-4: Testing windowHow to Create a Batch?
In the first window i.e. test, the third tab i.e batch master is used to create new batches.
Fig-5: Testing window
Here in this window fill up the batch details,which are customer selection,Heat No,Lot No,Cast No. Here for storing purpose I used Sqlite Database.After filling the details of batch save it,when we save the batch then it will automatically creates a batch. After creating batch select the one batch from this window.
How to create the test methods?
Fig-6: Method adds or delete
1stly enter the test Id write the test method Name & write the
description of that test method & select the test type (Tensile, compression, flex etc.) & as we select the test type automatically results will be displayed in the result box according to that test type. Then select the results which we want and click on the add button. In this way test method is created.
Now the test which we have created can be controlled by the parameters as shown below.
How to control the test?
Fig-7: Control parameter
© 2017, IRJET | Impact Factor value: 5.181 | ISO 9001:2008 Certified Journal
| Page 1682
1st of all add the parameters by clicking the add newparameter
Now we will discuss the table step by step.
1)Step No.:- the step no is increased one by one when we add the parameter one by one.In each step we can set different parameters as we want.
2)variable/control:- Here we can choose any one of parameter either variable or control,if we select the variable then it selects the loop variable that we can use for looping and if we select control then we can set control action for the test.
3)Rate: Here we have to put value for rate for increament or decrement.
4)var type/Rate type: If we have selected parameter as a variable then this column is to set the variable that is loop var1, 2 or 3 and if the parameter is control then it is used to set rate type that which value(load, disp, strain) will be increased or decreased with the rate.
5)var value/target: If the parameter selected is variable the for the loop var we can assign any value from here and if the parameter selected is control then the target value we can set from here.
6)Target type: Here we can assign the type of the target that is load or displacement.
7)Action/Swtch condition: In this column we can set action if parameter is selected as variable and we can set switch condition if control is selected.Action for variable are assign value, decrement and JNZ and preload are provided. Switch conditions for control are target reached, break and yield.
8)Hold time: Each step will be hold for some time unit as provided in this column.
9)Jmp_stp_no.: After completion of each step the control is shifted to the step as provided in this column.
This is the Control console area
Load:
Extension:
Displacement:
How to fill the table?
1stly select parameter as variable. Then select any loop variable & at zero rate & assign the variable value to it in var value column.variable alue is nothing but the count of the loop that will assigned to the variable type. Then create second step and set parameter as control. Put value for rate, select rate type, select switch condition. If switch condition is target reached or yield then put value of target and select target type either load or displacement. When we select target type as load then test will stop on the load target value and when we select displacement then test will stop on displacement target. Like this we can create number of steps & we can control the test for rubber we can use the looping condition.The overall window for creating method is as shown below:
Fig-8: Method window Step 4:
After Setting data entry of the specimen then graph window will be displayed which is shown in the bellow:
© 2017, IRJET | Impact Factor value: 5.181 | ISO 9001:2008 Certified Journal
| Page 1683
Here we can chose the X & Y parameter for the graph.In X parameter we can select the following Contents:
Load
Disp
Stress
Strain
& In Y parameter we can select the following Contents:
Extension
Time
Tensile Extension
Compressive Extension
After selecting the X and Y parameters click on save button.
Step 5:
After Selecting the parameters start the test then the Graph will be displyed after test completion then automatically report will be displayed & this report we can save in pdf format or we can print also.
The report window is shown in fig.9 in which we can see all the details of the specimen & we can see the graph &results also. We can save this report as a pdf file or we can print report also.
Fig-10: Report window
3. RESULTS:
Fig-10: Output Graph
4. CONCLUSIONS
The improved GUI mentioned in project had been applied in Universal testing Machine and Control System, with good effect; it can reduce the difficulty of system development.
REFERENCES
[1] International Journal of Advanced Research in Computer
Science and Software Engineering On “Graphical User Interface Design Essentials & Process” By ReenaSainiDepartment of Computer Science and Engineering B. K. Birla Institute of Engineering & Technology, Pilani, Rajasthan, India
[2] 2010 2nd International Conference on Signal Processing
Systems (ICSPS) “GUI Design of Grain Monitoring and Control System Based on QT” By Zhang Qinghui College of Information Science and Engineering Henan University of Technology Zhengzhou, China
[3] www.Instron.com