© 2017, IRJET | Impact Factor value: 5.181 | ISO 9001:2008 Certified Journal | Page 3335
Assessment of Traffic Noise in Guwahati city, India
Md. Sayeedul Islam
1, Dr. Kalyan Kalita
2,
1
Research Scholar, Dept. Of Mechanical Engineering, Assam Engineering College, Guwahati, Assam, India
2Associate Professor, Dept of Mechanical Engineering, Assam Engineering College, Guwahati, Assam, India
---***---Abstract –
Assessment of noise is carried out to study thenoise pollution scenario of Guwahati city at different zones, i.e. commercial zones, residential zones and silence zones comprising educational institutions and hospitals and nursing homes. In the present investigation, traffic volume data and noise level data are collected simultaneously at all the identified study locations. Sound Level Meter is used for assessment of noise and manual count and video recording is used for classified traffic survey. From the study, it is observed that noise level scenario of Guwahati city is deteriorating and most of the locations are in the grip of higher noise level than the prescribed standards suggested by the by CPCB(Central Pollution Control Board ) and MoEF ( Ministry of Environment and Forest, Govt. of India. It is due to all types of crowded vehicles (private and public), narrow roads and poor traffic management. most of the hospitals, Nursing homes and educational institution premises are in the grip of higher traffic noise levels than the prescribed noise standards of 50 dB (A) and they are not safe from noise induced disturbances.
Key Words
:
Noise Level, dB (A), Sound Level meter (SLM), Commercial zone, Residential zone, Silence zone.1. INTRODUCTION
Noise is one of the most significant sources of environmental pollution in modern cities. It can be defined as an unpleasant and unwanted sound, which now becomes a serious threat to urban life.Noise is like a physical form of pollutants which does not harm directly to the life supporting system namely air, water and soil. But its effects are more directly on the receiver.i.e. human being [1].
The major cause of increasing noise is rapid urbanization, industrialization and population growth.Most of the Indian cities and towns like Visakhapatnam, Kolhapur, Asansole and Balasore have also been facing serious traffic noise pollution in last few decades due to substantial growth of new vehicles, low turnover of old vehicles, inadequate road network and urbanization [2-5]. Assessment of traffic noise level is difficult in Indian cities due to the heterogeneity in traffic and environmental conditions e.g., mixed vehicle types, congestion, road conditions, frequent honking and lack of traffic sense [6, 7]. Therefore, it is important to consider such diverse factors in monitoring and assessment of traffic noise level in the Indian context. Various studies carried out in India have shown that most of the cities are under the grip of high noise level than the standards prescribed by CPCB (Central Pollution Control Board ) and
MoEF ( Ministry of Environment and Forest, Govt. of India) [8-10]. The main objective of the present study is to assess the noise levels of Guwahati city at various locations, i.e. commercial zones, residential zones and silence zones particularly educational institutions, hospitals and nursing homes, due to vehicular traffic under heterogenic traffic conditions. For this purpose, classified traffic volume and noise level are measured at different locations on roadways. In this study, traffic volume is categorized in 2-wheelers, 3-wheelers, 4-wheelers and 6-wheelers & above. Noise levels are measured for Leq, Lmin, Lmax, L10, L50 and L90.
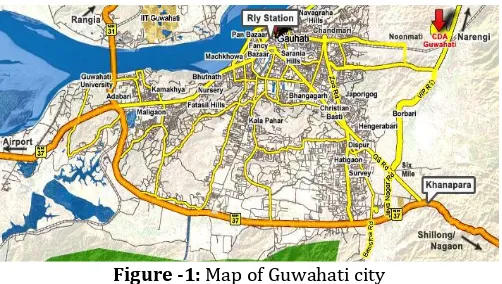
[image:1.595.309.560.358.500.2]2. Study Area
Figure -1: Map of Guwahati city
Guwahati is the capital city of the state Assam situated in the North Eastern part of India. Guwahati is the largest and fastest growing commercial, educational and industrial hub of the entire North East region. It was known by the name of “Gauhati” during British period. Geographically, Guwahati is situated along the River Brahmaputra and is bounded by the foot hills of the Shillong plateau in the southern side between 26005’ to 26015’N
Latitude and 91035’ to 91055’E Longitude. It is located on an
undulating plain with varying altitude of 49.5 m to 55.5 m above Mean Sea Level (MSL) (Guwahati Metropolitan Development Authority, 2006). Guwahati has a humid subtropical climate with semi dry in summer and cold in winter. The average maximum temperature is about 29.30C
in summers and average minimum temperature is about 19.10C.The average rainfall is1717.7 mm with average
© 2017, IRJET | Impact Factor value: 5.181 | ISO 9001:2008 Certified Journal | Page 3336 alone contributes 55% of the combined population of the
significant towns within the state (Source: Various issues of the Census India)[11].
[image:2.595.38.289.198.331.2]Guwahati has seen a rapid rise in population in the past few years. People from other parts of the state and the region migrate to the city chiefly for education and occupation.
Figure -2: Decadal Population Growth of Guwahati City
Source: Office of the Registrar General and Census Commission (web), Delimitation Commission of India
(web)
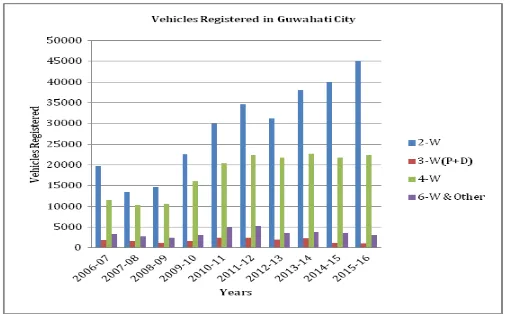
The traffic scenario of Guwahati city indicates a exponential increase of vehicles in the city road. The average of 71,824 vehicles entered and exited the city area at the outer cordon (OC) on an average day (GMDA, 2007).
Figure -3: Vehicles Registered in Guwahati City
Source: Office of the District Transport Officer, Kamrup (Metro)(R&L), Guwahati
3. Materials and Methodology:
The present study is carried out to assess the equivalent noise level (Leq ) and noise indices such as L10, L50
and L90 due to vehicular traffic in different zones like
residential, commercial and silence zones, particularly
educational institutions, hospitals and Nursing homes in the Guwahati city, state capital of Assam, India.
The methodology used for all study locations consists of
a) Monitoring and assessment of equivalent noise level (Leq) and noise indices L10, L50 and L90 at
different locations such as residential, commercial, silence zones.
b) Measurement of classified traffic volume along with measurement of noise equivalent levels (Leq) for
each study location.
c) Estimation and assessment of Noise Pollution Level (NPL) for all the study locations.
3.1.
Measurement of Traffic Noise Level and
Classified Traffic Volume:
[image:2.595.35.290.463.620.2]© 2017, IRJET | Impact Factor value: 5.181 | ISO 9001:2008 Certified Journal | Page 3337
Table 1: Ambient Air Quality Standards in respect of Noise in India
(Source: The Noise Pollution (Regulation and Control) Rules, 2000)
Type of Area Category of Area/Zone Limits in dB (A)(A) Leq
Day Time* Night Time**
A Industrial Area 75 70
B Commercial Area 65 55
C Residential Area 55 45
D Silence Area 50 40
* Day Time-6:00am to 10:00pm, ** Night Time- 10:00pm to 6:00am
3.2. Parameters Measured:
In this study, assessment of noise level is carried out in different zones of the study area including commercial, residential, silence area particularly educational institutions, hospitals and nursing homes.
4. Result and Discussion:
Present study reveals that the noise levels of Guwahati city in most of the places are higher than the standard prescribed by CPCB and BIS “ The Noise Pollution (Regulation and Control)Rules,2000”(Table-1). The noise scenario of the city is deteriorating with population growth, exponential increase of vehicles, lack of parking space, poor and narrow condition of roads and in appropriate traffic management.
4.1. Commercial Locations:
Figure - 4: Noise Levels (Leq) in some Commercial locations
in the Guwahati city
[image:3.595.309.560.263.409.2]From the noise survey, It has been observed that the variations of noise level, Leq in commercial locations of the city is ranged from 66.54 dB (A) to 80.81 dB (A) with standard deviation 3.25 ; 61.18 dB (A) to 77.24 dB (A) with S.D. 3.12 ; and 59.95 dB (A) to 78.24 dB (A) with S.D. 3.92 during 7:00 am to 10:00 am; 12:00 noon to 3:00 pm and 4:00 pm to 8:00 pm respectively. There is almost constant level of noise prolongs for day duration except two or three locations. The noise levels of all locations are above permissible limit 65 dB (A) except Silpukhuri site during 7:00 am to 8:00pm.This due to all types of crowded vehicles mostly commercial, narrow roads and poor traffic management.
Figure - 5: Noise Pollution Level (NPL) in some Commercial locations in the Guwahati city
Noise Pollution Level (NPL) gives an idea of noise pollution caused by fluctuating noise level. The average Noise Pollution Level (NPL) varies in the range of 78.68 dB (A) to 93.56 dB (A), 71.68 dB (A) to 88.82 dB (A) and 68.45 dB (A) to 92.19 dB (A) during 7:00 am to 10:00 am, 12:00 noon to 3:00 pm and 4:00 pm to 8:00 pm respectively
4.2. Residential Locations:
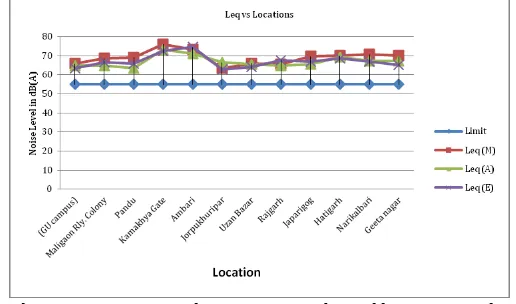
Figure - 6: Noise Levels in some Residential locations in the Guwahati city
[image:3.595.304.562.560.712.2] [image:3.595.35.294.576.730.2]© 2017, IRJET | Impact Factor value: 5.181 | ISO 9001:2008 Certified Journal | Page 3338 standard 55dB (A). Some of the residential locations situated
[image:4.595.306.563.80.254.2]nearby roadside show noise levels more than 70 dB (A).
Figure - 7: Noise Pollution Level (NPL) in some residential locations in the Guwahati city
The average Noise Pollution Level (NPL) of some residential area in the Guwahati city varies in the range of 77.29 dB (A) to 89.69 dB (A), 77.27 dB (A) to 85.59 dB (A) and 77.66 dB (A) to 87.85 dB (A) during 7:00 am to 10:00 am, 12:00 noon to 3:00 pm and 4:00 pm to 8:00 pm respectively.
4.3. Educational Institutions:
Figure - 8: Noise Levels in some Educational Institutions in the Guwahati city
[image:4.595.37.288.131.278.2]It has been observed that the variations of noise level, Leq in some educational institutions of the city is ranged from 48.68 dB (A) to 76.0 dB (A) with standard deviation 6.8 ; 53.23 dB (A) to 75.7 dB (A) with S.D. 5.7 ; and 53.54 dB (A) to 75.83 dB (A) with S.D. 6.8 during 7:00 am to 10:00 am; 12:00 noon to 3:00 pm and 4:00 pm to 8:00 pm respectively.
Figure - 9: Noise Pollution Level (NPL) in some educational institutions in the Guwahati city
The average Noise Pollution Level (NPL) in some educational institution premises in the Guwahati city varies in the range of 57.68 dB (A) to 91.6 dB (A), 62.73 dB (A) to 88.4 dB (A) and 64.74 dB (A) to 91.1 dB (A) during 7:00 am to 10:00 am, 12:00 noon to 3:00 pm and 4:00 pm to 8:00 pm respectively.
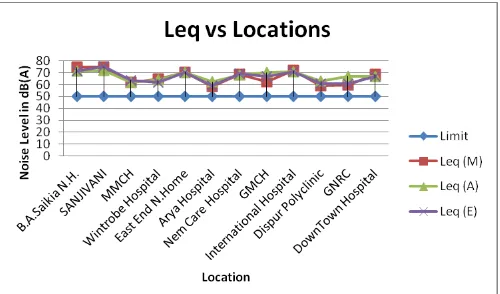
4.4. Hospitals and Nursing Homes:
Figure -10: Noise Levels in some Hospitals and Nursing Homes in the Guwahati city
[image:4.595.310.560.411.558.2] [image:4.595.35.290.425.584.2]© 2017, IRJET | Impact Factor value: 5.181 | ISO 9001:2008 Certified Journal | Page 3339
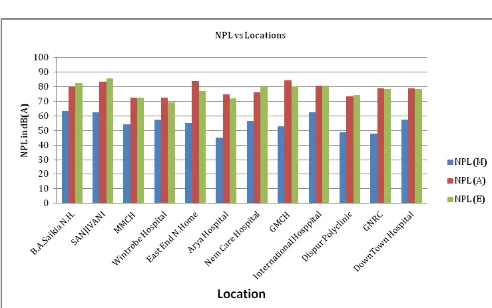
Figure - 11: Noise Pollution Level (NPL) in some hospitals and nursing home in the Guwahati city
The Noise Pollution Level (NPL) of some hospitals and nursing homes in the Guwahati city varies in the range of 45.1 dB (A) to 63.4 dB (A), 68.2 dB (A) to 90.4 dB (A) and 68.1 dB (A) to 89.1 dB (A) during 7:00 am to 10:00 am, 12:00 noon to 3:00 pm and 4:00 pm to 8:00 pm respectively.
Most alarming situation is with high noise levels in the silence zone of the city. According to “The Noise Pollution (Regulation and Control) Rules, 2000, the silence zone is an area comprising not less than 100 meters around hospitals and educational institutions. But from this study, it has been found that most of the hospitals, Nursing homes and educational institutions are established in either commercial places or nearby heavy traffic plying roads. Consequently, most of the hospitals, Nursing homes and educational institution premises are in the grip of higher traffic noise levels than the prescribed noise standards of 50 dB (A) and they are not safe from noise induced disturbances.
5. Conclusion:
The noise level assessment of the Guwahati city has explicitly revealed that the noise levels are more than the permissible limits in all the investigated sites. Moreover, it is clearly indicates that the vehicular traffic is one of the major contributors to noise in the city. It is due to exponential growth of vehicles, growing populations, lack of sufficient parking spaces, narrow roads and inappropriate traffic management. The health of city dwellers may be at high risk in the long run due to noise related diseases.
However, some remedial and preventive measures must be considered for betterment and improvement of noise environment of Guwahati city. Creating more parking spaces, broadening of linking roads, constructing noise barriers where is necessary, constructing flyovers and over bridges, strict enforcement of law and planting more trees in roadside for sound cushioning are a few of them.
REFERENCES
[1] Smriti Srivastava-“ Environmental Studies”
[2] Sagar VT, Rao NG. Noise pollution levels in
Visakhapatnam City (India).
[3] J Environ Sci Eng. 2006;48(2):139–42.
[4] Hunashal BR, Patil BY. Assessment of noise pollution
indices in the city of Kolhapur, India. Procedia Soc Behav Sci. 2012;37:448–57
[5] Banerjee D, Chakraborty KS, Bhattacharyya S,
Gangopadhyay A. Evaluation and analysis of road traffic noise in Asansol: an industrial town of eastern India. Int J Environ Res Public Health. 2008;5(3):165–71.
[6] Goswami S. Road traffic noise: a case study of Balasore town, Orissa, India. Int J Environ Res. 2009;3(2):309–16 Kalaiselvi R, Ramachandraiah A. A noise mapping study for heterogeneous road traffic conditions considering horn sounds. J Acoust Soc Am. 2011;129:2380.
[7] Vijay R, Sharma A, Chakrabarti T, Gupta R. Assessment of honking impact on traffic noise in urban traffic environment of Nagpur, India. J Environ Health Sci Eng. 2015. doi:10.1186/s40201-015-0164-4.
[8] Mohan, S., Dutta, N. and Sarai, S. M(2000), ‘ Subjective Reaction to Road traffic Noise of Resident Living in Delhi City’, Pollution Research, 19(3), pp 353-356. [9] Naik, S. and Purohit K. M. (1999), ‘ Traffic noise Pollution at Bondamunda of Rourkela Industrial Complex’, Pollution Research, 18(4), pp 475-478. [10] Gupta, A. and Chakraborty, R (2003), ‘An Integrated Assessment of Noise Pollution in Silchar, Assam, North –East India’, Pollution Research, 22(4), pp 495-499. [11] Wazir Alam, GIS based Assessment of Noise Pollution in Guwahati City of Assam, India, International
Journal of Environmental Sciences Volume 2, No 2, 2011, pp – 743 – 751.
[12] Central Pollution Control Board, Ministry of