Journal of Chemical and Pharmaceutical Research, 2014, 6(7):289-294
Research Article
CODEN(USA) : JCPRC5
ISSN : 0975-7384
Leverage effect analysis of Baltic dry index based on EGARCH model
Xing Yuwei*, Yu Shaoqiang, Fan Yonghui and Yang Hualong
Dalian Maritime University, China
_____________________________________________________________________________________________
ABSTRACT
The bulk shipping market is seasonal, cyclical and highly volatile. Due to the nonstationary and nonlinear nature of price series and the complexity of influencing factors, it is difficult to analyse the fluctuations in the bulk shipping market.Baltic dry index (BDI) has has been developed by the Baltic Exchange to reflect the overall fluctuation level of international dry bulk shipping market. Nowadays, BDI causes widespread concern by the shipping industry as well as the academic world about its characteristics and volatility. In this study, the EGARCH model was employed to analyze the leverage effect among the four kinds of BDI. The results of empirical analysis shows that all series of daily BDI rates of return have obviously leverage effects. For the Capesize and Panamax shipping markets, the leverage effects are positive, since good message on Capesize and Panamax shipping markets are greater than the bad news. For the Supramax and Handysize shipping markets, the leverage effects are negative. It indicates that effects of bad news on RBSI and RBHSI are greater than those of good news.
Key words: BDI; EGARCH model; Leverage effect; freight rate; freight rate of return
_____________________________________________________________________________________________
INTRODUCTION
Baltic dry index (BDI) has been developed by the Baltic Exchange to reflect the overall fluctuation level of international dry bulk shipping market. BDI is termed a leading economic indicator to international dry bulk shipping markets. According to the differences of ship sizes, the dry bulk shipping markets are divided into four types: Handysize, Supramax, Panamax and Capesize. Baltic Shipping Exchange issues the daily dry bulk shipping indexes of different ship sizes as Baltic Handy Size index (BHSI), Baltic Supramax index (BSI), Baltic Panamax index (BPI) and Baltic Capesize dry bulk shipping index (BCI). In recent years, due to the impacts of the factors such as international politics, economies, societies and supply-demand relationship, the violent fluctuation of BDI makes it difficult for dry bulk shipping stakeholders to make decisions. Consequently, researches of the
characteristics to the volatility of dry bulk shipping markets is of great importance to avoid the operation risks,both
in theories and practices.
G Bakshi, G Panayotov, G Skoulakis (2011) showed that the growth rate of the Baltic Dry Index has predictive ability for a range of stock markets, which is demonstrated through in-sample tests and out-of-sample statistics[6]. Jiang Y, Xiao J (2013) used the ARMA model on the signal Kalman filter based on the covariance intersection. Ye W (2013) used the optional combination model describing the results of nearly 16 Summer Olympics men's 110 meter hurdles the overall level of variation, and its development achievements prediction method for the optimum combination provided a new approach[7]. Koopmans T C. (1999) analyzed the cyclical fluctuations regarding the tanker freight rate and oil tanker construction as the object[8]. Okan Duru (2010) developed an improved fuzzy time series method via adjustment of the latest value factor and previous error patterns to forecast the dry bulk shipping index[9]. DR Glen (2006) provided an overview of the development of the quantitative modelling techniques that have been applied to the analysis of dry bulk shipping markets[10]. Engle,R.F. and V.K. Ng (1993) proved that the impact of asset markets exist asymmetric effects, namely Leverage effect[11]. Glen found that the larger tanker facing more risk than the smaller tanker. The risk management of the ship in time charter market is smaller than in the spot market[12].
Previous studies mostly described the volatility characteristics of BDI. While, the four dry bulk shipping markets react differently for the good news and the bad news. The inter-relationship among the four dry bulk shipping markets are referred to as leverage effect of BDI. In order to analysing the leverage effect among the four kinds of BDI in the dry bulk shipping market, the EGARCH model was proposed and empirical studies was also conducted by this paper. The outline of this paper is as follows. In the introduction section, the background of this study as well as a brief review of the previous literature is provided. The next section will give out the methodology data collection and processing. And then, the EGARCH model reflecting the leverage effect among the four kinds of BDI are presented and empirical analysis is conducted. Conclusions are given in the last Section.
DATA COLLECTION AND PROCESSING
BDI is a comprehensive index which consists of BCI (Baltic Capesize Index), BPI (Baltic Panamax Index), BHSI (Baltic Handysize Index) and BSI (Baltic Supramax Index). The 849 valid sample data are four kinds of price series BCI, BPI, BHSI, and BSI, which is from October 1, 2010 to February 27, 2014, acquiring from the shipping intelligence network Clarkson. The abscissa shows the number of data, and the ordinate represents freight index. The trend of four freight index is demonstrated clearly in figure 1(a)-(d). We can make preliminary judgments that the four types of index volatility are very large and unstable.
1,000 1,500 2,000 2,500 3,000 3,500 4,000 4,500
100 200 300 400 500 600 700 800 BCI
400 800 1,200 1,600 2,000 2,400 2,800
100 200 300 400 500 600 700 800 BPI
Fig.1(a) : Trend of BCI Fig1.(b) :Trend of BPI
300 400 500 600 700 800 900 1,000 1,100
100 200 300 400 500 600 700 800 BHSI
400 600 800 1,000 1,200 1,400 1,600 1,800 2,000
100 200 300 400 500 600 700 800 BSI
F
re
ig
h
t i
n
d
ex
F
re
ig
h
t i
n
d
ex
F
re
ig
h
t i
n
d
ex
F
re
ig
h
t i
n
d
ex
[image:2.595.61.515.424.725.2]To depict the freight index's volatility, we chooses freight rate of return as the research object. The freight rate of
return calculation formula is:
1
ln ln
t t t
R = P − P−
(1)
Among them,
P
t is the freight index,R
t is the freight index rate of return.In order to make the data more smoothly, we process four types of dry cargo freight rate index respectively of first order difference. Getting logarithmic one order difference of these data, the tendency of the freight index rate of return is shown in figure 2(a)-(d):
1,000 1,500 2,000 2,500 3,000 3,500 4,000 4,500
100 200 300 400 500 600 700 800 RBCI
-.08 -.04 .00 .04 .08 .12
100 200 300 400 500 600 700 800 RBPI
Fig.2(a) Trend of RBCI Fig.2(b) :Trend of RBPI
-.04 -.03 -.02 -.01 .00 .01 .02 .03 .04
100 200 300 400 500 600 700 800
RBHSI
-.10 -.08 -.06 -.04 -.02 .00 .02 .04
100 200 300 400 500 600 700 800
RBSI
Fig. 2(c)Trend of RBHSI Fig. 2(d):Trend of RBSI
To test the stationarity of the new data, we use the usual way of unit root test method. Thus, the ADF test method is used to judge where the rates of return have the unit root. The results are shown in table1 taking the lag of 20:
Table1 l unit root test of rate of return
RBCI RBPI RBHI RBSI ADF test value -13.22160 -9.773134 -6.917043 -7.990441 1%critical value -3.437856 -3.437856 -3.437856 -3.437846 5%critical value -2.864742 -2.864742 -2.864742 -2.864738 10%critical value -2.568529 -2.568529 -2.568529 -2.568527
As we can see from the table, the value of T test statistics is less than the corresponding critical value under 1%, 5%, and10%. We could conclude that RBCI, RBPI, RBHSI, RBSI is smooth, which is identical with the research of foreign scholars that financial asset price is usually fluctuant and the rate of return are generally smooth. Then basic statistical characteristics of RBCI, RBPI, RBHSI, RBSI are analysed by using Eviews, and the four basic statistical
characteristics of rate of return are shown in figure3(a)-(d):
R
B
C
I
R
B
P
I
R
B
H
S
I
R
B
S
I
Data/day Data/day
[image:3.595.68.516.197.510.2]0 40 80 120 160 200 240
-0.15 -0.10 -0.05 0.00 0.05 0.10
Series: RBCI Sample 1 849 Observations 848 Mean -0.000604 Median -0.002246 Maximum 0.131928 Minimum -0.173877 Std. Dev. 0.030607 Skewness -0.139357 Kurtosis 6.561520 Jarque-Bera 450.9279 Probability 0.000000
0 10 20 30 40 50 60 70 80 90
-0.050 -0.025 -0.000 0.025 0.050 0.075 0.100
Series: RBPI Sample 1 849 Observations 848 Mean -0.000901 Median -0.003287 Maximum 0.096331 Minimum -0.068338 Std. Dev. 0.024785 Skewness 0.771694 Kurtosis 4.554757 Jarque-Bera 169.5759 Probability 0.000000
Fig.3(a):Descriptive statistics of RBPI Fig.3(b):Descriptive statistics of RBPI
0 20 40 60 80 100 120 140
-0.0375 -0.0250 -0.0125 0.0000 0.0125 0.0250
Series: RBHSI Sample 1 849 Observations 848 Mean -0.000511 Median 0.000000 Maximum 0.033178 Minimum -0.036761 Std. Dev. 0.009077 Skewness -0.242201 Kurtosis 4.202387 Jarque-Bera 59.37339 Probability 0.000000
0 40 80 120 160 200
-0.08 -0.06 -0.04 -0.02 0.00 0.02 0.04
Series: RBSI Sample 1 849 Observations 848 Mean -0.000609 Median 0.000000 Maximum 0.037557 Minimum -0.088451 Std. Dev. 0.012973 Skewness -0.807084 Kurtosis 6.770228 Jarque-Bera 594.3123 Probability 0.000000
Fig.3(c):Descriptive statistics of RBHSI Fig. 3(d): Descriptive statistics of RBSI
As we can see the new data is disobedient to the standard normal distribution. These four rates of return series are typical of financial time series with spikes heavy-tailed characteristic. However, classical least square method assumes the errors are not related to series. It is a constant number, so classical least square method cannot be used in this analysis. We could use EGARCH model to analyze and process these data.
EGARCH MODEL AND EMPIRICAL ANALYSIS
Recent residuals have an effect on current residuals in a large number of financial time series, so the effects of variance are ignored when using the least-squares method. The traditional time series prediction method is no longer suitable for Heteroskedasticity sequence prediction research. EGARCH model was put forward by D. B. Nelson in the financial market research in 1991 on the basis of Generalized Autoregressive Conditional Heteroskedasticity (GARCH) model EGARCH model is an important extension of the GARCH model. It is an analysis of test data fluctuation to present the econometric method of non-stationary, considering the Leverage Effect. The selection of variables is based on the Normal distribution.
The EGARCH model are as follows:
2 2
1 1
ln ( ) ln 2
( ) [ E( )]
t t t
q p
t i t i j t j
i j
t t t t
g
g
ε
σ η
σ
ω
α η
β
σ
η
θη γ η
η
− − = = = = + + = + −
∑
∑
( )In practice, the middle equation of formula (2) could be simplified as:
2 2
1 1
ln ( ) ln
q p
t i t i
t i i j t j
i t i t i j
ε ε
σ ω θ γ β σ
σ− σ− −
= − − =
= +
∑
+ +∑
where
ε
t is the disturbance at t day, 21
| ~ ( 0 , )
t It N t
ε − σ ,
η
t is the white noise sequence (independent identically2
variances need a long period of time to disappear.
γ
reflects the impact of external shocks in the degree of pricevolatility in the financial markets. The impact of external shocks on the dry bulk market is asymmetric If
γ
≠
0
.If
γ
<
0
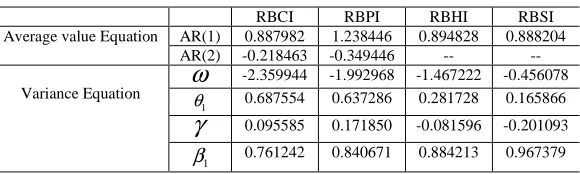
,it means the leverage effect is obvious. [image:5.595.163.453.191.278.2]The analysis of table 1 shows that the positive impact and negative impact on freight index rate of return are different from the same degree of shipping market impact. The examination results of parameters for EGARCH(1,1) model are in table 2:
Table 2 Examination Results of Parameters for EGARCH(1,1) model
RBCI RBPI RBHI RBSI Average value Equation AR(1) 0.887982 1.238446 0.894828 0.888204
AR(2) -0.218463 -0.349446 -- --
Variance Equation
ω
-2.359944 -1.992968 -1.467222 -0.456078
1
θ 0.687554 0.637286 0.281728 0.165866
γ
0.095585 0.171850 -0.081596 -0.2010931
β 0.761242 0.840671 0.884213 0.967379
We could obtain the regulation from EViews that the autocorrelation function is trailing and the partial autocorrelation function is truncated. As we can see from table 1, the RBCI and RBPI come into being AR(2) model, meanwhile RBHSI and RBSI are AR(1) model. It is easy to write the mean equation, the conditional variance
equation being obtained by the following parameters. Parameter
θ
1stands for the return coefficient. The larger theparameter is, the greater volatility of the market movements reflects. It means that the RBCI is more sensitive to the fluctuations in freight market than RBPI. While the RBHSI is close to RBSI, both of them are not sensitive than the
former two series. Parameter
β
1 stands for the lag coefficient, and the larger it is, the longer duration of thefluctuation continues. Though the continuity of the four groups of series is on the contrary. The duration of RBSI continues longer than other series. In other words it will take a long time for the RBSI to confont the impact on the conditional variances. By contrast the RBCI will spend less time in calming the fluctuations.
When the confidence level is set for 95%, the rates of return of four ship types have obviously leverage effect. In the shipping market, the bad news and the good news for freight index rate of return are different. For the Baltic Capesize ship and the Baltic Panamax ship, the parameters are positive. Samples in the information are not symmetrical, and leverage effect is significant, as a matter of fact that the effects of good message on Baltic Capesize shipping market are greater than the bad news. The Baltic Supramax ship and Baltic Handysize ship parameters are negative. It indicates that the market freight index affected by bad news is greater than the good news effect.
CONCLUSION
The four types of dry cargo freight rate index are regarded as sample data. After analyzing the basic statistical characteristics of these data, the rate of return does not conform to the normal distribution. Its characteristic feature has spikes and heavy tail, and the variance of the series changes as the time passing by, with the volatility clustering. After considering the leverage effect of dry cargo freight rate of return, we forecast dry cargo freight rate index by using Eviews. Foreign scholars studied Leverage effect on stock market earlier and more thoroughly , while domestic researchers paid less attention to it. In allusion to shipping market, academic research is more about dry bulk freight index volatility. So it is very necessary to study the leverage effect about the shipping market. Comparing actual data with predicted data under observation period, we find that EGARCH model is suitable for the prediction.
shipping market. We could improve the EGARCH model for the purpose of more accurately using in predicting the volatility of freight index.
Acknowledgments
The authors wish to thank the National Natural Science Foundation of China for contract 71372088.
REFERENCES
[1]Chou M T. A fuzzy time series model to forecast the BDI[C]//Networked Computing and Advanced Information
Management, 2008. NCM'08. Fourth International Conference on. IEEE, 2008, 2: 50-53.
[2]Manolis G. Kavussanos, Amir H.Alizadeh-M. Transportation Research, 2001.
[3]Lu J, Wei F, Chen Q H. Study on the fluctuant characteristics of freight index in world dry bulk shipping market
subdivided with ARCH model[A]. Proceedings of the 2006 IEEE/SMC International Conference on System of
Systems Engineering[C]. Los Angeles,CA,USA, 2006:368-373.
[4]Roar Adland, Kevin Cullinane . Transportation Research Part E , 2006, 42(3) :211-224.
[5]Alizadeh A H, Nomikos N K. Maritime Policy & Management, 2003, 30(4): 321-337.
[6]Bakshi G, Panayotov G, Skoulakis G. The baltic dry index as a predictor of global stock returns, commodity
returns, and global economic activity[C]//AFA 2012 Chicago Meetings Paper. 2011.
[7]Jiang Y, Xiao J. International Journal of Applied Mathematics and Statistics, 2013, 49(19): 351-358.
[8]Koopmans T C. Tanker Freight Rates and Tankship Building: An Analysis of Cyclical Fluctuations, by Dr. T.
Koopmans[M]. De erven F. Bohn nv, 1999.
[9]Duru O. Expert Systems with Applications, 2010, 37(7): 5372-5380.
[10]Glen D R. Maritime Policy & Management, 2006, 33(5): 431-445.
[11]Engle, R. F. and V.K. Ng. The Journal of Finance ,1993(48).
[12]Glen,D.R.,Martin,B.T. Maritime Policy and Management,1998, 25(2):117-128.