TITLE
A MODIFIED TECHNIQUE IN RFID NETWORKING PLANNING AND OPTIMIZATION
AZLI BIN NAWAWI
A thesis submitted in
fulfillment of the requirement for the award of the Doctor of Philosophy
Faculty of Mechanical and Manufacturing Engineering Universiti Tun Hussein Onn Malaysia
v
ABSTRACT
vi
using PSO and DOE combinations was tested against two variants of PSO. The comparison tests were done for all RNP scenarios and from the experiment results, the combination of PSO and DOE manages to perform better compared to other PSO variants in the test of objective function value eventhough not the fastest. As a conclusion, the proposed method (PSO and DOE combination) can be considered as a robust and efficient optimization system because it manages to generate high quality results in overall RNP scenarios. Additionally, the spread of the generated results is small.
vii
ABSTRAK
viii
keputusan yang dijana oleh proses pengoptimuman untuk setiap senario RNP akan dianalisa menggunakan perisian Minitab 16. Dalam sesi kedua DOE ini, penetapan optimum untuk setiap parameter PSO bagi setiap senario akan diketahui. Dari sini, penetapan umum bagi setiap parameter PSO juga telah diutarakan. Bagi proses validasi, proses pengoptimuman liputan tag RFID dengan penetapan parameter optimum (kombinasi PSO dan DOE) telah diuji dengan beberapa varian PSO yang lain. Hasil dari keputusan eksperimen, didapati kaedah pengoptimuman menggunakan gabungan PSO dan DOE berjaya menjana keputusan yang lebih baik bagi nilai fungsi objektif untuk setiap senario RNP walaupun bukan dalam masa yang terpantas. Kesimpulannya, kaedah pengoptimuman yang menggunakan kombinasi PSO dan DOE adalah cekap dan efisien kerana kaedah ini berpotensi untuk menjana keputusan-keputusan yang berkualiti tinggi bagi kesemua senario RNP. Selain itu, keputusan-keputusan yang dijana juga berada dalam julat yang rendah.
ix
CONTENTS
TITLE i
DECLARATION ii
DEDICATION iii
ACKNOWLEDGEMENT iv
ABSTRACT v
ABSTRAK vii
CONTENTS ix
LIST OF TABLES xv
LIST OF FIGURES xvii
LIST OF SYMBOLS AND ABBREVIATIONS xxiii
CHAPTER 1 INTRODUCTION 1
1.1 Challenges of Large Scale RFID Deployment 2 1.2 Parameter Tuning Weakness of PSO Algorithm 4
1.3 Research Objectives 5
1.4 Research Scopes S6
1.5 Thesis Organization 8
CHAPTER 2 LITERATURE REVIEW 9
x
2.2 Cellular Network Planning 11
2.2.1 The Importance of Cellular Network Planning 14 2.2.2 The Relation between Cellular Network and RFID
Technology 15
2.3 Radio Frequency Identification (RFID) System 18
2.3.1 RFID Equipments 18
2.4 The Horizon of RFID Technology 22
2.5 RFID Applications 25
2.5.1 RFID Application in Asset Tracking and
Management 28
2.6 RFID Network Planning 31
2.6.1 Trends in RNP 32
2.6.2 Tag Coverage 35
2.6.3 Reader Interference 36
2.6.4 RFID Tag Coverage Optimization 38
2.7 Particle Swarm Optimization (PSO) Algorithm 41 2.7.1 Advantages of Particle Swarm Optimization 44 2.7.2 Disadvantages of Particle Swarm Optimization 45 2.7.3 Applications of Particle Swarm Optimization 46
2.8 Related Works 49
2.8.1 Solving RNP using PSO Algorithm 49
xi
2.8.3 Design of Experiments (DOE) Implementations 56
2.9 Summary 59
CHAPTER 3 RESEARCH METHODOLOGY 62
3.1 Network Planning and Optimization Methodology 62 3.2 Preparation of RFID Tag Coverage Objective
Function 63
3.3 Parameter Tuning of PSO 65
3.4 Performance Comparison against Other PSO
Variants 68
3.5 Research Design 69
3.6 Summary 72
CHAPTER 4 CORRELATION BETWEEN RFID NETWORK
PLANNING (RNP) PARAMETERS AND PSO
SOLUTIONS 74
4.1. Identification and Elaboration of RFID Tag
Coverage Optimization Objective Function 76 4.1.1 Identification of Established Mathematical Model 76 4.1.2 Identification of RFID System Parameters 77 4.1.3 Exposing RFID System Parameters in Optimal Tag
Coverage Objective Function 77
4.1.4 Identification of the Dimensions for PSO Solutions 81 4.1.5 Identification of Representation System for PSO
xii
4.2 PSO Code Development in Matlab Environment 83 4.2.1 Preparing Pseudocode for PSO Algorithm 83
4.2.2 Coding PSO in Matlab Environment 84
4.2.3 Defining Working Area 85
4.2.4 Plotting a Graph in Matlab 86
4.2.5 Generating Random Numbers According to PSO
Requirements 90
4.2.6 Running PSO in Matlab 93
4.2.7 Script and Function m-files in Matlab 94
4.2.8 Saving a File in Matlab 95
4.2.9 Embedding the Elaborated Objective Function into
PSO Code 95
4.3 Verification of Matlab Code 97
4.4 Summary 98
CHAPTER 5 ESTABLISHMENT OF RNP SCENARIOS AND
DEVELOPMENT OF PSO-DOE INTEGRATION 100
5.1 Generating RNP Scenarios using DOE 101
5.2 RNP Scenarios Generated using DOE 102
5.3 Performing DOE Analysis on PSO results 108 5.3.1 Identification of Responses for DOE Analysis 111 5.3.2 Identification of Factors for DOE Analysis 112
xiii
5.3.4 Identification of Significance Parameters and Quantitative Effect and Optimum Setting for Each
Parameter 118
5.4 Optimum and General Settings of PSO Parameters 122
5.4.1 Pareto Chart of the Effects 123
5.4.2 Normal Plot of the Effects 129
5.4.3 Main Effects Plot and Optimum Settings of PSO
Parameters 136
5.4.4 General Settings of PSO Parameters 147
5.5 Summary 149
CHAPTER 6 RESULTS OF PERFORMANCE COMPARISON IN
RNP ENVIRONMENT 151
6.1 Performance Comparison as the Validation Process 151 6.2 Performance Comparison against Other PSO
Variants 155
6.2.1 Objective Function Value as Response 156
6.2.2 Simulation Runtime as Response 170
6.3 Summary 182
CHAPTER 7 CONCLUSION AND RECOMMENDATION 183
7.1 Conclusion 183
7.2 Contributions 186
7.2.1 Objective Function of RFID Tag Coverage
xiv
7.2.2 PSO and DOE Integration 187
7.2.3 Performance Comparison against Other PSO
Variants 188
7.3 Recommendations for Future Works 188
REFERENCES 191
APPENDIX 205
xv
LIST OF TABLES
Table 1.1: Name and range for each parameter 7
Table 2.1: The generations of cellular network 10
Table 2.2: RNP objectives from previous researches 32
Table 2.3: Application of PSO for solving RNP in previous researches 40
Table 2.4: Applications of PSO from 1995 to 2014 46
Table 2.5: Previous researches related to RNP optimization using PSO
algorithm 50
Table 2.6: The application of DOE for PSO parameter tuning 55
Table 2.7: List of related researches 57
Table 3.1: The minimum and maximum setting of each testing
parameter 67
Table 4.1: The measuring unit for each RFID system parameter 77
Table 4.2: Representation of PSO solution 82
Table 4.3: Representation of PSO solution 82
Table 4.4: Matlab generated random numbers for readers’ coordinates 91 Table 4.5: Random numbers for 3 readers and 5 particles 92 Table 4.6: Microsoft Excel template for verifying the PSO codes 98 Table 5.1: The lower and upper range of each RNP parameter for
performance comparison test 100
Table 5.2: Factors used for generating RNP scenarios using DOE 101 Table 5.3: Measurement unit used for each response 112
Table 5.4: List of factors for each DOE analysis 112
xvi
Table 5.6: Optimum setting for each PSO parameter for Scenario 1 137 Table 5.7: Optimum setting for each PSO parameter for Scenario 2
(Objective function value) 139
Table 5.8: Optimum setting for each PSO parameter for Scenario 3
(Objective function value) 140
Table 5.9: Optimum setting for each PSO parameter for Scenario 4
(Objective function value) 141
Table 5.10: Optimum setting for each PSO parameter for Scenario 5
(Objective function value) 143
Table 5.11: Optimum setting for each PSO parameter for Scenario 1
(Objective function value) 144
Table 5.12: Optimum setting for each PSO parameter for Scenario 7
(Objective function value) 146
Table 5.13: Optimum setting for each PSO parameter for Scenario 8
(Objective function value) 147
Table 5.14: Optimum settings for PSO parameters (Objective function
value) 148
Table 5.15: The general setting of PSO parameter for solving RFID
tag coverage optimization (Objective function value) 149 Table 6.1: Settings for PSO parameters for each variant of PSO used
xvii
LIST OF FIGURES
Figure 2.1: Various types of methods are available for cellular network planning (Laiho and Wacker, 2001; Laiho,
Wacker, and Novosad, 2006; Mishra, 2004) 12
Figure 2.2: The Electromagnetic Spectrum (LASP) 17
Figure 2.3: RFID System Components (Elshayeb, Hasnan, and Yen,
2009) 19
Figure 2.4: Classification of RFID Readers (Karmakar, 2010) 21 Figure 2.5: Flexible antenna RFID tags and crew bag with tagged
items inside (P. Brown, et al., 2007) 26
Figure 2.6: NASA version of RF SAW Model 704 Reader (shown
with PDA) (P. Brown, et al., 2007) 27
Figure 2.7: Publications related to PSO per year (Scholar, 2014) 44 Figure 2.8: General methodology for performing RNP optimization
(Hanning Chen and Yunlong Zhu, 2008; Chen, et al.,
2011; Y.-J. Gong, et al., 2012; Guan, et al., 2006) 54 Figure 2.9: The generic method for performing DOE analysis 59
Figure 3.1: A generic network planning diagram 63
Figure 3.2: Stages for preparing the objective function and the codes 65 Figure 3.3: DOE is used for defining the parameter tuning of PSO 66 Figure 3.4: 2 DOE sessions were proposed to perform the parameter
tuning for all RNP scenarios within the scopes 68
Figure 3.5: The performance comparison stage 69
xviii
Figure 4.1: Methodology flowchart for the first research objective (Identification and elaboration of RFID tag coverage
optimization objective function) 75
Figure 4.2: Radiation pattern of an isotropic radiator 78 Figure 4.3: Working area for RNP: 30m x 30m and 100 RFID tags
scattered randomly 85
Figure 4.4: A graph showing locations of 100 tags in the working area
of 1m x 1m 87
Figure 4.5: Locations of 100 randomly distributed tags in a 30m x
30m working area 88
Figure 4.6: 100 tags and 10 readers in the same graph (working area) 90 Figure 5.1: RNP scenarios generated by the first session of DOE 101 Figure 5.2: Scenario 1 (1 Reader, 100 Tags and 5m x 5m Working
Space Area). The unit of the X and Y axis is Centimeter
(cm) 102
Figure 5.3: Scenario 2 (10 Reader, 10 Tags and 30m x 30m Working Space Area). The unit of the X and Y axis is Centimeter
(cm) 103
Figure 5.4: Scenario 3 (1 Reader, 10 Tags and 5m x 5m Working Space Area). The unit of the X and Y axis is Centimeter
(cm) 104
Figure 5.5: Scenario 4 (1 Reader, 10 Tags and 30m x 30m Working Space Area). The unit of the X and Y axis is Centimeter
(cm) 105
Figure 5.6: Scenario 5 (10 Readers, 100 Tags and 30m x 30m Working Space Area). The unit of the X and Y axis is
Centimeter (cm) 106
Figure 5.7: Scenario 6 (10 Readers, 10 Tags and 5m x 5m Working Space Area). The unit of the X and Y axis is Centimeter
xix
Figure 5.8: Scenario 7 (10 Readers, 100 Tags and 5m x 5m Working Space Area). The unit of the X and Y axis is Centimeter
(cm) 107
Figure 5.9: Scenario 8 (1 Reader, 100 Tags and 30m x 30m Working Space Area). The unit of the X and Y axis is Centimeter
(cm) 108
Figure 5.10: Methodology flowchart for the integration of PSO and
DOE 110
Figure 5.11: Initial step for creating factorial design in Minitab 16 114 Figure 5.12: GUI for selecting the type of design and setting the
number of factors 115
Figure 5.13: Design catalog from Minitab 16 116
Figure 5.14: GUI for choosing the design of experiment (Full factorial
is chosen in the figure) 117
Figure 5.15: GUI for entering the name and levels for each factor 117 Figure 5.16: An example of Pareto chart generated by Minitab
software 119
Figure 5.17: An example of normal effects plot chart generated by
Minitab software 120
Figure 5.18: An example of main effects plot generated by Minitab
software 121
Figure 5.19: An example of interaction plot chart generated by
Minitab software 122
xx
Figure 5.27: Pareto chart for the objective function value of Scenario 8 129 Figure 5.28: Normal plot effects for the objective function value of
Scenario 1 129
Figure 5.29: Normal plot effects for the objective function value of
Scenario 2 130
Figure 5.30: Normal plot effects for the objective function value of
Scenario 3 131
Figure 5.31: Normal plot effects for the objective function value of
Scenario 4 132
Figure 5.32: Normal plot effects for the objective function value of
Scenario 5 133
Figure 5.33: Normal plot effects for the objective function value of
Scenario 6 134
Figure 5.34: Normal plot effects for the objective function value of
Scenario 7 135
Figure 5.35: Normal plot effects for the objective function value of
Scenario 8 136
Figure 5.36: Main effects plot for the objective function value of
Scenario 1 136
Figure 5.37: Main effects plot for the objective function value of
Scenario 2 138
Figure 5.38: Main effects plot for the objective function value of
Scenario 3 140
Figure 5.39: Main effects plot for the objective function value of
Scenario 4 141
Figure 5.40: Main effects plot for the objective function value of
Scenario 5 142
Figure 5.41: Main effects plot for the objective function value of
Scenario 6 144
Figure 5.42: Main effects plot for the objective function value of
xxi
Figure 5.43: Main effects plot for the objective function value of
Scenario 8 146
Figure 6.1: Methodology flowchart for the performance comparison between PSO and DOE combination with other variants of
PSO) 152
Figure 6.2: An example of individual value plot generated by Minitab
software 154
Figure 6.3: An example of Boxplot chart generated by Minitab
software 155
Figure 6.4: Individual value plot for the objective function value of
Scenario 1 157
Figure 6.5: Boxplot for the objective function value of Scenario 1 157 Figure 6.6: Individual value plot for the objective function value of
Scenario 2 158
Figure 6.7: Boxplot for the objective function value of Scenario 2 159 Figure 6.8: Individual value plot for the objective function value of
Scenario 3 160
Figure 6.9: Boxplot for the objective function value of Scenario 3 161 Figure 6.10: Individual value plot for the objective function value of
Scenario 4 162
Figure 6.11: Boxplot for the objective function value of Scenario 4 163 Figure 6.12: Individual value plot for the objective function value of
Scenario 5 164
Figure 6.13: Boxplot for the objective function value of Scenario 5 164 Figure 6.14: Individual value plot for the objective function value of
Scenario 6 165
Figure 6.15: Boxplot for the objective function value of Scenario 6 166 Figure 6.16: Individual value plot for the objective function value of
Scenario 7 167
xxii
Figure 6.18: Individual value plot for the objective function value of
Scenario 8 168
Figure 6.19: Boxplot for the objective function value of Scenario 8 169 Figure 6.20: Individual value plot for the simulation runtime of
Scenario 1 170
Figure 6.21: Boxplot for the simulation runtime of Scenario 1 171 Figure 6.22: Individual value plot for the simulation runtime of
Scenario 2 172
Figure 6.23: Boxplot for the simulation runtime of Scenario 2 172 Figure 6.24: Individual value plot for the simulation runtime of
Scenario 3 173
Figure 6.25: Boxplot for the simulation runtime of Scenario 3 173 Figure 6.26: Individual value plot for the simulation runtime of
Scenario 4 174
Figure 6.27: Boxplot for the simulation runtime of Scenario 4 175 Figure 6.28: Individual value plot for the simulation runtime of
Scenario 5 176
Figure 6.29: Boxplot for the simulation runtime of Scenario 5 177 Figure 6.30: Individual value plot for the simulation runtime of
Scenario 6 178
Figure 6.31: Boxplot for the simulation runtime of Scenario 6 179 Figure 6.32: Individual value plot for the simulation runtime of
Scenario 7 180
Figure 6.33: Boxplot for the simulation runtime of Scenario 7 180 Figure 6.34: Individual value plot for the simulation runtime of
Scenario 8 181
Figure 6.35: Boxplot for the simulation runtime of Scenario 8 181 Figure 7.1: Implementation of 2 DOE sessions on the RFID tag
xxiii
LIST OF SYMBOLS AND ABBREVIATIONS
RFID - Radio Frequency Identification RNP - RFID Network Planning PSO - Particle Swarm Optimization DOE - Design of Experiments GA - Genetic Algorithm
UTHM - Universiti Tun Hussein Onn Malaysia ANN - Artifical Neural Networks
DE - Differential Evolution IT - Information Technology ISS - International Space Station SAW - Surface Acoustic Waves GPS - Global Positioning System QoS - Quality of Service
IDENTEC - An RFID solution provider SDK - Software Development Kit RGA - Real-code Genetic Algorithm ES - Evolution Strategy
SA-ES - Self Adaptation Evolution Strategy CPSO - Canonical Particle Swarm Optimization
xxiv
Pt - Transmitted (reader) power Gt - Transmitter(reader) antenna gain Gr - Receiver (tag) antenna gain
D - Distance between transmitter and receiver
Λ - Radio wavelength
- Number of tags
- Received power at each tag (dBm)
- Threshold power (minimum power to start communication) (dBm)
- Comparison between antenna gain and isotropic radiator
- Comparison between antenna gain and reference dipole
- Spectrum power
- Tag effective power reflection coefficient - Transmitter (tag) transmit power
- Transmitter (tag) antenna gain - Receiver (reader) antenna gain
- Path-loss for the distance between reader and tag - Number of readers
- Function to compute distance
- Positions of ith and jth reader respectively
- Interference range of ith and jth reader respectively
- Readers interference at point
- All tag read test points in the working area
- Signal strength at receiver (tag) from the desired reader
- Signal strength at receiver (tag) from other reader, Reader j
- Sensitivity threshold
xxv
- Current velocity
- Random variable (0 to 1) - Cognitive weight
- Personal best known position
- Current position - Social weight
- Global best known position
- New position
AMPS - Advanced Mobile Phone System FDMA - Frequency Division Multiple Access Mobitex - A wireless network architecture DataTAC - A wireless data network technology NMT - Nordic Mobile Telephone
TACS - Total Access Communication System CDMA - Code Division Multiple Access
GSM - Global System for Mobile Communication IDEN - Integrated Digital Enhanced Network PCS - Personal Communication Service TDMA - Time Division Multiple Access GPRS - General Packet Radio Service HSCSD - High-Speed Circuit-Switched Data EDGE - Enhanced Data for Global Evolution
WiDEN - Wideband Integrated Digital Enhanced Network UMTS - Universal Mobile Telecommunications System WCDMA - Wideband Code Division Multiple Access LTE - Long Term Evolution
1CHAPTER 1
7INTRODUCTION
RFID is very magical. These words were quoted from Dr. Bill Hardgrave, the founder of the RFID Research Center at the University of Arkansas. The center had a strong collaboration with Wal-Mart, the first company to implement RFID in a large scale. Dr. Hardgrave strongly believes that RFID will be used during the direct checkout of any retailer and the customers can do the purchase with using only the mobile phones or kiosks (Bustillo, 2010; Delen, Sharda, and Hardgrave, 2011).
Fortunately, his vision managed to become a reality in various retailers located in the United States of America and some European countries. Additionally, RFID is also widely used in the supply chain and production processes in various industries (S. A. Ahson and Ilyas, 2010; Bolic, Simplot-Ryl, and Stojmenovic, 2010). The application of RFID technology in the supply chain was steadily increased and the need to detect assets in a large area is becoming essential. This scenario applies in the automated inventory management system and product receiving (Qiang, Yu, Yiping, and Wenshneg, 2006). The increasing trend of RFID deployment is due to the reduced cost of the equipments and the established global standard that applies to most RFID systems. This is the result from years of extensive researches.
2
system can be used in various processes such as shipping and receiving, warehousing, retail outlet and inventory management. As for the inventory management, RFID system is deployed for the asset recall and return management. In addition, RFID system is also deployed by airline industries for tracking baggage (Brown, Patadia, and Dua, 2007). From here, it can be concluded that the statement from Dr. Hardgrave is true.
1.1 Challenges of Large Scale RFID Deployment
An increasing number of companies start to deploy RFID technology in a large scale. This is a sign that the cost of RFID technology has become more affordable for most companies. After years of RFID industrial debut, the cost of passive tag is continuously decreased and fall into the ‘comfort zone’ of many companies and firms. In addition, the sensitivity of the chip in the RFID tag is also improving. After years of technological enhancement, RFID technology offers a much better coverage and enhanced readability. One example of a large scale RFID success story is the METRO Group (S. A. Ahson and Ilyas, 2010; Polycarpou, et al., 2012). Upon deploying the RFID system, this company enjoyed various benefits such as the reduction in labor, time savings, efficient handling process and reducing out-of-stock (Polycarpou, et al., 2012).
RFID technology is an established technology and the equipments of RFID are mostly ready for industrial applications. To deploy this technology in a small scale is relatively simple because the complexity of the system is still at the ‘manageable’ level. However, as mentioned before, most corporations and companies tend to deploy the system in a large scale. This means that the number of RFID equipments (reader, tag, antenna, middleware and others) is relatively huge. In other words, the complexity of the RFID system is increasing because of the significant needs for deploying a huge number of RFID readers without issues.
3
tag coverage, readers collision avoidance, cost efficiency and good load balance (Ben, Wong, Yujuan, and Li, 2009; I. Bhattacharya and U.K. Roy, 2010; H. Chen and Y. Zhu, 2008; Chen, Zhu, and Hu, 2010; Chen, Zhu, Hu, and Ku, 2011; Di Giampaolo, Forni, and Marrocco, 2010; Y. Gong, Shen, Zhang, Chen, and Zhan, 2011; Leong, Ng, and Cole, 2005, 2006; Lin and Lin, 2007; Qiang, et al., 2006; Yahui, Yujie, Min, and Zhijing, 2009). These challenges formed a new branch of knowledge named RFID Network Planning (RNP). RNP is very crucial before deploying an RFID system because RNP focuses on solving the challenges mentioned above.
A good RNP solution will optimize the RFID system and minimize the system interference to other RF systems in the surroundings (Leong, et al., 2006). It will also ensure an acceptable Quality of Service (QoS) by minimizing the interference between RFID readers (Qiang, et al., 2006). According to Chen, Zhu et al (2010), RNP problems need to be solved before installing RFID system in order to make sure the system operate optimally.
From the literature, RNP is a multi objective optimization function and the solution is in the form of the best location and power setting for each reader. As a result, in order to determine the best locations for readers those satisfy RNP challenges mentioned above, Nature Inspired Algorithms were employed (Genetic Algorithm, Bacteria Foraging Algorithm and Particle Swarm Optimization Algorithm) (Indrajit Bhattacharya and Uttam Kumar Roy, 2010).
4
1.2 Parameter Tuning Weakness of PSO Algorithm
PSO algorithm is an optimization technique that is based on a population system. This algorithm is inspired by the movement of birds and fishes in their own groups (Kennedy and Eberhart, 1995).
PSO also owns several advantages compared to Genetic Algorithm (GA) such as faster speed, easier to implement and fewer parameters to be adjusted (Chamaani, Mirtaheri, Teshnehlab, and Shooredeli, 2007; Khare and Rangnekar, 2012; Mei-Ping and Guo-Chang, 2004). According to Eberhart (2001), PSO is also considered as conceptually simple, easy to use and effectively works on various optimization problems (Eberhart, Shi, and Kennedy, 2001). PSO is also easy to modify/alter in order to fulfill different needs. This is due to the less number of parameters to be considered.
Although PSO is considered as an established optimization algorithm, it does not have the parameter tuning that fits all optimization problems. The PSO’s parameters that require a proper tuning are the number of iterations, number of swarms, inertia weight value and correction factor value (El-Gallad, El-Hawary, Sallam, and Kalas, 2002; Kramer, Gloger, and Goebels, 2007). In some optimization problem, these parameters need to be set to the optimum value in order to get the best result (Beielstein, Parsopoulos, and Vrahatis, 2002).
The issue of parameter tuning weakness will worsen if PSO is used to optimize the RFID tag coverage. This is due to the fact that the RFID tag coverage optimization is a very complex optimization problem due to the high dimensional characteristic. Besides the parameter of PSO, the optimization problem also has several parameters to be considered such as the number of tags, number of readers and working space area.
5
In the parameter tuning process, any slight changes to the parameters will affect the end results greatly. This kind of uncertainty should not have bothered a highly complex system such as the RFID system. As a result, prospective companies and corporations are in urgency to have a reliable RFID planning system.
In order to enhance the parameter tuning of PSO, this research tends to propose a novel parameter tuning method. This method will improve the reliability and accuracy of PSO algorithm for the purpose of optimizing the RFID tag coverage. To do that, a number of research questions need to be taken into account. The research questions are as follows:
1) How to prepare an objective function to be optimized by the PSO algorithm? 2) What is the best parameter tuning for PSO in optimizing the RFID tag
coverage?
3) Is there any parameter tuning of PSO that fit all RNP conditions? 4) What are the significant parameters of PSO?
5) How to quantify the value of parameter significance in PSO?
These questions can be considered as the guidance to develop the novel parameter tuning method for PSO algorithm. This method should be applicable to all RNP conditions.
1.3 Research Objectives
This research comprises of several objectives:
6
ii. To justify the best parameter tuning of PSO for solving RFID tag coverage optimization in all RNP conditions.
iii. To evaluate the performance of the proposed method against other PSO variants.
1.4 Research Scopes
This research consisted of several scopes:
i. In this research, the type of RFID tag in used was RFID passive tag. This kind of tag has no internal power source and it is powered by radio waves from readers. The type of antenna used is an isotropic radiator antenna. ii. To represent all RNP conditions, several case studies (scenarios) were used.
These scenarios are within a given scopes (refer Chapter 5).
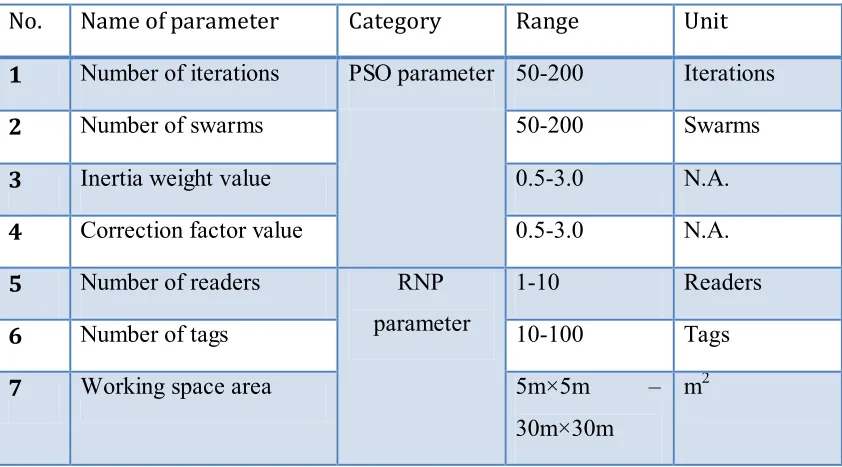
iii. This research covers two categories of parameters: PSO and RNP parameters. Additionally, these parameters are set in a specific range. The name and range of each parameter can be seen in Table 1.1.
iv. The correction factor value (refer Table 1.1) represents two variables: Cognitive weight and Social weight. In this research, the values for both variables are set as equal. As a result, the value of the correction factor represents the values of both variables.
v. The RFID application focuses in this research was asset tracking and management. All readers are activated all the time in order to track tagged assets. The tagged assets are located around a working area. Due to that, all readers needed to be deployed in order to track the locations of tagged assets in a real time manner.
7
vii. This research uses the original version of PSO algorithm because this version is deemed suitable for all optimization fields (Beielstein, et al., 2002; Y.-J. Gong, et al., 2012). Additionally, by choosing the original version of PSO, this research acts as a starting point for using 2 DOE session in PSO. Although there are a lot of PSO variants produced by other researchers, the author tends to choose the original version because there is no guarantee that the other PSO variants can perform better compared to the original PSO in the field of RFID tag coverage optimization. According to the author’s best knowledge, every PSO variant is developed for a particular usage and for now, the original version of PSO is the most suitable.
viii. Matlab software was used for writing the code and running the simulation. Prior to code writing in Matlab, a pseudo code of PSO algorithm were written.
[image:29.596.110.531.442.676.2]ix. Minitab 16 software was used for performing DOE analysis and generating some useful graphs.
Table 1.1: Name and range for each parameter
No. Name of parameter Category Range Unit
1 Number of iterations PSO parameter 50-200 Iterations
2 Number of swarms 50-200 Swarms
3 Inertia weight value 0.5-3.0 N.A.
4 Correction factor value 0.5-3.0 N.A.
5 Number of readers RNP
parameter
1-10 Readers
6 Number of tags 10-100 Tags
7 Working space area 5m×5m –
30m×30m
8
1.5 Thesis Organization
In this chapter, brief introductions about Radio Frequency Identification (RFID) technology, RFID network planning (RNP) and Particle Swarm Optimization (PSO) algorithm were discussed. The parameter tuning weakness of PSO was also elaborated. Moreover, additional information about this research such as the research objectives and scopes were also highlighted.
In the next chapter, some theories and significant contributions will be discussed that related to the RFID, RNP, RFID tag coverage optimization, Particle Swarm Optimization (PSO) and Design of Experiment (DOE). Additionally, any related studies that are significance to this research are also discussed.
The third chapter covers the general research methodology. In this chapter the processes for developing the research methodology are explained. The research flowchart with a greater level of details is also provided.
In the fourth chapter, the methodology for constructing the objective function of RFID tag coverage optimization is properly discussed. Additionally, the steps for developing the Matlab codes are also presented.
The integration between PSO and DOE is explained in the fifth chapter. This chapter will also discuss the parameter tuning method that is applicable to all RNP conditions.
The performance of the proposed method was measured in Chapter 6. This chapter is also considered as the chapter for the results and discussion. The performance comparison is also considered as the validation process.
Finally, the final chapter provides a conclusion for this research and some recommendations for future works. Moreover, the contributions made by this research will also be highlighted
2CHAPTER 2
LITERATURE REVIEW
This chapter focuses on the important theories and knowledge related to the research topics such as the cellular network planning, RFID technology, RFID Network Planning (RNP), RFID Tag Coverage Optimization, Particle Swarm Optimization (PSO) algorithm and Design of Experiment (DOE) technique. Also presented are the related works and models that are strongly related to this research. The critical findings in this chapter will be used as the foundation for developing the research methodology.
2.1 Introduction to Cellular Network
A cellular network is a mobile network that is used to provide services from the base stations to the subscribers. The base stations have a limited power supply and they can only cover a limited geographical area. This area is also known as a cell. Since the base station owns a limited power, a concept of frequency reuse can be applied without causing any interference between the transmitters. The cellular network system is suitable for a radio wave related application with limited frequency resources (Laiho-Steffens, Wacker, and Aikio, 2000; L. Song and Shen, 2010; Wallace and Walton, 1994).
10
large geographical area. From here, any mobile devices such as mobile phones and pagers are able to establish the connection (communicate) with each other (Byoung-Seong, Jong-Gwan, and Han-Kyu, 2002; Fasbender, Reichert, Geulen, Hjelm, and Wierlemann, 1999).
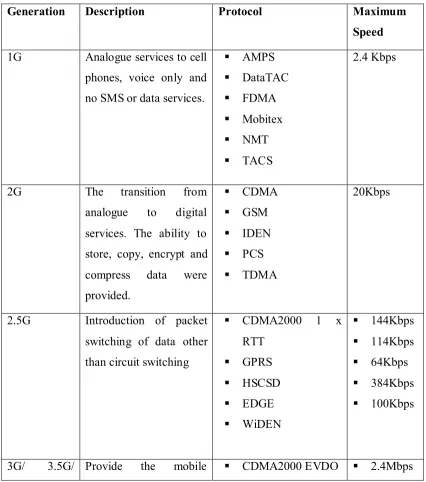
[image:32.596.107.533.291.773.2]The cellular network is improved from time to time. As a result, this network has a lot of generations (refer Table 2.1). Any ascending generation provides a faster connection and the ability to transfer a bigger amount of data (Hämäläinen, 2008b; Mishra, 2004).
Table 2.1: The generations of cellular network
Generation Description Protocol Maximum
Speed
1G Analogue services to cell phones, voice only and no SMS or data services.
AMPS DataTAC FDMA Mobitex NMT TACS 2.4 Kbps
2G The transition from
analogue to digital services. The ability to store, copy, encrypt and compress data were provided. CDMA GSM IDEN PCS TDMA 20Kbps
2.5G Introduction of packet switching of data other than circuit switching
CDMA2000 1 x RTT GPRS HSCSD EDGE WiDEN 144Kbps 114Kbps 64Kbps 384Kbps 100Kbps
11
3.75G broadband access to smart phones and modem
CDMA2000 EVDV
UMTS
WCDMA
CDMA2000/ EVDO-Rev A
2.4Mbps
2Mbps
2Mbps
3.1Mbps
4G Provide faster mobile broadband access to smart phones and modem
LTE
WiMAX
100Mbps
128Mbps
The cellular network is deployed in a very large geographical area. This network is also very synonym to the extremely large scale deployment. As a result, the planning and optimization of cellular network is a topic that may not see any end. This is due to the fact that the parameters for the planning process keep changing and expanding such as the number of subscribers, the density of transceivers, the speed of packet data and the introduction of new cellular generations that will never be stopped (Amaldi, Capone, Malucelli, and Mannino, 2006; Elkamchouchi, Elragal, and Makar, 2007).
2.2 Cellular Network Planning
Cellular network planning is crucial for obtaining the sufficient network coverage. It can also offers a mobile network service with an acceptable Quality of Service (QoS). The quality of voice and data services manage to fulfill the expectation of subscribers and the network providers will be able to maintain their market share.
12
whole system (Byoung-Seong, et al., 2002; A. Wacker, Laiho-Steffens, Sipila, and Jasberg, 1999).
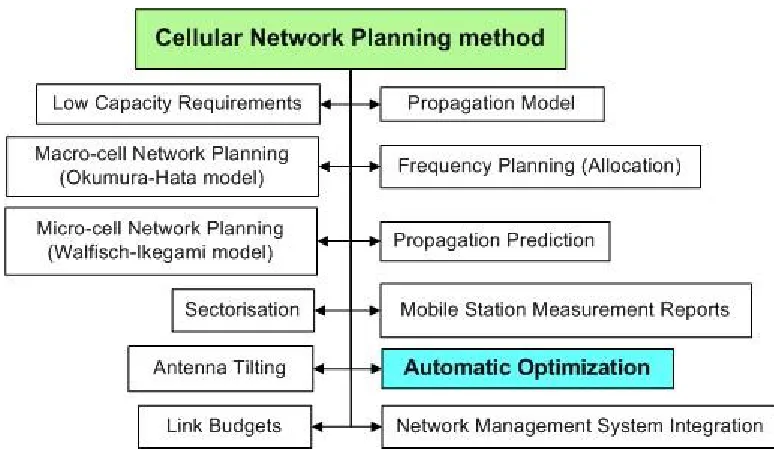
[image:34.596.124.511.307.532.2]The cellular network planning is also considered as a highly complex process. The planned network’s infrastructure should be flexible in order to cater the future demand of a faster data transfer. This is due to the fact that the number of subscribers and coverage area will keep expanding. A good network planning will yield an infrastructure that is easy to maintain and expand. Additionally, in order to fulfill certain demands, an excellent network infrastructure will need fewer modifications to be made to the existing infrastructure (Tutschku, 1998; Wallace and Walton, 1994). The methods for performing cellular network planning are shown in Figure 2.1.
Figure 2.1: Various types of methods are available for cellular network planning (Laiho and Wacker, 2001; Laiho, Wacker, and Novosad, 2006; Mishra, 2004)
13
The Okumura-Hata model is still in use for planning the macro-cell network. There are certain enhancement made by the previous researchers in order to made the model accepted in a better way (Castro, Gomes, Ribeiro, and Cavalcante, 2010; Priya, 2010). As a result, this model is compatible with the 3G network.
In the Walfisch-Ikegami model, the main assumption is the transmitter’s antenna is located on a rooftop and the radio wave is transmitted in multiple directions. This assumption is crucial for minimizing the traffic density. This model also utilizes the path loss formulation from the Walfisch-Bertoni model (Har, Watson, and Chadney, 1999; Laiho, et al., 2006). In the Walfisch-Ikegami model, the parameters in consideration are the height of buildings and the distances between buildings. Moreover, this model also considers additional factors such as the used frequency, street orientation and antenna’s height (Rozal and Pelaes, 2007).
The sectorisation method is able to reduce the interference between transmitters (base stations). The issue related to the signal interference becomes more prominent as the increasing number of subscribers in the 2G network yielded a higher site density. The sectorisation method is able to yield a denser environment of frequency reuse. This is possible because the omni-directional antenna in the base station is replaced with three sector antennas with 120° opening. Each antenna formed a new sector and each sector can be considered as a new cell. Moreover, each sector can be set with its own frequency. Sectorisation is also cost effective because it does not need the construction of a new base station (Achim Wacker, Laiho-Steffens, Sipila, and Heiska, 1999; S.-W. Wang and Wang, 1993).
Link budget is the analysis to be performed before commencing the network planning process. The link budget formulation is related to the magnitude of signal strength. Moreover, this method is still in use until today. In the link budget analysis, the parameters of interest are the receiver sensitivity, path loss, noise, antenna loss and cable loss. Additionally, the gains and losses from the transmitter is also calculated (Hämäläinen, 2008a; Nuza and Mazrekaj, 2012).
14
inputted into the planning tool. At the end of the analysis, the C/I and C/A plots are generated for the result checking and fault detection processes (Elayoubi, Ben Haddada, and Fourestié, 2008; L.-C. Wang, Stuber, and Lea, 1997).
In order to improve the spectrum efficiency in GSM and saving some analysis time, the automatic frequency planning system was introduced. Moreover, the cellular network planning can also be done using the mobile station measurement reports. The reports are useful for assisting the network control process such as the planning and optimization stages (Barco, Canete, Diez, Ferrer, and Wille, 2001; Wille and King, 1998).
One of the most recent methods in cellular network planning is the automatic optimization. In this method, algorithms are used to run the analysis. The current trend in automatic optimization is the application of nature inspired algorithms such as Genetic Algorithm (GA), Particle Swarm Optimization (PSO), Bacteria Foraging Optimization (BFO), Artificial Bee Colony (ABC) and Firefly algorithm. These algorithms are also becoming the backbones of the network planning software (Elkamchouchi, et al., 2007; Riaz, Imran, and Hoshyar, 2010). Based on the explanation of the methods in cellular network planning, it can be seen that this research fall into the scope of automatic optimization (refer Figure 2.1)
2.2.1 The Importance of Cellular Network Planning
The main aim of network planning is to fulfill the customers demand with an acceptable Quality of Service (QoS). This is crucial for the network providers to avoid losing their market share (Amaldi, et al., 2006; Qiang, et al., 2006). Additionally, the cellular network planning yields the ability to deal with the interference from other signals (Gamst, 1987; L. Song and Shen, 2010).
15
of cellular network planning systems will not come to an end (Rahman, Matin, and Rahman, 2013).
The cost and complexity of a network are highly dependent on the number of readers (transmitter). A good planning system is able to optimize the number of transmitters needed and from here; the cost and complexity of network will be under control (Corre and Lostanlen, 2009; Engels and Sarma, 2002; Qiang, et al., 2006).
The continuous development in the cellular network pushes the performance of the information technology system to a higher level. To complement the continuous stream of information to the subscribers, the concept of the internet of things was born. In this concept, a technology known as the Radio Frequency Identification (RFID) is heavily exploited. The RFID technology is very efficient for the purpose of tracking and managing the assets and it has become increasingly famous among companies, organizations, retailers and others (Bolic, Simplot-Ryl, et al., 2010; Hasnan, Bareduan, Nawawi, and Sidek, 2013; Nawawi, Hasnan, and Ahmad Bareduan, 2011; Sarma, 2004).
2.2.2 The Relation between Cellular Network and RFID Technology
As mentioned in the previous section, the needs to track and manage the assets are blooming along the continuous development of cellular network technology. The subscribers (customers) of the cellular network services demand a faster mobile internet connection. This trend is predictable since the shocking number of smart phones purchases. Along with the trend, the needs for a real time assets tracking and management are also on the rise. There are more companies started to implement the RFID system in their supply chain. This growing trend is also assisted by the escalating number of activities related to online shopping and rapid advertisement approach (Huseynov and Yıldırım, 2014; Malviya and Sawant, 2014).
16
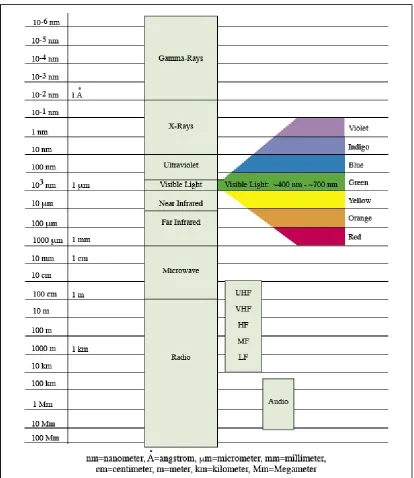
applicable to the RFID network. This is because both networks reside in the same category (UHF to LF) as seen in the electromagnetic spectrum (refer Figure 2.2). Additionally, the Friis transmission equation (Equation (2.1)) is used in both networks for the purpose of mathematical models development (Chen, et al., 2011; D. Dobkin, 2008; Laiho, et al., 2006). Both networks also have the same goal: To achieve the acceptable Quality of Service (QoS) (Levis, Johnson, and Teixeira, 2010; Qiang, et al., 2006).
(2.1)
Notation : Power input at receiving antenna : Power output at transmitting antenna : Transmitting antenna gain
: Receiving antenna gain : Wavelength
: Distance between antennas
17
Figure 2.2: The Electromagnetic Spectrum (LASP)
18
becoming more affordable to the masses (Bolic, Simplot-Ryl, et al., 2010). The next section uncovers some details about the RFID system.
2.3 Radio Frequency Identification (RFID) System
RFID is considered as a mature technology nowadays. This technology has a huge potential to solve the asset management related problems such as asset security, identification and tracking (Al-Ali, Sajwani, Al-Muhairi, and Shahenn, 2007). RFID is also able to speed up the process of checking and monitoring of tasks and provide real-time information about the process in interest (H. Chen and Y. Zhu, 2008; Mehrjerdi, 2009). RFID is a part of Auto-ID systems which consists of another identification elements such as smart cards and barcodes (Fuhrer, Guinard, and Liechti, 2006).
2.3.1 RFID Equipments
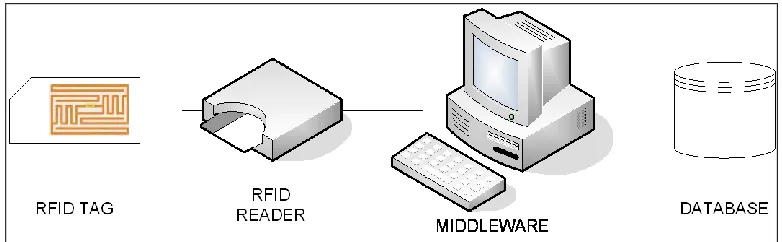
19
[image:41.596.124.515.140.261.2]power source and 3) Method of communication between tag and reader (Bolić, Athalye, and Li, 2010).
Figure 2.3: RFID System Components (Elshayeb, Hasnan, and Yen, 2009)
2.3.1.1 RFID Tag
An RFID tag generally contains an antenna and an electronic chip (Fuhrer, et al., 2006). RFID tag communicates with the RFID reader using a method named Backscatter Modulation (Bolić, et al., 2010; Qiang, et al., 2006). In this kind of communication method, the tag is powered by radio wave transmitted to them by the RFID reader. This tag will send information back to reader using the radio wave reflection.
20
2.3.1.2 RFID Reader
An RFID reader is a very crucial component in an RFID system that located between the RFID tag and the event filter (Glover and Bhatt, 2006). It is used to generate and transmit radio frequency (RF) energy that will wake up the RFID tag. Another function of an RFID reader is to receive and decode backscatter signal received by the tag (Glover and Bhatt, 2006; Karmakar, 2010; Harvey Lehpamer, 2012). This reader and tag communication system is also known as a master-slave relationship with the reader acts as the master while the tag is the slave (Karmakar, 2010). In addition, an advanced version of an RFID reader has the capability to read and write data on the tag. For UHF readers, this task can be done within the frequency of 865-868 MHz for ETSI and 902-928 MHz for FCC (Siemens, 2012).
An RFID reader consists of three main parts: 1) Antenna, 2) Transceiver and 3) Control Section. The antenna is needed for sending and receiving RF signals. In order to generate RF signal for transmission and reception, the transceiver has to be in operation. The transceiver will operate under two signal path (signal from tag and signal to tag). The third part, the control section, consists of microprocessor, memory block, analog to digital converters and communication block (Karmakar, 2010). The control section, as it name suggests, perform several tasks such as operating signal modulation, initiating anti collision procedures and decoding received signal from tag. The microprocessor is used to decode data. This part also performs digital signal processing over received data from tag (Glover and Bhatt, 2006; Karmakar, 2010; Harvey Lehpamer, 2012; F. Wang and Liu, 2005a).
RFID readers can be divided into two main categories (fixed reader and mobile reader) (Harvey Lehpamer, 2012; Siemens, 2012). A fixed reader comes with cables for power supply and data transfer. This kind of reader is usually mounted on walls or doors. In the other hand, a mobile reader is also known as handheld RFID reader. A handheld reader is powered by a battery and it can transmit data wirelessly (Siemens, 2012).
21
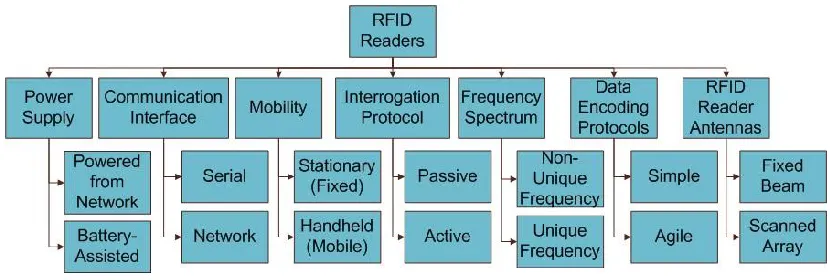
[image:43.596.113.528.222.362.2]communication is also called tag talks first. An RFID reader with read-write communication type will send command to tag before initiating reading or writing activity (A. Lozano-Nieto, 2010). As the RFID technology becomes matured, the speed of reading and writing to tag are significantly reduced and for some manufacturers, the reading rate is equal to the writing rate (Siemens, 2012). A detail classification of RFID readers can be seen in Figure 2.4 (Karmakar, 2010).
Figure 2.4: Classification of RFID Readers (Karmakar, 2010)
22
2.3.1.3 RFID Middleware
An RFID system will yield a large volume of data (F. Wang and Liu, 2005b). In order to utilize an RFID system, these data must have value and can assist the decision making processes. The main role of RFID middleware is to filter and process data that comes from deployed RFID readers. A middleware is able to sort and process data according to the system requirements (Bolić, et al., 2010). These data must be presentable to the higher level software. A middleware will pilot the readers and process data from the reader so that the data will be useful for the decision maker (Fuhrer, et al., 2006). Middleware will serve as bridges between the physical RFID world and the rest software infrastructure (F. Wang and Liu, 2005a).
According to Glover (2006), RFID middleware consists of three main components. The first is Application Level Interface that is used to summarize information from device interface. Besides, Event Manager is needed in a middleware for processing and filtering raw data from RFID reader. This step is crucial for providing meaningful information from the RFID reader and useful for decision making process. In order to allow the application level interface to manage RFID readers, a middleware must have the Reader Adapter.
2.4 The Horizon of RFID Technology
Low-cost RFID tag is capable of reading or writing the information of an entity without contact physically, while it possesses a fast recognition speed, and has a relatively greater storing ability compared with bar-code (Asif and Mandviwalla, 2005; Fagui and Zhaowei, 2006; Fuhrer, et al., 2006; Glover and Bhatt, 2006). Data-on-tag can also be modified for information updating purpose (Bolić, et al., 2010).
23
requires human intervention for scanning purpose and it will provide chance for error and inefficiencies (Al Kattan and Al-Khudairi, 2007; Fuhrer, et al., 2006; Sahin, Dallery, and Gershwin, 2002). Using RFID, the RFID label or tag can be scanned from a greater distance and this will eliminate the need for Line of Sight (Al Kattan and Al-Khudairi, 2007; Angeles, 2005; Glover and Bhatt, 2006; F. Wang and Liu, 2005a).
RFID technology also offers a higher read rate compared to barcodes and more than one tag can be read simultaneously (Bolic, Athalye, and Li, 2010). This technology also capable of reading objects in motion and data-on-tag can be read under hard conditions (Fuhrer, et al., 2006). With all of these advantages, RFID technology has a potential to achieve global asset visibility by automating and enhancing asset management system (Angeles, 2005; Bolić, et al., 2010; Glover and Bhatt, 2006). In addition, RFID has the potential to bring new transparency to the supply chain (Asif and Mandviwalla, 2005; Clarke, Twede, Tazelaar, and Boyer, 2006).
Despite all the advantages offered by RFID technology, there are several challenges before implementing this technology. One main challenge is the non-compatibility between different operating frequencies. Communication between RFID equipments or devices will not initiate if the operating frequencies are different (Bolić, et al., 2010). The operating frequencies are different according to RFID equipments manufacturers.
24
i. Source data acquisition (reading RFID data and integrating with other source data);
ii. Integrating source data with enterprise transactions systems; iii. Integrating data across organizations;
iv. Data warehousing and analytic processing; v. Data archiving (backup and replication); and vi. Data deletion and disposal.
To deploy an RFID system in a large-scale, a lot of readers and tags are needed. This scenario will contribute to a higher system complexity and the performance related problems will arise (Bolić, et al., 2010). One of them is limited read range of RFID reader (Al-Ali, et al., 2007).
191
REFERENCES
Ahson, S., and Ilyas, M. (2008). RFID handbook: applications, technology, security, and privacy: CRC.
Ahson, S. A., and Ilyas, M. (2010). RFID handbook: applications, technology, security, and privacy: CRC press.
Al-Ali, A. S. A., Sajwani, F., Al-Muhairi, A., and Shahenn, E. (2007). Assessing the Feasibility of Using RFID Technology in Airports. Paper presented at the RFID Eurasia, 2007 1st Annual.
Al Kattan, I., and Al-Khudairi, T. (2007). Improving Supply Chain Management effectiveness using RFID. Paper presented at the Engineering Management Conference, 2007 IEEE International.
Alotto, P., Gaggero, M., Molinari, G., and Nervi, M. (1997). A design of experiment and statistical approach to enhance the generalised response surface method in the optimisation of multiminima problems. Magnetics, IEEE Transactions on, 33(2), 1896-1899.
Amaldi, E., Capone, A., Malucelli, F., and Mannino, C. (2006). Optimization problems and models for planning cellular networks Handbook of optimization in telecommunications (pp. 917-939): Springer.
Anderson, M. J., and Whitcomb, P. J. (2000). DOE simplified: practical tools for effective experimentation: Productivity Portland.
Angeles, R. (2005). RFID Technologies: Supply-Chain Applications and Implementation Issues. Information System Management, 15.
Asif, Z., and Mandviwalla, M. (2005). Integrating the Supply Chain with RFID: An In-Depth Technical and Business Analysis. Communications of Association for Information System, 15(24).
192
Aysegul, S., Nabil, A., and Stephane, D.-P. (2008). A simulation approach to evaluate the impact of introducing RFID technologies in a three-level supply chain. Paper presented at the Proceedings of the 40th Conference on Winter Simulation.
Barco, R., Canete, F. J., Diez, L., Ferrer, R., and Wille, V. (2001, 2001). Analysis of mobile measurement-based interference matrices in GSM networks. Paper presented at the Vehicular Technology Conference, 2001. VTC 2001 Fall. IEEE VTS 54th.
Beielstein, T., Parsopoulos, K. E., and Vrahatis, M. N. (2002). Tuning PSO parameters through sensitivity analysis. HT014601767.
Ben, N., Wong, E. C., Yujuan, C., and Li, L. (2009, 26-28 Dec. 2009). RFID Network Planning Based on MCPSO Alogorithm. Paper presented at the Information Science and Engineering (ISISE), 2009 Second International Symposium on.
Bhattacharya, I. (2011). Tracking and Monitoring of Tagged Objects employing Particle Swarm Optimization algorithm in a Departmental Store. IIUM Engineering Journal, 12(1), 1-12.
Bhattacharya, I., and Roy, U. K. (2010). Optimal Placement of Readers in an RFID Network Using Particle Swarm Optimization. International Journal of Computer Networks & Communications, 2(6).
Bhattacharya, I., and Roy, U. K. (2010). Optimal placement of readers in an RFID network using particle swarm optimization. International Journal of Computer Networks & Communications, 2(6), 225-234.
Blondin, J. (2009). Particle swarm optimization: A tutorial. from site: http://cs. armstrong. edu/saad/csci8100/pso tutorial. pdf.
Bolic, M., Athalye, A., and Li, T. H. (2010). Performance of passive UHF RFID systems in practice. RFID Systems: Research Trends and Challenges.
Bolić, M., Athalye, A., and Li, T. H. (2010). Performance of passive UHF RFID systems in practice. RFID Systems, 1-22.
Bolic, M., Simplot-Ryl, D., and Stojmenovic, I. (2010). RFID systems: research trends and challenges: John Wiley & Sons.
193
Brown, P., Hartmann, P., Schellhase, A., Powers, A., Brown, T., Hartmann, C., et al. (2007). 2E-3 Asset Tracking on the International Space Station Using Global SAW Tag RFID Technology. Paper presented at the Ultrasonics Symposium, 2007. IEEE.
Bustillo, M. (2010). Wal-Mart radio tags to track clothing. Wall Street Journal, 23, A1.
Byoung-Seong, P., Jong-Gwan, Y., and Han-Kyu, P. (2002, 2002). The determination of base station placement and transmit power in an inhomogeneous traffic distribution for radio network planning. Paper presented at the Vehicular Technology Conference, 2002. Proceedings. VTC 2002-Fall. 2002 IEEE 56th.
Calégari, P., Guidec, F., Kuonen, P., Chamaret, B., Ubéda, S., Josselin, S., et al. (1996). Radio network planning with combinatorial optimization algorithms. Proceedings of the ACTS Mobile Telecommunications Summit 96, 2, 707-713.
Castro, B., Gomes, I., Ribeiro, F., and Cavalcante, G. (2010). COST231-Hata and SUI Models performance using a LMS tuning algorithm on 5.8 GHz in Amazon Region cities. Paper presented at the Antennas and Propagation (EuCAP), 2010 Proceedings of the Fourth European Conference on.
Chamaani, S., Mirtaheri, S. A., Teshnehlab, M., and Shooredeli, M. A. (2007). Modified multi-objective particle swarm optimization for electromagnetic absorber design. Paper presented at the Applied Electromagnetics, 2007. APACE 2007. Asia-Pacific Conference on.
Chan, S., Connell, A., Madrid, E., Dongkuk, P., and Kamoua, R. (2009). RFID for personal asset tracking. Paper presented at the Systems, Applications and Technology Conference, 2009. LISAT '09. IEEE Long Island.
Chapman, S. J. (2008). MATLAB programming for engineers: Thomson Engineering. Chen, H., and Zhu, Y. (2008). RFID networks planning using evolutionary algorithms and swarm intelligence. Paper presented at the Wireless Communications, Networking and Mobile Computing, 2008. WiCOM'08. 4th International Conference on.
194
Chen, H., Zhu, Y., and Hu, K. (2010). Multi-colony bacteria foraging optimization with cell-to-cell communication for RFID network planning. [doi: 10.1016/j.asoc.2009.08.023]. Applied Soft Computing, 10(2), 539-547.
Chen, H., Zhu, Y., Hu, K., and Ku, T. (2011). RFID network planning using a multi-swarm optimizer. [doi: 10.1016/j.jnca.2010.04.004]. Journal of Network and Computer Applications, 34(3), 888-901.
Chiu, S. (2010). Design of Passive Tag RFID Readers. In M. Bolic, d. Simplot-Ryl & I. Stojmenovic (Eds.), RFID Systems: Research Trends and Challenges (pp. 129-153). United Kingdom: Intel Corporation.
Clarke, R. H., Twede, D., Tazelaar, J. R., and Boyer, K. K. (2006). Radio frequency identification (RFID) performance: the effect of tag orientation and package contents. Packaging Technology and Science, 19(1), 45-54.
Clerc, M. (2006). Particle swarm optimization (Vol. 67). Clerc, M. (2009). A method to improve standard PSO.
Clerc, M. (2010). Particle swarm optimization (Vol. 93): John Wiley & Sons.
Corre, Y., and Lostanlen, Y. (2009). Three-Dimensional Urban EM Wave Propagation Model for Radio Network Planning and Optimization Over Large Areas. Vehicular Technology, IEEE Transactions on, 58(7), 3112-3123.
Delen, D., Sharda, R., and Hardgrave, B. C. (2011). The promise of RFID-based sensors in the perishables supply chain. Wireless Communications, IEEE, 18(2), 82-88.
Di Giampaolo, E., Forni, F., and Marrocco, G. (2010, 12-16 April 2010). RFID-network planning by Particle Swarm Optimization. Paper presented at the Antennas and Propagation (EuCAP), 2010 Proceedings of the Fourth European Conference on.
Dingyi, Z., Yunlong, Z., and HanNing, C. (2008, 12-14 Oct. 2008). An Algorithm for Deployment of RFID Readers in EPC Network. Paper presented at the Wireless Communications, Networking and Mobile Computing, 2008. WiCOM '08. 4th International Conference on.
195
Dobkin, D. (2008). The RF in RFID passive UHF in practice. United States of America, Newness.
Dobkin, D. M. (2008). The RF in RFID: passive UHF RFID in practice: Newnes. Dobslaw, F. (2010). A parameter tuning framework for metaheuristics based on
design of experiments and artificial neural networks. Paper presented at the Proceeding of the International Conference on Computer Mathematics and Natural Computing 2010.
Eberhart, R. C., and Shi, Y. (2001). Tracking and optimizing dynamic systems with particle swarms. Paper presented at the Evolutionary Computation, 2001. Proceedings of the 2001 Congress on.
Eberhart, R. C., Shi, Y., and Kennedy, J. (2001). Swarm intelligence: Elsevier.
El-Gallad, A., El-Hawary, M., Sallam, A., and Kalas, A. (2002). Enhancing the particle swarm optimizer via proper parameters selection. Paper presented at the Electrical and Computer Engineering, 2002. IEEE CCECE 2002. Canadian Conference on.
Elayoubi, S.-E., Ben Haddada, O., and Fourestié, B. (2008). Performance evaluation of frequency planning schemes in OFDMA-based networks. Wireless Communications, IEEE Transactions on, 7(5), 1623-1633.
Elkamchouchi, H. M., Elragal, H. M., and Makar, M. A. (2007, 13-15 March 2007). Cellular Radio Network Planning using Particle Swarm Optimization. Paper presented at the Radio Science Conference, 2007. NRSC 2007. National. Elshayeb, S. A., Hasnan, K. B., and Yen, C. Y. (2009). Improving Supply Chain
Traceability Using RFID Technology International Conference on Recent and Emerging Advanced Technologies in Engineering 2009.
Engels, D. W., and Sarma, S. E. (2002). The reader collision problem. Paper presented at the Systems, Man and Cybernetics, 2002 IEEE International Conference on.
Evers, G. I. (2009). An automatic regrouping mechanism to deal with stagnation in particle swarm optimization. University of Texas-Pan American.
196
Fan, Z., Qiao, S., Huang-Fu, J. T., and Ran, L. X. (2007). Signal descriptions and formulations for long range UHF RFID readers. Progress In Electromagnetics Research, 71, 109-127.
Fasbender, A., Reichert, F., Geulen, E., Hjelm, J., and Wierlemann, T. (1999). Any network, any terminal, anywhere [cellular radio]. Personal Communications, IEEE, 6(2), 22-30.
Finkenzeller, K. (2010). RFID handbook: fundamentals and applications in contactless smart cards, radio frequency identification and near-field communication: Wiley.
Franceschini, G., and Macchietto, S. (2008). Model-based design of experiments for parameter precision: State of the art. Chemical Engineering Science, 63(19), 4846-4872.
Fred, N., Richard, G. M., Roger, M., and Ik-Whan, K. (2007). Examining RFID applications in supply chain management. Commun. ACM, 50(7), 92-101. Fuhrer, P., Guinard, D., and Liechti, O. (2006). RFID: From Concepts to Concrete
Implementation.
Gamst, A. (1987, 1-3 June 1987). Remarks on radio network planning. Paper presented at the Vehicular Technology Conference, 1987. 37th IEEE.
Ghomsheh, V. S., Shoorehdeli, M. A., and Teshnehlab, M. (2007). Training ANFIS structure with modified PSO algorithm. Paper presented at the Control & Automation, 2007. MED'07. Mediterranean Conference on.
Glover, B., and Bhatt, H. (2006). RFID Essentials (First Edition ed.). CA: O'Reilly Media, Inc.
Gong, Y.-J., Shen, M., Zhang, J., Kaynak, O., Chen, W.-N., and Zhan, Z.-H. (2012). Optimizing RFID network planning by using a particle swarm optimization algorithm with redundant reader elimination. Industrial Informatics, IEEE Transactions on, 8(4), 900-912.
Gong, Y., Shen, M., Zhang, J., Chen, W., and Zhan, Z. (2011). Optimizing RFID Network Planning by Using a Particle Swarm Optimization Algorithm with Redundant Reader Elimination.
197
Hämäläinen, J. (2008a). Cellular network planning and optimization–part VII: WCDMA link budget. Helsinki University of Technology.
Hämäläinen, J. (2008b). Cellular Network Planning and Optimization Part I: Introduction.
Han, F., and Jie, Q. (2012, 19-22 Feb. 2012). Optimal RFID networks planning using a hybrid evolutionary algorithm and swarm intelligence with multi-community population structure. Paper presented at the Advanced Communication Technology (ICACT), 2012 14th International Conference on.
Har, D., Watson, A. M., and Chadney, A. G. (1999). Comment on diffraction loss of rooftop-to-street in COST 231-Walfisch-Ikegami model. Vehicular Technology, IEEE Transactions on, 48(5), 1451-1452.
Hasnan, K., Bareduan, S. A., Nawawi, A., and Sidek, N. A. (2013). Implementation of RFID System for Improving the Inventory Management System in Unijoh Sdn. Bhd. Paper presented at the 1st National Conference on Knowledge Transfer (KTP 01).
Hinkelmann, K., and Kempthorne, O. (2008). Design and analysis of experiments: Volume 1: Introduction to experimental design. AMC, 10, 12.
Huseynov, F., and Yıldırım, S. Ö. (2014). Internet users’ attitudes toward business-to-consumer online shopping A survey. Information Development, 0266666914554812.
Jones, E. C., and Chung, C. A. (2007). RFID in logistics: a practical introduction: CRC.
Karmakar, N. C. (2010). Handbook of smart antennas for RFID systems: Wiley Online Library.
Kennedy, J., and Eberhart, R. (1995, Nov/Dec 1995). Particle swarm optimization. Paper presented at the Neural Networks, 1995. Proceedings., IEEE International Conference on.