JOUVAN CHANDRA PRATAMA PUTRA
A thesis submitted in
Fulfilment of the requirement for the award of the Master Degree of Civil Engineering
Faculty of Civil and Environmental Engineering University Tun Hussein Onn Malaysia
ABSTRACT
Indoor Air Quality (IAQ) is an important parameter in deciding the status of Sick Bulding Syndrome (SBS). Poor IAQ which leads to SBS can result in adverse effect on the health of the occupant which causing lower productivity. This study was conducted to establish correlation between IAQ and employee’s productivity. Five parameters of IAQ which include air velocity, air temperature, relative humidity, particulate matters ≥ 0.3 µm and CO2 were considered in this study. The values of
these parameters were measured using Davis Anemometer, Particle Counter GT 521 and YES Plus LGA Meter. The measured data were then used as an input data for simulation model of the room using Comsol Multiphysics software. The simulation generated the indoor air velocity of the room and particle distribution. For validation purpose, only the predicted velocity was compared with the measured value, and found that the percentage difference were in the range of 1.5% to 8.45% (below than 10%). Once the model had been validated, the parametric study of air supply inlet position was conducted on the model and found that the position of air supply inlet with x = 2.5 ft, y = 10 ft and H = 6.5 ft give the most efficient air distribution model for diluting the impurities due to the particulate. The questionnaire survey distributed amongst the occupants of the room showed that the occupants were less satisfied
ABSTRAK
Kualiti udara dalaman merupakan parameter penting dalam menentukan status Sindrom Bangunan Sakit (SBS). IAQ yang rendah boleh memberi kesan yang buruk pada kesihatan penghuni dan juga menyebabkan produktiviti rendah. Kajian ini dijalankan untuk menentukan tahap SBS bilik pejabat yang dipilih dan kesannya terhadap produktiviti penghuni. Parameter SBS yang dipertimbangkan dalam kajian ini adalah IAQ dan tahap kepuasan penghuni. Lima parameter IAQ yang terlibat dalam kajian ini adalah halaju udara, suhu udara, kelembapan relatif, zarah ≥ 0.3 µm dan CO2. Nilai parameter tersebut diukur menggunakan Davis Anemometer, Particle
Counter GT521 dan YES Plus LGA Meter. Data diukur digunakan sebagai input bagi model simulasi bilik dengan menggunakan perisian Comsol Multiphysics. Simulasi yang dihasilkan adalah halaju udara dalaman dan pengedaran zarah. Untuk pengesahan, hanya halaju udara sahaja divalidasikan dengan nilai yang diukur. Hasil validasi mendapati peratus perbezaan adalah 1.5% kepada 8.45% (iaitu kurang dari 10%). Apabila model telah disahkan, kajian parametrik dijalankan ke atas model dan mendapati bahawa kedudukan masuk dengan x = 2.5 ft, y = 10 ft dan H = 6.5 ft memberikan model pengedaran udara yang paling berkesan untuk mencairkan kekotoran zarah . Kaji selidik soal selidik yang diedarkan di kalangan penghuni bilik
TABLE OF CONTENTS
TITLE i
DECLARATION ii
DEDICATION iii
ACKNOWLEDGEMENT iv
ABSTRACT v
ABSTRAK vi
TABLE OF CONTENTS vii
LIST OF PUBLICATIONS x
LIST OF TABLES xi
LIST OF FIGURES xii
LIST OF SYMBOLS xvi
LIST OF APPENDICES xix
CHAPTER 1: INTRODUCTION
1.1 Background 1
1.2 Problem Statement 3
1.3 Aim & Objectives 4
1.4 Significance of Research 5
1.4 Scope of The Research 5
1.5 Thesis Layout/Organization 5
CHAPTER 2: LITERATURE REVIEW
2.1 Introduction 7
2.2 Indoor Air Quality Definition 7
2.2.1 Particulate Matter (PM) 11
2.2.2 Gas Pollutants 11
2.2.3 Temperature and Humidity 14
2.2.4 Air Movement 15
2.3.1 Mechanical Ventilation 15
2.4 Sick Building Syndrome (SBS) 18
2.5 Productivity 21
2.5.1 IAQ Affecting Productivity 21
2.6 Computer Modelling and Simulation in IAQ Study 23
2.6.1 COMSOL Multiphysics Software 26
2.7 Summary 28
CHAPTER 3: RESEARCH METHODOLOGY
3.1 Introduction 29
3.2 Research Framework 29
3.3 Data Collection 32
3.3.1 Physical Measurement 32
3.3.2 Questionnaire 38
3.3.2.1 Sick Building Symptoms 39
3.3.2.2 Measurement Scale 40
3.4 Analysis Method 40
3.4.1 Descriptive Analysis 40
3.4.2 Correlation of Rank Spearman 41
3.5 Comsol Multiphysics Modelling and Simulation 41
3.5.1 Geometry 42
3.5.2 Mesh 43
3.5.3 Solver and Computation 44
3.5.4 Post Processing Results 44
3.6 Summary 45
CHAPTER 4: FIELD STUDY OF IAQ AT ORICC BUILDING
4.1 Introduction 46
4.2 IAQ Measurement 46
4.2.1 ORICC Office Building 46
4.2.2 Equipments and Measurement 48
4.2.3 Results and Discussion 52
4.2.4 Analysis of Critical IAQ 60
4.3 Questionnaire Survey 64
4.3.2 Likeliness of SBS Presence 66
4.3.3 Occupant Satisfaction 69
4.3.4 Correlation of Comfort Environmental
Parameters on Working Performance 70
4.4 Summary 71
CHAPTER 5: MODELLING OF AIRFLOW AND PARTICLE MOVEMENT
5.1 Introduction 72
5.2 Modelling of Room 5 72
5.2.1 Construction of Space Geometry 73
5.2.2 Selection of Physics Module 75
5.2.3 Assigning Values and Defining Boundary 76
5.2.4 Meshing 79
5.2.5 Simulation of Room 5 80
5.2.6 Simulation Process 80
5.3 Validation 85
5.4 Parametric Study 86
5.5 Summary 92
CHAPTER 6: CONCLUSION AND RECOMMENDATIONS
6.1 Introduction 93
6.2 Significant Findings 93
6.2.1 Objective 1; Determine The Level of IAQ in The Office 93 6.2.2 Objective 2; Establish the Correlation
Between IAQ and Employee's productivity 94 6.2.3 Objective 3; Determine the Best Position for
Improving IAQ 94
6.3 Limitations 94
6.4 Recommendation for Future Work 95
REFERENCES 96
LIST OF PUBLICATIONS .
Papers:
1. Ade Asmi, Jouvan Chandra Pratama Putra, Ismail bin Abdul Rahman, (2012). ”A Study of Indoor Air Quality in University Laboratory Buildings”, International Journal of Engineering Science and Technology (ISSN: 0975-5462) Vol. 4 No. 09 September 2012 (indexed by Google Scholar)
2. Ade Asmi, Jouvan Chandra Pratama Putra, Ismail bin Abdul Rahman (2012). ”A Study of Indoor Air Quality of Public Toilet in University’s Building. In 2012 IEEE Colloqium Humanities, Science and Engineering (CHUSER) (pp. 403-408). Ieee. doi:10.1109/CHUSER.2012.6504347 (indexed by scopus)
3. Ade Asmi, Jouvan Chandra Pratama Putra, Ismail Abdul Rahman, (2014). ”Simulation of Room Airflow Using Comsol Multiphysics Software”, Applied Mechanics and Materials vol. 465-466 pp 571-577 (indexed by scopus and ISI)
4. Ismail Abdul Rahman, Jouvan Chandra Pratama Putra, Ade Asmi, (2014). ”Modeling of Particle Dispersion in Mechanically Ventilated Space”, Modern Applied Science 8(3) p.60 (indexed by scopus)
5. Ismail Abdul Rahman, Jouvan Chandra Pratama Putra, Ade Asmi, (2014). "Assessment of Toilet's Indoor Air Quality in Relation to Asthmatic People", Modern Applied Science. (Indexed by Scopus)
6. Ismail Abdul Rahman, Jouvan Chandra Pratama Putra, Sasitharan Nagapan, (2014). "The Correlation of Indoor Air Quality Towards Working Performance in University Office Building", Modern Applied Science. (Indexed by Scopus)
7. Ismail Abdul Rahman, Jouvan Chandra Pratama Putra, Ade Asmi, (2014). "Modelling of Particle Transmission in Laminar Flow Using Comsol Multiphysics" (submitted to International Conference on Advance in
Manufacturing and Materials Engineering -
https://sites.google.com/site/icamme14/)
8. Ismail Abdul Rahman, Jouvan Chandra Pratama Putra, Abdul Halid, (2015). "Airflow Behaviour in Particle Transmission in an Office Building". (submitted to IConGDM 2015).
LIST OF TABLES
2.1 Summary of Reported Associations between
Work-Related Symptoms and Various Environmental Factors
and Measurement from Studies 20
2.2 Input Requirements for COMIS Simulation
of Multi-Zone Airflow 24
2.3 Researchers Involved with COMSOL Multiphysics 27 3.1 Spesification of Met-One Particle Counter GT-521 33 3.2 Spesification and Accuration of YES Plus LGA Meter 35 3.3 Spesification and Accuration of Davis Anemometer 36 3.4 Scale Used to Measure and Interprete Worker’s Perception 40
3.5 Domain Names of Geometry 43
3.6 COMSOL’s Solver Types 44
4.1 Average Values of CO2 and PM ≥ 0.3 µm for 8 Hours 64
4.2 Likeliness of SBS Presence 67
4.3 Justification of SBS Symptoms Presence 68
4.4 Comfort Environmental Parameters vs. Working Performance 70 5.1 Input Value of Laminar Flow and
Particle Tracing for Fluid Flow 77
5.2 DoF and Computational Time for Airflow Distribution 81 5.3 DoF and Computational Time for Particle Transmission 81
5.4 Outcomes for Models 1 to 6. 83
5.5 Percentage of Transmission Probability 84
5.6 Percentage Difference Values 85
5.7 Perturbation Values 87
5.8 Parametric Study Results 90
1.1 Number of Days for Unhealthy Air Quality
Status by Stati on, Malaysia 2012 1
1.2 Average Annual Concentration of Particulate Matter
By Land Use, Malaysia 2012 2
1.3 Location of ORRIC Office with EVERGREEN
Factory in 200 m Distance 4
2.1 Air-Conditioning (Split Unit) 17
2.2 Diagram of Relationship between Work Performance & Indoor
Environment 24
2.3 Multi-Zone Method of CONTAM and COMIS 25
2.4 Zonal Models 26
3.1 Research Methodology Flowchart 31
3.2 Met One Particle Counter GT-521 33
3.3 Yes Plus LGA Meter 35
3.4 Davis Anemometer 36
3.5 Zero Count Test 37
3.6 Flow Rate Test 38
3.7 Vertex Types 42
3.8 Boundary in 2D (left) and 3D (right) 43
3.9 Domain in 2D (left) and 3D (right) 43
4.1 Layout of ORICC Office 47
4.2 The GT-521 Screen Display 48
4.3 Outdoor Air Measurement 50
4.4 Indoor Air Measurement 51
4.5 Measured Outdoor Temperature 52
4.6 Measured Outdoor Humidity 52
4.8 Measured Outdoor PM ≥ 0.3 µm 53
4.9 Measured Outdoor CO2 53
4.10 Contour of Indoor Air Humidity (%) 55
4.11 Contour of Indoor Air Temperature (°C) 56
4.12 Contour of Indoor Air Velocity (m/s) 57
4.13 Contour of Indoor Air PM ≥ 0.3 µm (particles/m3) 58
4.14 Contour of Indoor CO2 (ppm) 59
4.15 Day 1 CO2 vs. Number of Occupant 60
4.16 Day 2 CO2 vs. Number of Occupant 60
4.17 Day 3 CO2 vs. Number of Occupant 61
4.18 Day 4 CO2 vs. Number of Occupant 61
4.19 Day 5 CO2 vs. Number of Occupant 61
4.20 Day 1 PM ≥ 0.3 µm vs. Number of Occupant 62
4.21 Day 2 PM ≥ 0.3 µm vs. Number of Occupant 62
4.22 Day 3 PM ≥ 0.3 µm vs. Number of Occupant 62
4.23 Day 4 PM ≥ 0.3 µm vs. Number of Occupant 63
4.24 Day 5 PM ≥ 0.3 µm vs. Number of Occupant 63
4.25 Job Category 65
4.26 The Percentage of Working period of Occupants
in The Office Building 66
4.27 Satisfaction Regarding Temperature 69
4.28 Perceived Thermal Condition 69
4.29 Satisfaction Regarding Air Velocity 69
4.30 Perceived Air Velocity Condition. 69
4.31 Ability to Adjust Temperature 70
4.32 Ability to Adjust Air Velocity 70
5.1 Room 5 73
5.2 2D Gometry Models of Room 5 and its Hallway 74
5.3 3D Geometry Models of Room 5 75
5.4 Laminar Module in COMSOL Multiphysics 76
5.5 Coupling of Particle Tracing with Laminar Flow Modules 76
5.7 Location of Air Velocity outlet 78
5.8 Location of Particle Release 78
5.9 Location of Particle Outlet 79
5.10 Geometry Meshed 80
5.11 Air Velocity Distribution of Model 1 82
5.12 Air Velocity Distribution of Model 2 82
5.13 Air Velocity Distribution of Model 3 82
5.14 Air Velocity Distribution of Model 4 82
5.15 Air Velocity Distribution of Model 5 82
5.16 Air Velocity Distribution of Model 6 82
5.17 Particle Trajectories of Model 1 83
5.18 Particle Trajectories of Model 2 83
5.19 Particle Trajectories of Model 3 84
5.20 Particle Trajectories of Model 4 84
5.21 Particle Trajectories of Model 5 84
5.22 Particle Trajectories of Model 6 84
5.23 R2 Value for Comparison between Measured Value
and Simulated Value 86
5.24 Inlet Air Supply Position with x = 2.5 ft,
y = 10 fr and H =6.5 ft 87
5.25 Inlet Air Supply Position with x = 2.5 ft,
y = 10 fr and H =7 ft 87
5.26 Inlet Air Supply Position with x = 5.5 ft,
y = 10 fr and H =6.5 ft 88
5.27 Inlet Air Supply Position with x = 5.5 ft,
y = 10 fr and H =7 ft 88
5.28 Inlet Air Supply Position with x = 2.5 ft, y = 10 ft and H = 6.5 ft 88 5.29 Simulation Behaviors for Inlet Air Supply
Position with x = 2.5 ft. y = 10 ft and H = 6.5 ft 89 5.30 Simulation Behaviors for Inlet Air Supply
Position with x = 2.5 ft. y = 10 ft and H = 7 ft 89 5.31 Simulation Behaviors for Inlet Air Supply
5.32 Simulation Behaviors for Inlet Air Supply
Position with x = 5.5 ft. y = 10 ft and H = 7 ft 89 5.33 Simulation Behaviors for Inlet Air Supply
LIST OF SYMBOLS AND ABBREVIATIONS
%RH - Percentage of Relative Humidity
ρ - Air Density
A - Cross Section Area of the Opening AO - Terrain of The Area
Al - Aluminium
ASHRAE - American Society of Heating, Refrigerating, and Air-Conditioning for Engineer
°C - Degree Celcius
CaCO3 - Calcium Carbonate
Cd - Cadmium
CD - Coefficient of Discharge
CFM - cubic feet per minute
CH4 - Methane
CO - Carbon Monoxide
CO2 - Carbon Dioxide
COHb - CarboxyHemoglobin
Cu - Cuprum
ETS - Environmental Tobacco Smoke
Fe - Ferrum
H+ - Hydrogen
HVAC - Heating, Ventilation, and Air-Conditioning IAP - Indoor Air Pollutants
IAQ - Indoor Air Quality
Mn - Mangan NO3- - Nitrate
NH4+ - Ammonium
NaCl - Natrium Chloride
Ni - Nickel
NO - Nitrogen Oxide
NO2 - Nitrogen Dioxide
O3 - Ozone
OHb - OxyHemoglobin
Pb - Plumbum
PDE - Partial Differential Equations PM - Particulate Matter
PM10 - Particulate Matter smaller than 10 µm in diameter
PM2.5 - Particulate Matter smaller than 2.5 µm in diameter
PM1 - Particulate Matter smaller than 1 µm in diameter
ppm - parts per million
Q - Volumetric Flow Rate
RSP - Respirable Suspended Particle
RH - Relative Humidity
Si - Silicon
SO2 - Sulphur Dioxide
SO42- - Sulfate
SPM - Suspended Particulate Matter SBS - Sick Building Syndrome THI - Temperature Humidity Index
Ti - Titanium
TLV - Threshold Limit Value UREF - Reference Wind Velocity
UMET - Wind Velocity Measured at The Weather Station Nearest to
The Building Location
U.S. EPA - United States Environmental Protection Agency TVOC - Total Volatile Organic Compounds
UTHM - University Tun Hussein Onn Malaysia
V - Vanadium
VOCs - Volatile Organic Compounds
WHO - World Health Organization
LIST OF APPENDICES
APPENDIX TITLE PAGE
A IAQ in Malaysia and other countries 108
B SBS symptoms 128
C Outdoor air quality 129
D Questionnaire part 151
E Questionnaire results 159
CHAPTER 1
INTRODUCTION
1.1
Background
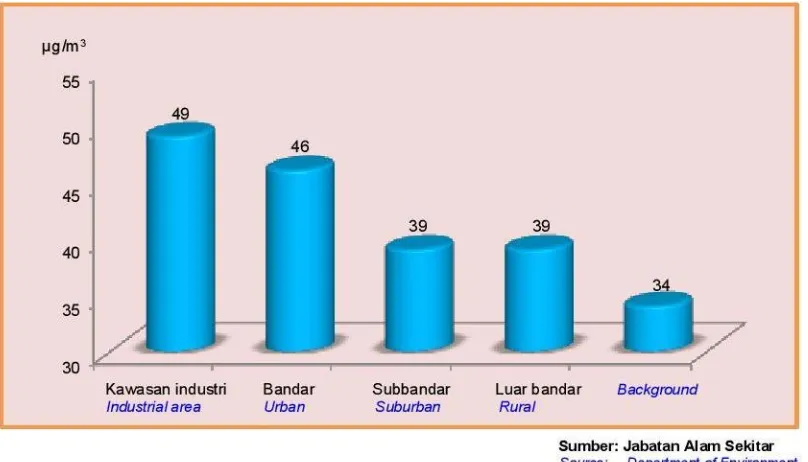
[image:17.595.117.524.404.686.2]In Malaysia, air quality becomes an interesting issue to be investigated since the rapid growth of industrial area which is not only contribute to the economic growth but also at the same time is affecting air quality as in Figures 1.1 and 1.2 respectively.
Figure 1.2: Average annual concentration of Particulate Matter by land use, Malaysia 2012 (Department of Statistic Malaysia, 2013).
According to study conducted by WHO (2005), more than 2 million premature deaths each year are attributed to the effects of urban outdoor air pollution and indoor air pollution. For controlling indoor air quality, ventilation is a commonly way to provide the healthy air for breathing (Zhang, 2005) by both diluting the pollutants originating in the building and removing the pollutants from building (Etheridge and Sandberg, 1996a; Awbi, 2003). Additionally, Sick Building Syndrome (SBS) is one of the indicators which can be used for assessing the capability of ventilation in providing healthy air within building (Finnegan et al., 1984; William, 2009; Guo et al., 2013; Norhidayah et al., 2013).
According to Israeli and Pardo (2011), SBS is defined as a term coined for a set of several clinically recognizable symptoms and ailments without a clear cause reported by occupants of a building. The symptoms usually resolve soon after
1.2
Problem Statement
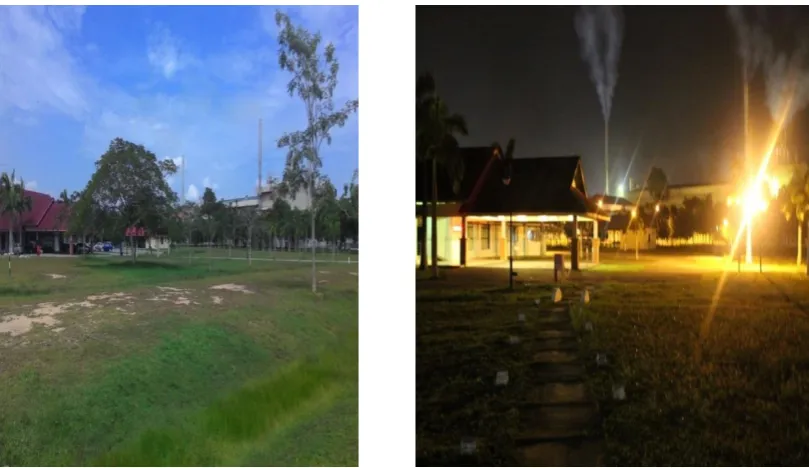
In Malaysia, research that related with indoor air quality in work place is restrictive as compared to other country (Mahbob et al., 2011) and people mostly spend 90% of
Figure 1.3: Location of ORRIC office with Evergreen factory in 200 m distance.
1.3
Aim and Objectives
The primary purpose of this research is to study the effects of IAQ on the occupant’s health and working performance. This aim can be achieved by carrying-out the following objectives as below:
i. To determine the level of IAQ parameters in the selected rooms. ii. To establish correlation between IAQ and working performance.
iii. To determine the optimum position of inlet air supply for improving IAQ.
The determination of IAQs’ level is to check whether its level exceed the
1.4
Significance of Research
The significances of this research include :
i. The outcomes of this research as an input to the authority in improving the
quality of IAQ of the office building in ensuring the heatlh of occupant.
ii.
An alternative approach to improve IAQ in a particular room is generated inthis research by optimizing the location of inlet air supply in order to dilute the pollutants.
1.5
Scope of the Research
This study was conducted on ORICC office at ground floor. The office is located in UTHM area and has a total area about 244.238 m2. However, for simulation works it involves only one (1) of the selected room which is the most critical in terms of measured IAQ. The selected rooms are ventilated by air-conditioning systems (split unit). Employee’s productivity is measured based on the questionnaire survey on the occupants of the rooms. For IAQ, the parameters measured are confined to air velocity, number of particles (PM ≥ 0.3 µm), CO2, temperature and humidity.
1.6
Thesis Layout/Organization
The organization of this thesis consists of 6 chapters and divided as followings :
Chapter 1: this chapter discusses on the fundamental and basic framework for this thesis. It contains background of the study, problem statement, aim and objectives, significance of research and scope of the research.
At the last an introductory review of the latest available modelling tools are presented here, which can simulate the IAQ in ventilated room.
Chapter 3: presents the framework idea of this whole research, how the research designed and the methodology used. This chapter is also contains detailed of research procedures and the selected analysis method.
Chapter 4: reports how the measurement was conducted, which contains of
analysis of IAQ measurement while questionnaire survey was conducted based on occupant’s perception .
Chapter 5: this chapter presents the modelling and simulation of IAQ in the selected rooms using COMSOL Multiphysics.
CHAPTER 2
LITERATURE REVIEW
2.1
Introduction
The literature pertaining to IAQ and its effect to health, working performance, as well as modelling and simulation of IAQ were reviewed in this chapter. It helps to point out some useful information regarding the research topic which is to study IAQ and its effects to occupant’s health and working performance.
2.2 Indoor Air Quality (IAQ) Definition
Indoor Air Quality (IAQ) firstly investigated in 1970s (Zhang, 2005) and continues until these days because it is a basis determinant of healthy life and people’s well being, comfort and productivity (Norhidayah et al., 2013). In defining IAQ, Bluyssen (2009) describes it within two (2) points of view. From the human point of view IAQ of a space is the physical effect of exposures of people to indoor air of the space they are visiting or occupying, as experienced by those people. IAQ at certain point in
referring to the air quality within and around buildings, especially being its relation to health and productivity of its occupant.
To identify IAQ parameters, a number of studies regarding IAQ and its adverse effect on health which occurs from poor IAQ are tabulated in APPENDIX A and disscused as follows:
Aizat et al. (2009) studied regarding IAQ & SBS in Malaysia buildings to investigate the association between SBS and indoor air pollutants in two differents buildings (new & old). The IAQ parameters considered are Relative Humidity (RH),
temperature, Carbon Dioxide (CO2), Carbon Monoxide (CO), ventilation rate, TVOC,
Particulate Matter (PM) and air velocity. The findings from their study indicated that the CO2 concentration on certain level was major factor contribute to SBS complain
among office workers. Subsequently, Norhidayah et al. (2013) studied IAQ & SBS in three selected buildings in Malaysia to determine the association between IAQ parameters and SBS symptoms. The IAQ parameters considered are air velocity, temperature, RH, CO2, CO, fungi, and PM. The findings suggested that the important
predictor of SBS are ventilation and accumulation of possible contaminants within the indoor environment.
Furthermore, Sulaiman and Mohamed (2011) investigated the association between SBS and indoor air pollutants through questionnaire which refer to the Malaysia Industry Code of Practice on Indoor Air Quality 2010 (MCPIAQ). The several IAQ parameters such as Volatile Organic Compounds (VOC), CO, CO2, RH,
temperature, formal dehyde, total bacteria counts and total fungal counts were used in this study. The findings indicated that CO2 has strong correlation with other indoor
pollutants that cause SBS symptoms. However, it was also indicated that temperature, TVOC, humidity and bacteria are important indoor air factors that can influence the prevalence of SBS. On other hand, Fadilah and Juliana (2012) not only investigated
the association between IAQ and indoor air pollutants but also its effect to SBS symptoms. The parameters considered are temperature, RH, air velocity, air flow, ventilation rate, CO2 and PM. The findings suggested that ventilation is necessary to
consequence for poor IAQ such as Sick Building Syndrome (SBS), occupant dissatisfaction and decrement of employee productivity. According to the findings from Aizat et al. (2009), in order to decrease the SBS it can be achieved either by increasing the ventilation rate or through source control of pollutants in which point sources of contaminants can be identified and it is more cost effective. The occurrence of SBS is not caused directly by CO2 and Ultra-Fine Particle (UFP)
exposure, but it caused by the exposure between CO2, UFP and other indoor
pollutant that may be cause SBS symptoms (Aizat et al., 2009).
In addition, to compare the IAQ parameters between Malaysia and other countries, a number of IAQ parameters from other researches regarding IAQ in overseas are tabulated in APPENDIX A and discussed as follows:
Yua et al. (2009), studied air-conditioning system and IAQ control for human health by reviewing some control methods of IAQ at past few years. The parameters considered are temperature, RH, air exchange rate, air movement, ventilation, particle pollutants, biological pollutants and gaseous pollutants. They concluded that the composition of indoor pollutant is quite complex and their concentrations are greatly different. The chemical reaction among indoor pollutants may occur, which can produce more irritating secondary pollutants. Only if these problems are solved, then indoor air can be controlled accurately. Subsequently, Rios et al. (2009) investigated the association between work-related symptoms and IAQ based on following parameters: temperature, RH, odours, PM, bioaerosol and VOC contamination. This study found that other disregarded factors, like undetect VOCs, mites, molds and endotoxin concentrations, may be associated to the greater prevalence of symptoms in the sealed building. Thus, the further studies still necessary to go deeper in this issue to enlighten the relation between IAQ buildings and SBS symptoms. Beside that, Seppanen and Fisk (2002) investigated the
TVOC, toluene, benzene, formaldehyde. The findings indicated that displacement ventilation provides more better IAQ in terms of dillute CO.
Moreover, Buggenhout (2005) developed and validated an airflow pattern sensor to determine the airflow for dilutes the indoor pollutants. This concept offers a new approach for control the fresh air distribution on ventilated space. The method of this approach is by using its temperature sensor to detect the jet air trajectory, and it is a
low cost and reliable method which can be easily implemented in the hardware of existing ventilation equipment and consequently microclimate control. Besides, to
effectively design fresh airflow rate for improving IAQ, Mui and Chan (2006) proposed Demmand Control Ventilation (DCV) which focusses on the number of people instead of CO2 concentration level indoor to provide fresh air. However, this
is can lead to the adverse effect of occupant’s health if the level of CO2 exceed the
TLV. Hence, there is a need further research to improve it.
However, in investigating IAQ some researchers found a number of limitations as attached in APPENDIX A namely: the discrepancy between the results of IAQ physical measurement and the IAQ as experienced by occupant (Bluyssen, 2009; Yua et al., 2009; Frontczak and Wargocki, 2011; Kamaruzzaman et al., 2011). For example when the measurement results show the acceptable condition of IAQ measured as compared to standard, the building’s occupants are still unacceptable, and even unhealthy that leads to comfort problem. This problem may be due to the standard established is only to regulate for the industrial environment (Rios et al., 2009). The standard which commonly used such as NIOSH and ASHRAE are guideline mainly developed on the basis of empirical research and laboratory studies, which have not sufficiently dealt with the rapidly changing work environment (Choi et al., 2012) and every single IAQ parameter may lead to the different subjective responses (Frontczak and Wargocki, 2011). Additionaly, indoor environment study is
2.2.1 Particulate Matter (PM)
In the last decade, a number of epidemiological studies have clearly indicated that urban air pollution not only can adversely impact to human health (Brunekreef and Holgate, 2002) but also socioeconomic impact (Hays et al, 1995). Subsequently, ambient Particulate Matter (PM) either characterized as coarse particle for the diameter of particles less than 10 µm (PM10) or fine particle for the diameter of
particles less than 2.5 µm (PM2.5) (Fierro, 2001; Zhang, 2005; Hanapi and Din, 2012) are considered as the main cause (Karakatsani et al., 2012). The comparisons of these two particles are attached in APPENDIX A.
According to Fierro (2001), PM is a complex mixture of extremely small solids and liquid droplets. It is made up of a number of components, including acids (such as nitrates and sulphates), organic chemicals, metals and soil or dust particles. Identification of sources of particulate contaminants in an indoor environment is important for implementation of appropriate air quality control strategies (Zhang, 2005; Massey et al., 2012). According to Yua et al. (2009), indoor particle pollutant sources can be divided into indoor pollution sources and outdoor pollution sources. Outdoor particles penetrate into indoor air environment through the aperture of doors and windows, and the fresh air of air-conditioning system.
2.2.2 Gas Pollutants
Gases are identified as having potentially significant effects on humans or our environment, and there are six gases which are affect the source of indoor pollutant such as : Carbon Monoxide (CO), Carbon Dioxide (CO2), Nitrogen Oxide (NO),
Nitrogen Dioxide (NO2), Sulfur Dioxide (SO2), and Methane (CH4) (Hays et
al.,1995).
Carbon Monoxide (CO), is a colourless, odourless, and tasteless gas which is produced from the incomplete combustion of any carbon-containing fuel (Hays et
O2 and CO are present, hemoglobin will not be available to carry O2 to the tissues.
However, Yau et al. (2012) found that indoor CO concentrations were lower than those of outdoors.
Carbon Dioxide (CO2), according to Hays et al. (1995), CO2 is a colourless,
odourless gas and categorized as simple asphyxiant gas. The use of Carbon Dioxide (CO2) as an indicator of IAQ and as a tracer gas to estimate air exchange rates in
buildings are widely applied by many researchers nowadays (Gupta et al., 2007; Mahyuddin & Awbi, 2010) and it also varied linearly with Sick Building Syndrome
symptoms (Gupta et al., 2007). The benefit from using CO2 as a tracer gas is due to
its low cost and safety consideration.
In office, the primary source of CO2 is respiration from the building’s
occupants (Apte et al., 2000; Erdman et al., 2002) and its concentrations are in range of 350 to 2,500 ppm (Seppanen et al., 1999). The common recent standards (ASHRAE, 1999, 2001, 2004) recommend that the difference between indoor-outdoor of CO2 should not exceed 700 ppm. However, in Malaysia the Threshold
Limit Value for CO2 during 8 hours is 1000 ppm (DOSH Malaysia, 2010)
Nitric Oxide (NO), there are many chemical species of the oxides of nitrogen (NOx), but nitrogen dioxide (NO2) and nitric oxide (NO) are of greatest concern as
indoor air contaminants (Hays et al., 1995). However, its database of toxicological and health effects is somewhat limited.
Nitrogen Dioxide (NO2), is a deep lung irritant which has been shown to result in biochemical alterations and histologically demonstrable lung damage (Hays et al.,1995). Subsequently, in human, 80 to 90 percent of NO2 can be absorbed upon
inhalation.
The major of outdoor sources of NO2 concentrations are mobile and
stationary combustion sources (U. S. EPA, 2000), whereas indoor source include gas
cookers, wood stoves, fireplaces, and environmental tobacco smoke (ETS). NO2 is
formed from the combination of Nitrogen (N) and Oxigen (O2) during high
temperature combustion processes (Brunekreef et al., 2002) and it also often found at higher concentrations indoors than outdoors (Lee, et al., 2002). In some indoor environments such as industrial workplaces and home with gas stoves, peak concentrations may reach 1 to 2 ppm with 24 hours averages of NO2 concentration
increase susceptibility to airway infections and impair lung function in exposed populations (Curtis et al., 2006).
Sulfur Dioxide (SO2) is a colourless gas with a strong pungent odour and the odour can be detected at about 0.5 ppm (Hays et al.,1995). Although exposure to SO2
has not been shown to cause cancer in humans, there are serious health problems related to exposure time both both in long term and short term (U. S. EPA, 2000).
Generally, exposures to SO2 cause a burning sensation in the nose and throat.
Subsequently, SO2 exposure can cause difficulty breathing, including changes in the
body’s ability to take a breath or breathe deeply, or take in as much air per breath.
Short term exposure to high enough levels of SO2 can be life threatening and long
term exposure to SO2 can cause changes in lung function and aggravate existing
heart disease.
Methane (CH4) is a colourless, tasteless gas that is the primary component of natural gas (Lee et al., 2002). CH4 is produced naturally by volcanoes, ruminant
animals such as cattle and sheep, decaying plants, extraction of natural gas, coal mining, waste disposal and also a major greenhouse gas that results from such human activities (Lee et al., 2002). The Intergovernmental Panel on Climate Change (IPCC) reports wide ranges in the anthropogenic CH4 emissions that are partly due to urban
areas (IPCC, 2006), while 15% to 40% of them has been estimated to derive from gas and oil production, industry sector, landfills, and waste treatment (Denman et al., 2007). In industry, methane is used to refine petrochemicals and in power stations to drive turbines to create electricity (Lee et al., 2002). Generally, public may be exposed to very low levels when breathing in air. Occupational exposure to methane may occur in the workplace where it is extracted, produced or used. If exposed to CH4, the potential adverse health effect that may occur depend on the way people are
exposed and the amount to which they are exposed. High levels of CH4 can displace
2.2.3 Temperature and Humidity
Indoor temperature is considered as indoor environment factors that affect to comfort and health of human and it becomes the most attention for common people (Huang et al., 2012). According to The Government of The Hongkong Special Administrative Region Indoor Air Quality Management Group (2003), indoor temperature is influenced by factors such as the temperature control of air-conditioning, solar heat
gain, and other indoor heat sources such as lighting, electrical equipment, computers and water heaters and humidity. Consideration should also be given to variations in temperature within rooms served by a single thermostat. Temperature between rooms or locations within a room may vary due to large window areas or large vertical surfaces. Besides, a comfort of indoor temperature will be gained in the range temperature of 20°C to 26°C (DOSH Malaysia, 2010). However, according to (Rahman and Kannan, 1996; Yau et al., 2011) temperature standard in Malaysia is in the range of 29 ºC - 34ºC.
As a parameter related with temperature, humidity influences thermal comfort by affecting the human body’s ability to lose body heat through perspiration.
2.2.4 Air movement
A certain amount of air movement around the human body is essential for thermal comfort and also important in dispersing air pollutants. The required level of airflow depends on the air temperature and humidity. In the hot and humid summer months, for example, greater air movement can help produce a more comfortable environment.
Airflow is determined by ventilation and convection currents which is affected by hot air rising and cool air failing in a room (The Government of The Hongkong Special Administrative Region Indoor Air Quality Management Group, 2003). Blocked or unbalanced ventilation systems, or too low pressure levels in ventilation ducts may restricts air movement, producing a “stuffy” atmosphere which makes occupants feel uncomfortable.
2.3 Ventilation
Basically, ventilation is employed for supplying fresh air into room or building and distributes it (WHO, 2009) for providing healthy air to indoor occupants (Etheridge and Sandberg, 1996a; Awbi, 2003). There are three basic parameters of building ventilation for assessing the ventilation performance such as: ventilation rate, airflow direction, and air distribution or airflow pattern. Each of those categories is depended with the types of ventilation which can be broadly categorized into natural ventilation and mechanical ventilation. However, since the ORICC office uses mechanical ventilation, the following sub only focusses on mechanical ventilation.
2.3.1 Mechanical Ventilation
Mechanical ventilation supplying air into room or building by using mechanical fans (WHO, 2009). Air-Conditioning is one of mechanical ventilation systems widely
installed and maintained there are some advantages as compared to natural ventilation are as follows: (Awbi, 2003)
1. Mechanical ventilation systems are considered to be reliable in delivering the designed flow rate, regardless of the impacts of variable wind and ambient temperature. As mechanical ventilation can be integrated easily into
air-conditioning, the indoor air temperature and humidity can also be controlled. 2. Filtration system can be installed in mechanical ventilation so that harmful
microorganisms, particulates, gases, odours and vapours can be removed. 3. The airflow path in mechanical ventilation systems can be controlled, for
instance allowing the air to flow from areas where there is a source (e.g. patient with an airborne infection), towards the areas free of susceptible individuals.
4. Mechanical ventilation can work everywhere when electricity is available.
However, there’re also several drawbacks from usage of mechanical
ventilation: (WHO, 2009).
1. Mechanical ventilation systems often do not work as expected, and normal operation may be interrupted for numerous reasons, including equipment failure, utility service interruption, poor design, poor maintenance or incorrect management (Dragan, 2000). If the system services a critical facility, and there is a need for continuous operation, all the equipment may have to be backed up which can be expensive and unsustainable.
2. Installation and particularly maintenance cost for the operation of a mechanical ventilation system may be very high. If mechanical ventilation
system cannot be properly installed or maintained due to shortage of funds, its performance will be compromised.
SPLIT UNIT
According to Sekhar (2004) and Hussin et al. (2014), a split unit system of air-conditioning widely contributes to the high concentration level of CO2 as compared
is inadequate to distribute air (Kumlutaş et al., 2013) and the filter of the air-conditioner that had not work properly (Yousef et al., 2013). Subsequently, the Air-Conditioning split unit is depicted in Figure 2.1.
2.4 Sick Building Syndrome (SBS)
According to (Berardil et al., 1991), SBS has become an issue in Malaysia due to the construction of buildings designed to be energy-efficient with air-conditioning system, yet poor maintenance and services of Heating, Ventilation and Air-Conditioning (HVAC) system resulting the increasing of indoor air pollutant.
From researcher’s point of view, SBS is defined as situation in which
building’s occupants experience acute health-or comfort-related effects that seem to be linked directly to the time spent in the building (Joshi, 2008), without a clear cause reported by building’s occupants (Israeli and Pardo, 2011). Additionally, Burroughs and Hansen (1991), mentioned the number in percentage to determine whether a building had experienced of SBS, in which at least 20 percent of the building’s occupants display symptoms of illness more than 2 weeks, and the source of these illnesses cannot be positively identified. One of the reasons that SBS is so difficult to be investigated is that the symptoms can relatively resulted from a variety of causes (Milica and Jasminka, 2009). According to Godish (1995), building occupants that experienced with SBS symptoms frequently complain about the following:
Nose and throat: dryness, stuffiness, irritation of the mucous membrane, runny nose, sneezing, odour, taste sensations.
Eyes: dryness, itching, irritation, watery eyes.
Skin: dryness and irritation, rash, itching, eczema, erythematic, localized
swelling.
General: tight-chest, abnormal fatigue, malaise, headache, feeling
heavy-headed, lethargy, sluggishness, dizziness, nausea.
Additionally, the World Health Organization (1983) recognized sick building syndrome to exist in all types of non-occupational buildings and non-industrial occupational buildings. Those symptoms are identified as follows:
i. Eye, nose and throat irritation.
ii. Sensation of dry mucous membranes and skin. iii. Erythema.
v. Headaches, high frecuency of airway infections and cough. vi. Hoarseness, wheezing, itching, and unspesific hypersensitivity. vii. Nausea & dizziness.
Furthermore, a number of extensive studies had been conducted to determine the IAQ parameters that are triggering to the occurrence of SBS by various researchers as attached in APPENDIX A.
Factors Associated with Sick Building Syndrome
On the risk factors associated with sick building syndrome, Hedge et al. (1992) suggested a multiple risk model that consist of several groups of risk factors interact with each other, impose a total stress load on building occupants and mediate complaints of sick symptoms. The risk factors include:
i. Direct environment risk (e.g. exposure to pollutants).
ii. Indirect environmental risks (e.g. workers satisfaction with thermal conditions).
iii. Occupational risk (e.g. job stress).
iv. Individual risks (e.g. gender, age, personality).
Lahtinen et al. (1998), suggested that sick building syndrome most likely is multi-factorial origin related to chemical, physical, biological and psychosocial factors that interact or coincide with one another. Psychosocial factors may serve as
moderators or mediators in the process, either increasing or decreasing the vulnerability of the individual to environmental exposures, or as outcomes in a situation where the subject is compelled to work in a contaminated environment.
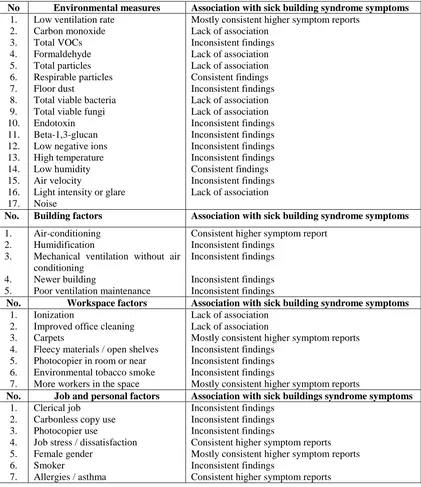
total viable bacteria, total particles, air velocity, carbon monoxide, formaldehyde and noise. Mendel (1993), reported that for some of the factors the findings were too inconsistent or sparse for simple interpretation. These factors are listed in Table 2.1.
Table 2.1: Summary of reported associations between work-related symptoms and various environmental factors and measurements from studies.
No Environmental measures Association with sick building syndrome symptoms
1. 2. 3. 4. 5. 6. 7. 8. 9. 10. 11. 12. 13. 14. 15. 16. 17.
Low ventilation rate Carbon monoxide Total VOCs Formaldehyde Total particles Respirable particles Floor dust
Total viable bacteria Total viable fungi Endotoxin Beta-1,3-glucan Low negative ions High temperature Low humidity Air velocity
Light intensity or glare Noise
Mostly consistent higher symptom reports Lack of association
Inconsistent findings Lack of association Lack of association Consistent findings Inconsistent findings Lack of association Lack of association Inconsistent findings Inconsistent findings Inconsistent findings Inconsistent findings Consistent findings Inconsistent findings Lack of association
No. Building factors Association with sick building syndrome symptoms
1. 2. 3. 4. 5. Air-conditioning Humidification
Mechanical ventilation without air conditioning
Newer building
Poor ventilation maintenance
Consistent higher symptom report Inconsistent findings
Inconsistent findings
Inconsistent findings Inconsistent findings
No. Workspace factors Association with sick building syndrome symptoms
1. 2. 3. 4. 5. 6. 7. Ionization
Improved office cleaning Carpets
Fleecy materials / open shelves Photocopier in room or near Environmental tobacco smoke More workers in the space
Lack of association Lack of association
Mostly consistent higher symptom reports Inconsistent findings
Inconsistent findings Inconsistent findings
Mostly consistent higher symptom reports
No. Job and personal factors Association with sick buildings syndrome symptoms
1. 2. 3. 4. 5. 6. 7. Clerical job
Carbonless copy use Photocopier use
Job stress / dissatisfaction Female gender
Smoker
Allergies / asthma
Inconsistent findings Inconsistent findings Inconsistent findings
Consistent higher symptom reports Mostly consistent higher symptom reports Inconsistent findings
Consistent higher symptom reports
clearly established, and no conclusion can be drawn on any definite correlation of the symptoms and the potential causative factors.
The symptoms of SBS are difficult to be diagnosed as they are dominated by sensory reactions about which very little is known even from the medical point of view. However, a number of SBS symptoms commonly used from many researchers are tabulated as in APPENDIX A.
2.5 Productivity
Indoor environmental conditions may directly influence to the performance of physical and mental work, without affecting health symptoms (Fisk, 2011). Improving the work environment including IAQ is an effective strategy to improve productivity of building’s occupants (Clements and Baizhan, 2000; Mahbob et al., 2011). According to Rogers (1998), productivity is defined as the ratio of output to input for a specific production situation. Meanwhile, Pritchard (1995) defined productivity in three categories. The first is from the economist or engineer definition, where the productivity is an efficiency measure: the ratio of outputs over inputs, where both usually are expressed in dollar terms. The second definition of productivity is a combination if efficiency (outputs/inputs) and effectiveness (output goals). The third definition of productivity is the broadest and considers productivity as anything that makes the organization function better. In this definition, productivity would include efficiency and effectiveness, but also things like absenteeism, turnover, morale, innovation, etc.
2.5.1 IAQ Affecting Productivity
According to Wyon (2004), the first of experiments series was carried out in 1999 by researchers at The International Centre for Indoor Environment and Energy (ICIEE) at the Technical University of Denmark (DTU). It indicated that indoor pollution may cause a reduction in the performance of office tasks and thus revealing a new
that may cause health effect (respiratory, skin, nausea, nasal) among building occupants, and lead to the decrement of occupant’s motivation.
A numerous extensively studies from various researchers regarding the effect of IAQ towards productivity has been summarized in APPENDIX A. To investigate the effect of IAQ on productivity, most of researchers used several types of circumstances which are laboratory experiments (Wargocki and Wyon, 2000;
Kosonen and Tan, 2004), real study during office hour (Khalil & Husin, 2000; Federspiel et al., 2002; Fisk et al., 2002; Kamaruzzaman and Sabrani, 2011; Mahbob et al., 2011) and both of those two circumstances (Wyon, 2004; Antikainen et al., 2008). The results indicated that the combination study between real study and laboratory study are the proper approaches since the study from real study could be validated in laboratory experiments for determine the affecting factors. Subsequently, the IAQ parameters that affect the occupant’s productivity are temperature, relative humidity, pollution load (CO2), CO, Particulate Matter (PM), air velocity, ventilation
rate, Ozone (O3), SO2, Formaldehyde and Radon. However, occupant’s productivity
can be assessed through its working performance, which requires concentration, such as text typing, proof reading, etc (Wargocki & Wyon, 2000; Federspiel et al., 2002; Kosonen & Tan, 2004; Wyon, 2004; Antikainen et al., 2008; Mahbob et al., 2011).
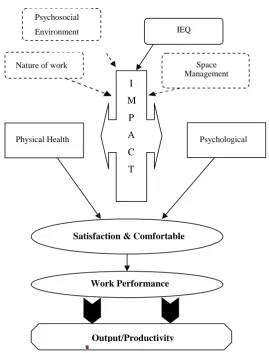
According to Rotundo (2002), working performance was defined as actions that contribute to organizational goals and that are under the individual’s
Work Performance
2.6 Computer Modelling and Simulation in IAQ Study
The study of IAQ through modelling and simulation has attracted various number of researchers. Those researchers also used a various types of modelling and simulation
softwares as follows: Glantz and Rishel (2007), CONTAM is used for study the IAQ impact associated with ventilation in large mechanically-ventilated buildings. Additionally, this software is a multi-zone indoor air quality and ventilation analysis computer program designed to determine the followings: (Walton and Dols, 2013)
Airflows & pressures (infiltration, exfiltration, and room-to-room airflows in
building system driven by mechanical means, wind pressure acting on the I
M
P
A
C
T
Nature of work Psychosocial
Environment IEQ
Space Management
Physical Health Psychological
Satisfaction & Comfortable
[image:39.595.168.438.111.465.2]Output/Productivity
exterior of the building, and buoyancy effects induced by the indoor and outdoor air temperature difference.
Contaminants concentrations: the dispersal of airborne contaminants transported
by these airflows; transformed by a variety of processes including chemical an radio-chemical transformation, adsorption and desorption to building materials, filtration, and deposition to building surfaces, etc; and generated by a variety of source mechanisms.
Personal exposure: The predictions of exposure of building occupants to
airborne contaminants for eventual risk assessment.
The other software for IAQ modelling and simulation is COMIS (Huang, et al., 1999). This software is a network-based multi-zone airflow model developed by a multinational team in the framework of International Energy Agency’s Annex 23
for simulating airflows through the building fabric due to infiltration or natural ventilation and from zone to zone, as well as the interactions of the HVAC system,
[image:40.595.110.529.484.711.2]ducts, and exhaust hoods and fans. To simulate multi-zone airflow, COMIS requires the following inputs as highlighted in Table 2.2.
Table 2.2: Input requirements for COMIS simulation of multi-zone airflow (Huang et al., 1999)
Crack airflow element
Window or door
airflow element Zone Link
Facade element Pressure Coefficie nt (Cp) Meteorologic al Data Flow
coefficient (Cs)
Flow expo-nent (n)
Flow coefficient
for closed
windows
Flow exponent (n)
Type of large vertical opening
Width
Height
Schedule for window/door
opening and
closing
Reference Height
Volume
Temperatu re*
Humidity*
Element name
Zone from-to
Height from-to
Element number
Relative horizont al position
Relative vertical position
Facade element number
Cp value by wind direction
Temperature*
Humidity*
Wind speed*
Wind direction*
REFERENCES
Abadie, M. O., and Limam, K. (2007). Numerical evaluation of the particle pollutant homogeneity and mixing time in a ventilated room. Building and Environment,
42(11), 3848–3854. Retrieved from
http://dx.doi.org/10.1016/j.buildenv.2006.11.010.
Aizat, S., Juliana, Norhafizalina, O., Azman, Z. A., and Kamaruzaman, J. (2009). Indoor Air Quality and Sick Building Syndrome in Malaysian Buildings. GLobal Journal of Health Science, 1(2), 126–135.
American Society of Heating, Refrigeration and Air-Conditioning Engineers (ASHRAE). (1999). Ventilation for Acceptable Indoor Air Quality (Vol. 1999). Atalanta, USA.
American Society of Heating, Refrigeration and Air-Conditioning Engineers (ASHRAE). (2001). Ventilation for acceptable indoor air quality. Atalanta, USA.
American Society of Heating, Refrigeration and Air-Conditioning Engineers (ASHRAE). (2004). Ventilation for acceptable indoor air quality. Atalanta, USA.
Anderson, R. (1998). Ventilation efficiency: analytical methods, scaling theory, and experimental techniques. In in Proceedings of the Conference on Building Systems: Room Air and Air Contaminant Distribution. (pp. 195–199). ASHRAE.
Antikainen, R., Lappalainen, S., Lonngvist, A., Maksimainen, K., Reijula, K., and Rausa, E. U. (2008). Exploring the relationship between indoor air and productivity (pp. 79–82).
Apte, M. G., Fisk, W. J., and Daisey, J. M. (2000). Association between indoor CO2
concentrations and Sick Building Syndrome in U.S. office buildings: An analysis of the 1994-1996 base study data. Indoor Air, (10), 246–257.
Awbi, H. B. (2003). Ventilation of buildings. (2nd ed., Vol. 38). New York: Taylor & Francis.
Berardil, B. M., Leoni, E., Marchesini, B., Cascella, D., and Raffil,. G. B. (1991). Indoor climate and air quality in new offices: effects of a reduced air-exchange rate. International Archives of Occupational and Environmental Health, 63, 233–239.
Bluyssen, P. M. (2009). Towards an integrative approach of improving indoor air quality. Building and Environment, 44(9), 1980–1989. doi:10.1016/j.buildenv.2009.01.012
Brown. (2001). Using Surveys in Language Programs. Cambridge: Cambridge University Press.
Brunekreef, B., and Holgate, S. T. (2002). Air pollution and health. Lancet, 360(9341), 1233–1242. doi:10.1016/S0140-6736(02)11274-8
Bryman, A., and Cramer, D. (2002). Quantative Data Analysis with SPSS Release 10 for Windows, (2nd ed., Vol. 3). Taylor and Francis inc.
Buggenhout, S. V., Vranken, E., Schuysemans, S., Lemaire, J., Malcot, W. V., Breckmans, D. (2005). On-line airflow pattern measurement in ventilated buildings.pdf. Building and Environment, (40).
Burge, P. S. (2004). Sick building syndrome. Occupational and Environmental Medicine, 61(2), 185–190. doi:10.1136/oem.2003.008813.
Burroughs, H. E., and Hansen, S. J. (1991). Managing Indoor Air Quality. Journal of the Institute of Heating and Ventilating Engineers (Vol. 34). London, UK: CRC Press Taylor & Francis Group.
Chen, A., and Chang, W. C. (2012). Human health and thermal comfort of office workers in Singapore. Building and Environment, 58, 182–178.
Cheong, K. W. D., Yu, W. J., Tham, K. W., Sekhar, S. C., and Kosonen, R. (2006). A study of perceived air quality and sick building syndrome in a field environment chamber served by displacement ventilation system in the tropics. Building and Environment, 41(11), 1530–1539. doi:10.1016/j.buildenv.2005.06.003.
Choi, J., Loftness, V., and Aziz, A. (2012). Post-occupancy evaluation of 20 office buildings as basis for future IEQ standards and guidelines. Energy & Buildings, 46, 167–175. doi:10.1016/j.enbuild.2011.08.009.
Chuen, L. K. (2010). The Concept of Safe Indoor Air Quality for The Management of Indoor Environment in Immune Buildings. Hong Kong Polytechnic University: Ph.D Dissertation.
Clements-croome, D., and Baizhan, L., (2000). Productivity and indoor environment. In Proceedings of Healthy Buildings 2000 (Vol. 1, pp. 629–634).
Cohen, J. (1988). Statistical power analysis for the behavioral sciences (2nd ed., Vol. 3). United States of America: McGraww-Hill.
COMSOL Multiphysics AB (2007). COMSOL Multiphysics User Guide. United States of America.
COMSOL Version 4.3. (2012a). Comsol Multiphysics V. 4.3 User’s Guide. United States of America.
COMSOL Version 4.3. (2012b). The CFD Module User’s Guide. COMSOL AB, United States of America.
Critical Environment Technologies, (2012). YES Plus LGA Manual Instruction.
Curtis, L., Rea, W., Smith-Willis, P., Fenyves, E., and Pan, Y. (2006). Adverse Health Effects of Outdoor Air Pollutants. Environment International, 32: 815 - 830.
Daoud, A., and Galanis, N. (2008). Prediction of airflow patterns in a ventilated enclosure with zonal methods. Applied Energy, 85(6), 439–448. doi:10.1016/j.apenergy.2007.10.002
Davis Instruments. (2008). Standard Anemometer Installation Manual.
Denman, K. L., Brasseur, G., Chidthaisong, A.,Ciais, P., Cox, P. M., Dickinson, R. E., Hauglustaine, D., Heinze, C., Holland, E., Jacob, D. (2007). The Physical Science Basis Contribution of Working Group I to fourth Assessment Report of The Intergovernmental Panel on Climate Change. Cambridge University Press, Cambridge, United Kingdom. and New York, NY, USA.
Department of Occupational Safety and Health (DOSH) Malaysia. (2010). Industry Code Of Practice On Indoor Air Quality.
Department of Statistic Malaysia. (2013). Compendium of Environment Statistics Malaysia 2013.
Dutton, S. M., Banks, D., Brunswick, S. L., and Fisk, W. J. (2013). Health and economic implications of natural ventilation in California offices. Building and Environment, 67, 34–45. doi:10.1016/j.buildenv.2013.05.002.
Environmental Protection Agency. (1991). Indoor Air Facts No. 4 (revised) Sick
Building Syndome. Retrieved from
www.epa.gov/iaq/pdfs/sick_building_factsheet.pdf Accessed 19 October 2013.
Erdman, C. A., Steiner, K. C., and Apte, M. G. (2002). Indoor Carbon Dioxide concentrations and Sick Building Syndrome symptoms in the base study revisited : Analyses of the 100 building dataset. In Indoor air (pp. 443–448).
Etheridge, D., and Sandberg M. (1996a). Building ventilation - theory and measurement. Building ventilation - theory and measurement. Chicester, UK: John Wiley & Sons.
Fadilah, N. R., and Juliana, J. (2012). Indoor Air Quality ( IAQ ) and Sick Buildings Syndrome ( SBS ) among Office Workers in New and Old Building in Universiti Putra Malaysia, Serdang. Health and the Environmental Journal, 3(2), 98–109.
Fangwei, L., and Longzhe, Ji., (2010). Application of COMSOL Multiphysics Numerical Simulation Method on Dust Control. International Conference on Computer Application and System Modeling (ICCASM)
Federspiel, C., Liu, G., Lahiff, M., Faulkner, D., Dibartolomeo, D., Fisk, W., Price, P., and Sullivan, D. (2002). Worker Performance and Ventilation: Analysis of Individual Data for Call-Center Workers. In Indoor Air 2002 Conference (pp. 1–6).
Fierro, M. (2001). Particulate matter. Energy and Buildings, 36(10), 881–892.
Finnegan, M. J., Pickering, C. A., and Burge, P. S. (1984). The sick building syndrome: prevalence studies. British Medical Journal (Clinical Research Ed.),
289, 1573–1575. Retrieved from
http://www.ncbi.nlm.nih.gov/pubmed/10448996.
Fisk, W. J., Price, P. N., Faulker, D., Sullivan, D. P., Dibartolomeo, D. L., Federspiel, C. C., Liu, G., and Lahiff, M. (2002). Worker Performance and Ventilation : Analyses Of Time-Series Data For A Group Of Call-Center Workers. In Indoor Air. Monterey, CA, June 30 - July 5.
Frontczak, M., and Wargocki, P. (2011). Literature survey on how different factors influence human comfort in indoor environments. Building and Environment, 46(4), 922–937. doi:10.1016/j.buildenv.2010.10.021.
Gallego, E., Roca, X., Perales, J. F., and Guardino, X. (2009). Determining indoor air quality and identifying the origin of odour episodes in indoor environments. Journal of Environmental Sciences, 21(3), 333–339. doi:10.1016/S1001-0742(08)62273-1.
Glantz, C., and Rishel, J. (2007). Indoor Air Quality Modeling : Basic Information to Support Biosafety Applications. Emergency Management Roundup
Godish, T. (1995). Sick Buildings: Definition, Diagnosis and Mitigation, Lewis, Ann Arbor.
Goyal, R., and Khare, M. (2010). Indoor Air Quality and Ventilation Modeling. Air Quality Modelling, (June), 1–2.
Guerfala, N., Fellouah, H., Daoud, A., and Galanis, N. (2012). Air flow prediction and evaluation of ventilation effectiveness with different zonal configurations. In International Conference of Renewable Energies and Power Quality (pp. 4– 9). Santiago de Compostela, Spain: European Association for The Development of Renewable Energies Environment and Power Quality.
Guo, P., Yokoyama, K., Piao, F., Sakai, K., Khalequzzaman, M., Kamijima, M., and Kitamura, F. (2013). Sick building syndrome by indoor air pollution in Dalian, China. International Journal of Environmental Research and Public Health, 10(4), 1489–504. doi:10.3390/ijerph10041489
Gupta, S., Khare, and M., Goyal, R. (2007). Sick building syndrome—A case study in a multistory centrally air-conditioned building in the Delhi city. Building and Environment, (42), 2797–2809.
Hanapi, N., and Din, S. A. M. (2012). A Study on the Airborne Particulates Matter in Selected Museums of Peninsular Malaysia. Procedia - Social and Behavioral Sciences, 50(July), 602–613. doi:10.1016/j.sbspro.2012.08.063
Hays, M. S., Gobbell, R. V., and Nicholas, R. (1995). Indoor Air Quality solutions and strategies. United States of America: McGraww-Hill.
Hedge, A., Erickson, W. A., and Rubin, G. (1992). Effects of Personal and Occupational Factors on SBS Reports in Air-Conditioned Offices. American Psychological Association, pp 286 - 298.
Huang, J., Winkelmann, F., Buhl, F., Pedersen, C., Fisher, D., Liesen, R., Taylor, R., Strand, R., and Crawley, D. (1999). Linking The COMIS Multi-Zone Airflow Model with The Energy Plus Building Energy Simulation Program (pp. 1–6). USA.
Huang, L., Zhu, Y., Ouyang, Q., and Cao, B. (2012). A study on the effects of thermal, luminous, and acoustic environments on indoor environmental comfort in offices. Building and Environment, 49, 304–309. doi:10.1016/j.buildenv.2011.07.022
Hummelgaard, J., Juhl, P., Sæbjörnsson, K. O., Clausen, G., Toftum, J., and Langkilde, G. (2007). Indoor air quality and occupant satisfaction in five mechanically and four naturally ventilated open-plan office buildings. Building and Environment, 42(12), 4051–4058. doi:10.1016/j.buildenv.2006.07.042
Hussin, M., Ismail, M. R., and Ahmad, M. S. (2014). Air-conditioned university laboratories: Comparing CO2 measurement for centralized and split-unit systems. Journal of King Saud University - Engineering Sciences. doi:10.1016/j.jksues.2014.08.005
IPCC (2006). "Guidelines for National Greenhouse Inventories. Energy, vol. 2. IGES, Hayama, Japan.
Israeli, E., and Pardo, A. (2011). The sick building syndrome as a part of the autoimmune ( auto-inflammatory ) syndrome induced by adjuvants. Mod Rheumatol, 21:235–239. doi:10.1007/s10165-010-0380-9
Jaakola, J. J. K., Heinonen, O. P., and Seppanen, O. (1989). Sick Building Syndrome, sensation of dryness and thermal comfort in relation to room temperature in an office building: need for individual control of temperature. Environ. Int., (15), 163–168.
Joshi, S. M. (2008). The sick building syndrome. Indian Journal of Occupational and Environmental Medicine, 12(2), 61–64. doi:10.4103/0019-5278.43262
Judkoff, R., Wortman, D., Doherty, B. O., and Burch, J. (2008). A Methodology for Validating Building Energy Analysis Simulations.
Kagi, N., Fuji, S., Horiba, Y., Namiki, N., Ohtani, Y., Emi, H., Tamura, H., and Kim, Y. S. (2007). Indoor air quality for chemical and ultrafine particle contaminants from printers. Building and Environment, (42), 1949–1954.
Kamaruzzaman, S. N., and Sabrani, N. A. (2011). The Effect of Indoor Air Quality ( IAQ ) Towards Occupants ’ Psychological Performance in Office Buildings. Design + Built, 4(2001), 49–61.
Karakatsani, A., Analitis, A., Perifanou, D., Ayres, J. G., Harrison, R. M., Kotronarou, A., and Katsouyanni, K. (2012). Particulate matter air pollution and respiratory symptoms in individuals having either asthma or chronic obstructive pulmonary disease: a European multicentre panel study. Environmental Health : A Global Access Science Source, 11, 75. doi:10.1186/1476-069X-11-75
Kawamura, K., Kerman, K., Fujihara, M., Nagatani, N., Hashiba, T., and Tamiya, E. (2005). Development of a novel hand-held formaldehyde gas sensor for the rapid detection of sick building syndrome. Sensors and Actuators B: Chemical, 105(2), 495–501. doi:10.1016/j.snb.2004.07.010
Khalil, N., and Husin, H. N. (2000). Post Occupancy Evaluation towards Indoor Environment Improvement in Malaysia ’ s Office Buildings, 2(1), 186–191.
Koenigsberger, O. H., et al. (1974). Manual of Tropic and Housing Building Part I: Climatic Design (Vol. 15). London: Longman.
Kosonen, R., and Tan, F. (2004). The effect of perceived indoor air quality on productivity loss. Energy and Buildings, 36(10), 981–986. doi:10.1016/j.enbuild.2004.06.005
Kumlutaş, D., Karadeniz, Z. H., and Kuru, F. (2013). Investigation of fl ow and heat transfer for a split air conditioner indoor unit. Applied Thermal Engineering, 51(1-2), 262–272. doi:10.1016/j.applthermaleng.2012.08.051
Lahtinen, M., Huuhtanen, P., and Reijula, K. (1998). SBS and Psychosocial Factors - A Literature Review. Indoor Air, vol. 8, sup. 4, pp 71 - 80.
Lan, L., Lian, Z., Pan, L., and Ye, Q. (2009). Neurobehavioral approach for evaluation of office workers’ productivity: The effects of room temperature. Building and Environment, 44(8), 1578–1588. doi:10.1016/j.buildenv.2008.10.004
Lan, L., Wargocki, P., and Lian, Z. (2011). Quantitative measurement of productivity loss due to thermal discomfort. Energy and Buildings, 43(5), 1057–1062. doi:10.1016/j.enbuild.2010.09.001
Lee, J. T., Kim, H., Song, H., Hong, Y. C., Cho, S. Y., Shin, S. Y., Hyun, Y. J., and Kim, Y. S. (2002). Air Pollution and Asthma Among Children in Seoul, Korea. Epidemiology, vol. 13, pp/.481 - 484.