Journal of Chemical and Pharmaceutical Research, 2018, 10(5): 61-66
Research Article
CODEN(USA) : JCPRC5
ISSN : 0975-7384
61
A New Derivative Spectroscopic method for the Estimation of Axitinib and
Everolimus in Bulk and Physical Mixture
Ranjeetha M*, Niranjan M S, Chaluvaraju K C, Mamatha M, Darshitha R, Varsha C
Department of Pharmaceutical Chemistry, Government College of Pharmacy, Bengaluru-560 027 _____________________________________________________________________________
ABSTRACT
A new precise and reliable first derivative spectroscopic method for Axitinib and Everolimus has been developed
by using UV visible spectrophotometry in bulk and physical miture. The absorption maxima are 303 nm and
267.20 nm for Axitinib and Everolimus respectively in double distilled water. Different concentrations of drugs
were scanned in the range of 200-400 nm, and the resulted graphs were converted into first order derivative
spectra by using UV probe version software 2.43. These spectra of Axitinib and Eerolimus were overlaid and the
Zero crossing (Zero absorbance) were determined, where Axitinib shows Zero absorbance at 213.40 nm but
Everolimus shows absorbance at 213.40 nm. Also Everolimus shows Zero absorbance at 246.30 nm but Axitinib
shows absorbance at 246.30 nm. These results correlates with the absorbance of physical mixture at 213.40 nm
proportional to the concentration of Everolimus and the absorbance at 246.30 nm proportional to the
concentration of Axitinib respectively. The linearity was found to be in the range of 5 to 35 µg/ml with
correlation co-efficient of 1 for Axitinib and Everolimus independently.
Keywords: Axitinib; Everolimus; Derivative spectroscopy; Absorption maxima; UV-Visible
_____________________________________________________________________________
INTRODUCTON
Axitinib is chemically N-methyl-2-[[3-[(E)-2-pyridin-2-ylethenyl]-1H-indazole-6-yl]sulfanyl]benzamide Figure 1[1]. Its molecular formula is C22H18N4OS and molecular weight is 386.473g/mol. It is soluble in aqueous solvents and organic
solvents such as acetonitrile, methanol, acetone, chloroform etc., Axitinib is used as an Anticancer Drug. Its mechanism of action is to inhibit tyrosine kinase.
N
N
N
N
N
N N
NH2 O
O
CH3
CH
CH3
Figure 1; Chemical structure of Axitinib
hexatriaconta-16,24,26,28-tatraene-62
2,3,10,14,20-pentone Figure 2 [2-3]. Its molecular formula is C55H83NO14 and molecular weight is 958.24g/mol. It is
completely soluble in organic solvents such as acetomitrile, methanol, acetone, chloroform and poorly soluble in aqueous solvents. Everolimus is used as an Anticancer Drug. It acts by inhibiting protein kinase, Cytochrome P450 3A4 and P-Gylcoprotein. However, these two drugs are used in the treatment of kidney cancer individually and in breast cancer as combination therapy.
N N Cl
C H3
N N N H
N OH
Figure 2: Chemical structure of Everolimus
Analytical methods are required to characterize these drug substances and drug products composition during all phases of pharmaceutical developments. The great interest towards Derivative Spectrophotometry (DS) is due to the increased resolution of spectral bands, allowing the detection and location of the wavelengths of poorly resolved components of complex spectra and reducing the effect of spectral background interferences. Keeping these objectives in mind it was decided to develop a Derivative Spectroscopic method for the analysis of these drugs in bulk and physical mixture as this method is simple, cost effective and accurate in analysis of drugs[4,5]. However on thorough and extensive literature survey, it was observed that there were no Derivative Spectroscopic methods reported for Everolimus and Axitinib in bulk. In this regard, the present study is an attempt to develop a Derivative Spectroscopic method for the Simultaneous estimation of Axitinib and Everolimus in bulk and their physical mixture. A physical mixture is prepared by blending 5mg of Axitinib and 15mg of Everolimus and prepared as tablets with other excipients required for tablet formulation as no combined marketed dosage forms are found.
MATERIALS AND METHOD
Materials
Drug sample:
Axitinib and Everolimus bulk drugs were procured from Shilpa Medicare Limited, Research Institute, Raichur, Karnataka, India as gift samples.
Formulation used:
A tablet dosage form consisting of Axitinib 5mg and Everolimus 15mg with suitable excipients was prepared by punching with the help of Rimek RSB-4 MINI PRESS tablet punching instrument.
Chemicals and Solvents used:
A double distilled Millipore water was used and the same is collected from instrument Milli pore Direct Q 3
Instrument used:
UV-Visible Spectrophotometer , Shimadzu 1180
Methodology
Preparation of standard drug solutions:
63
dissolved in minimum quantity of double distilled water and made up to the mark separately (Stock solutions). A dilution of 100 µg/ml was prepared individually for Axitinib and Everolimus from the stock solutions .
Preparation of Calibration curve:
The aliquots of stock solution of Axitinib and Everolimus (0.5 – 3.5 ml of 100 µg/ml) were transferred into 10 ml
volumetric flask and made up to the mark with double distilled water separately. The absorbance of different concentration solutions was measured at 303 nm and 267.20 nm against double distilled water as blank Figure 3-4. The samples were found to be linear with the concentration range of 5 – 35 µg/ml. The calibration curve for Axitinib and Everolimus were plotted using concentration against absorbance Figure 5-6 .
[image:3.612.151.466.195.322.2]
Figure 3: Uv-visible spectra of Axitinib at 5 – 35 µg/ml
Figure 4: Uv-visible spectra of Everolimus at 5 – 35 µg/ml
[image:3.612.189.422.529.706.2]64
Figure 6: Calibration curve of Everolimus at 5 – 35µg/ml
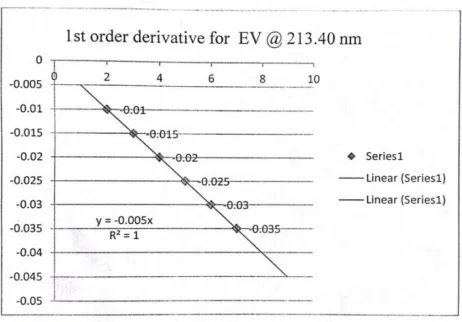
The curve obtained were linear in the concentration range of 5 - 35 µg/ml. later these absorption spectra Figure 3-4 were converted to First Order Derivative Spectra using UV VISIBLE probe verison 2.43.Figure 7-8. These converted spectral graphs were used to record absorbance at 213.40 nm and 246.30 nm for Everolimus and Axitinib respectively.
Figure7; First Derivative Spectra of Axitinib at 5-35 µg/ml
65
Estimation of Axitinib and Everolimus in physical mixture:Tablet dosage form of Axitinib and Everolimus are prepared from physical mixture of 5mg of Axitinib and 15mg of Everolimus by punching with other excipients. Such twenty formulated tablets were accurately weighed and their average weight is determined and powdered. The powdered tablets triturate is equivalent to 10 mg of Axitinib and Everolimus were transferred into a 10 ml volumetric flask, added double distilled water to dissolve and made up to the volume. Then the solution were sonicated for 10 minutes. The solution was filtered through Whatmann filter paper No.1. From the clear solution, 1 ml of the solution was transferred into a 10 ml standard flask and made up to the mark with double distilled water to produce 100 µg/ml concentration. The amount of Axitinib and Everolimus present in formulation was determined by using slope and intercept values from calibration graph.
Results and Discussion:
A simple, precise and accurate method was developed for the simultaneous estimation of Axitinib and Everolimus in pure form and in its physical mixture as tablet dosage form. The solubility of Axitinib was determined as per Indian Pharmacopoeia. The numbers of polar and non-polar solvents were tried like double distilled water, 0.1M HCl, 0.1M NaOH, Methanol, Ethanol, Acetone, Isopropyl alcohol, N-Butanol, Diethyl amine, Carbon tetrachloride, Petroleum ether, Dichloro methane, Ethyl acetate, Toluene, and Acetonitrile. From the solubility data double distilled water was selected as a solvent for simple UV method, because of its solubility and easy availability. Axitinib and Everolimus were dissolved with double distilled water to get a concentration of 15 µg/ml separately. The solution was scanned in UV region in the wavelength range from 200-400nm against double distilled water as a blank. The spectrum of Axitinib and Everolimus in double distilled water were recorded. From the spectrum of Axitinib and Everolimus the wavelength maxima were found to be 303 nm and 267.20 nm. The absorbance of the solution was measured at the selected wavelength. Different aliquot of Axitinib and Everolimus in double distilled water were prepared in the concentration range of 5-35 µg/ml. The graphs were converted to First Order Derivative spectra and the absorbance of solution was measured at 213.40 nm and 246.30 nm for the aliquots. The calibration curve was plotted using concentration against absorbance. These are shown in the table-1. The correlation co-efficient value for the calibration curve was found to be 1 and 1 respectively for Axitinib and Everolimus. It indicates that the concentration of Axitinib and Everolimus has good linearity. The calibration graph is shown in figure 3,4.
Tablet formulation containing 5mg of Axitinib and 15mg of Everolimus were prepared from their physical mixture for analysis. Twenty tablets were weighed accurately and the average weight was found. The nominal concentration of Axitinib and Everolimus (5 – 35 µg/ml) were prepared. The absorbance of solution was measured at 213.40 nm and 246.30 nm for both drug solution. The amount of each test solution was calculated. The percentage claim of Axitinib and Everolimus present in their marketed tablet dosage form was found to be 99.88% ± 0.31738 and 98.99% ± 0.2734 respectively. The amount of drug found in formulated tablets is in good agreement with the claims and the percentage relative standard deviation (%RSD) value was found to be 0.31776 and 0.2734. It indicates that the currently developed method has good precision. The results of formulated tablets are indicated in Table 2a-2b
Table 1: Spectral values of Axtinib and Everolimus in bulk drug
Sl.No.
Concentration of Everolimus(EV)
and Axitinib(AX) (mix in µg/ml)
Absorbance Concentration found % Error
EV AX
EV(-ve) 213.40n
m
AX(-ve)
246.30nm EV AX EV AX
1. 5 5 0.01 0.01 5.3 4.9 6 -2
2. 10 10 0.013 0.014 8.3 8.9 -17 -11
3. 15 15 0.019 0.019 14.3 13.9 -4.6 -7.3
4. 20 20 0.025 0.025 20.3 19.9 1.5 -0.5
5. 25 25 0.030 0.030 25.3 24.9 1.2 -0.4
6. 30 30 0.035 0.036 30.3 30.9 1 3
66
Table 2a: Spectral values of Axtinib and Everolimus in physical mixture as tablet
Sl. No.
Everolimus(EV) Axitinib(AX) Absorbance (-ve) at % Error
Conc. Taken Conc. Obt. Conc. Taken Conc. Obt. 213.40nm 246.30nm EV AX
1. 5 4.3 5 4.9 0.009 0.01 -14 -2
2 10 9.3 10 9.4 0.014 0.0145 -7 -6
3. 15 14.3 15 13.9 0.019 0.019 -4.6 -7.3
4. 20 20.3 20 19.9 0.025 0.025 1.5 -0.5
5. 25 25.3 25 24.9 0.030 0.030 1.2 -0.4
6. 30 30.3 30 30.9 0.035 0.036 1 3
7. 35 34.3 35 34.9 0.039 0.04 -2 -0.28
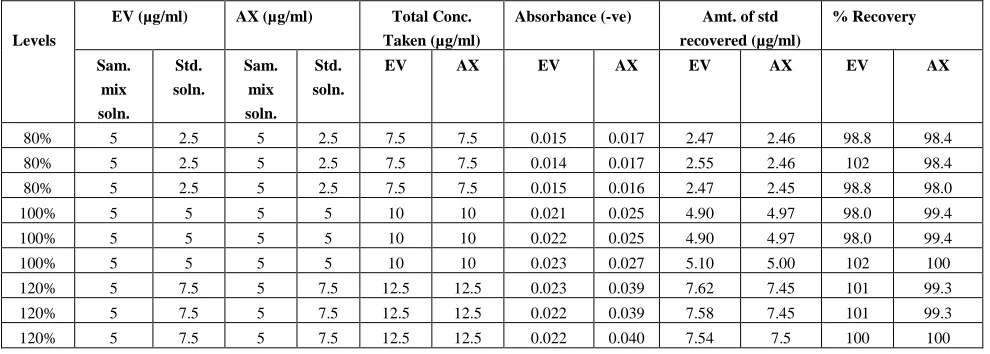
Table 2b: % Recovery Study Data for EV and AX by Derivative spectroscopic method.
Levels
EV (µg/ml) AX (µg/ml) Total Conc. Taken (µg/ml)
Absorbance (-ve) Amt. of std recovered (µg/ml)
% Recovery
Sam. mix soln.
Std. soln.
Sam. mix soln.
Std. soln.
EV AX EV AX EV AX EV AX
80% 5 2.5 5 2.5 7.5 7.5 0.015 0.017 2.47 2.46 98.8 98.4 80% 5 2.5 5 2.5 7.5 7.5 0.014 0.017 2.55 2.46 102 98.4
80% 5 2.5 5 2.5 7.5 7.5 0.015 0.016 2.47 2.45 98.8 98.0
100% 5 5 5 5 10 10 0.021 0.025 4.90 4.97 98.0 99.4
100% 5 5 5 5 10 10 0.022 0.025 4.90 4.97 98.0 99.4
100% 5 5 5 5 10 10 0.023 0.027 5.10 5.00 102 100
120% 5 7.5 5 7.5 12.5 12.5 0.023 0.039 7.62 7.45 101 99.3
120% 5 7.5 5 7.5 12.5 12.5 0.022 0.039 7.58 7.45 101 99.3
120% 5 7.5 5 7.5 12.5 12.5 0.022 0.040 7.54 7.5 100 100
ACKNOWLEDGEMENT
Our humble thanks to Principal and faculty of Government College of Pharmacy, Bengaluru for providing facilities and extended their support to carry out the present work.
REFERENCE
1. Axitinib. https:/en.wikipedia.org/wiki/Axitinib. 2017. 2. Everolimus. https:/en.wikipedia.org/wiki/Everolimus. 2017.
3. Everolimus. https//pubchem.ncbi.nlm.nih.gov/compound/6442177. 2017.
4. Owen AJ. Uses of derivative spectroscopy. UV-Visible Spectroscopy. 2017, 995,1-8.
[image:6.612.60.555.253.430.2]