Journal of Chemical and Pharmaceutical Research, 2016, 8(6):136-142
Research Article
CODEN(USA) : JCPRC5
ISSN : 0975-7384
Spectral and thermal studies of atenolol-glycine single crystal
B. Kavitha
1, G. Madhurambal
2and S. Nelson Amirtharaj
31Assistant Professor in Chemistry, TBML College, Porayar,-609307, Tamil Nadu, India
2Former Dean of Sciences and HOD of Chemistry, ADM College for Women, Nagapattinam- 611001, TamilNadu,
India
3
Assistant Professor in Chemistry, TBML College, Porayar-609307, Tamil Nadu, India
_____________________________________________________________________________________________
ABSTRACT
A Single crystal of Atenolol-Glycine was grown by slow evaporation at room temperature. The growth conditions of the crystals are studied and the grown crystals are confirmed by single X-ray diffraction studies. The grown crystal was characterized using TG-DTA, FT-IR, UV-Vis, SEM, EDAX and single crystal XRD. The presence of various functional groups was confirmed by FT-IR spectra. The UV-Vis spectra indicate that the crystal has very good absorption in the entire visible and near IR region. Band gap determination is also carried out to find the variation presented by doping. The decomposition temperatures and the mass loss have been estimated from the thermo gravimetric analysis.
Keywords: Atenolol, Infrared Spectrum, SEM, Thermal Analysis, UV-Vis Spectrum
_____________________________________________________________________________________________
INTRODUCTION
Molecules of large size exhibits numerous conformational possibilities giving rise to crystal (or) amorphous solid material [1,2]. Atenolol, compound widely prescribed in medicine as a cardio selective β1-adrenergic blocker. It is
one of the most widely used β-blockers. Clinically; it is used as a reference drug in randomized controlled trials of hypertension. It does not have membrane stabilizing and intrinsic sympathomimetric activities [3,4].Atenolol is used alone or in combination with other medications to treat high blood pressure. It is also used to prevent angina and improved survival after a heart attack. Atenolol is in a class of medications called Beta blockers. It works by relaxing blood vessels and slowing heart rate to improve blood flow and decrease blood pressure. Atenololis widely referred to as a Beta-Adrenergic Blocking agent or a Beta Adrenaceptor Antagonist. However, it is more commonly known as a Beta Blocker. More specifically it acts as a beta-1 cardio selective adrenoreceptor blocking agent, whose fundamental objective is to control the heart. Atenolol does so by restricting nerve impulses, thereby controlling the rate and force of contraction, consequently reducing blood pressure. Aminoacids posses proton donor carboxyl acid(COOH) group and the proton acceptor amino (NH2) group. The amino acid glycine is evidently showing NLO
activity due to donor acceptor groups and also intermediate charge transfer was possible. The dopant Glycine (C2H5NO2) is the simplest of all amino acid, is essential for the biosynthesis of nucleic acids[5], and acts as
inhibitory neurotransmitter in the brain and/or spinal cord [6-11].
EXPERIMENTAL SECTION
2.1. Preparation of Solution
2.2. Crystallisation Method
The beaker was covered with filter paper. Small holes were made on filter paper. The solution is allowed to evaporate slowly. Crystals formed were harvested after few days.
RESULTS AND DISCUSSION
3.1 FTIR ANALYSIS
The FTIR spectrum for pure as well as doped crystals were recorded using FT-IR instrument using the KBR pellet technique in the range 400-4000cm-1 which is shown in the Fig. 1 & 2. The calculated frequencies with their relative intensities obtained in FTIR of pure and doped Atenolol and their most probable assignments are presented in Table(1)[12].
The dopant Glycine approaches the Atenolol closer to the end of C-O-C grouping and occupies the interstitial positions closer to the aromatic ring. This is depicted by the absence of frequency in the region 2923.44cm-1 in the glycine doped Atenolol FTIR spectra which is due to the methylene stretching frequency and this is further supported by the moderate variations in the C-O-C stretching frequencies in the region 1096.17cm-1 to 1110.1cm-1 and C=C bending frequency enhancement in the region 427.97cm-1 to 451.26cm-1 and change of C-H bending frequency in the region 673.39cm-1 to 673.25cm-1
Fig.1. FTIR Spectrum of Atenolol
Fig.2. FTIR Spectrum of GATN
4000.0 3000 2000 1500 1000 400.0
0. 0 10 20 30 40 50 60 70 80 90 100. 0 cm-1 %T 3355.69 3172.68 2963.80 2923.44 2866.46 2064.701896.18 1639.751514.20 1414.88 1333.34 1298.04 1241.44 1177.34 1096.17 1037.45 945.27 920.88 886.01 802.53 707.58 673.39 582.12 530.57 427.97
Table.1. IR Absorption Frequencies of Atenolol and GATN
Wave number (cm-1)
Assignment Atenolol GATN
3355.69 3356.42 O-H Stretching, N-H Stretching 3172.68 3177.95 N-H Stretching,
2963.80 2964.67 CH3Stretching, CH2Stretching,O-H Stretching in COOH Group
2923.44 - CH2 Stretching, O-H Stretching in COOH Group.
2866.46 2816.15 CH2 Stretching, O-H Stretching in COOH Group,
- 2782.26 O-H stretching in COOH group 2064.70 - Symmetric C-H stretching 1896.18 1894.42 Substitution pattern of benzene ring. 1639.75 1636.93 C=O Stretching
1514.20 1513.89
Aromatic C=C Stretching, Skeletal Vibration of benzene ring 1414.88 1411.94
1333.34 1373.50 1298.04 1299.74
C-O-C Stretching 1177.34 1177.89
1096.17 1110.11
1037.45 1038.95 in-plane C-H bending 945.27 919.94 Asymmetric ring Stretching 886.01 886.46 Aromatic C-H out-of-plane bending 802.53 799.82
p-disubstituted benzene ring - 770.15
707.58 706.60 N-H out-of-plane bending 673.39 673.25 C-H bending
427.97 451.26 C-C bending
3.2 UV SPECTRAL ANALYSIS
The UV-Visible spectrum of Atenolol and GATN were recorded in the range of 190-1100nm, using lambda spectrometer at a scan speed of 480.00nm/min. The UV-Visible spectra of Atenolol and GATN is shown in the Fig.3 and Fig.4.
Fig.3. UV – Visible Spectrum of Atenolol
190.0 300 400 500 600 700 800 900 1000 1100.0
0.00 0.2 0.4 0.6 0.8 1.0 1.2 1.4 1.6 1.8 2.0 2.2 2.4 2.6 2.8 3.0 3.2 3.4 3.50
nm A
Fig.4. UV- Visible Spectrum of GATN
3.3.Band Gap Energy Determination
The band gap measurement was also carried out for Atenolol and GATN crystals. The plot of (αhν)2 against hν is shown in the Fig.5 and Fig.6. a trend line was added to extrapolate and it cut the X-axis of 6.05eV which is taken as the direct band gap of the crystal. Due to the addition of the Aminoacid Glycine to the Atenolol, high value of band gap is observed. This increase of energy gap with Glycine incorporation to the Atenolol can be attributed to the variation of disorder and defects presented by doping.
2 3 4 5 6
0 50 100 150 200
(α hυ
)
2
(e
V
/c
m
)
2
Photon energy (eV)
Atenolol (5.15eV)
Fig.5. Band gap energy of pure Atenolol
190.0 300 400 500 600 700 800 900 1000 1100.0
-0. 01 0.2 0.4 0.6 0.8 1.0 1.2 1.4 1.6 1.8 2.0 2.2 2.40
nm A
2 3 4 5 6 7 0
20 40 60 80 100 120 140
(α hυ
)
2
(e
V
/c
m
)
2
Photon energy (eV)
Atenolol+Glycine(6.05eV)
Fig.6. Band gap Energy of GATN
3.4. Thermal Analysis
The crystal of GATN was subjected to thermo gravimetric analysis, differential thermal analysis using a Q500. V20-10
Build 36 thermal analyser in nitrogen atmosphere. The samples were heated between 300C and 9300C to study the mass loss and thermal stability. The TG-DTG curves of grown crystals were shown in the Fig.7.
occurs between 3100C and 5500C shows the decomposition of acetamide, Carbon residue and ethylene molecule. There is one more weight loss occurs between 5500C and 9100C which is due to the decomposition of the carbonyl group which corresponds to 8.51%. However in the DTA curve an exothermic peak at 1520C, may be assigned to the melting of the sample. The other exothermic transitions observed nearly coincide with the decomposition observed in the TGA.
3.5 SINGLE CRYSTAL X-RAY DIFFRACTION
[image:6.595.227.384.234.329.2]The single crystal X-ray diffraction analysis on Glycine doped Atenolol single crystals was recorded using X-ray diffractometer. The unit cell dimensions for doped Atenolol are compared with that of pure Atenolol and are given in the Table.2. Single crystal XRD reveals that in GATN, the host molecule increases the void altering the guest molecules included and trapped in the crystal structure and hence the crystal structure is monoclinic with decrease of a, b, c values and volume.
Table 2: Comparison of unit cell dimension
Pure Atenolol Doped Atenolol a(A°) 14.41 5.15 b(A°) 28.00 12.07 c(A°) 11.44 5.51
α 97.200 90.000
β 99.700 111.570
ϒ 10.290 90.000
Volume 4425.96Ao3 319Ao3 System Anorthic Monoclinic
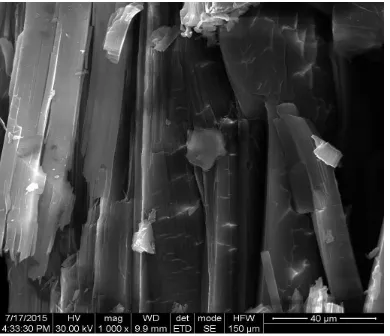
3.6. Scanning Electron Microscopic Analysis
The SEM images of GATN is shown in the Fig.8. and 9. respectively.
The Microscopy structure of GATN shows patches with horizontal, cross sectional layered and rod like shapes confirming the roughness of the crystal
3.7. Energy Dispersive X-ray analysis
The compositional analysis of GATN crystals is carried out by using EDAX analysis. EDAX pattern of GATN crystals is shown in the Fig.10. Table.3. shows the elemental and atomic percentage of C,N and O. The EDAX confirms the presence of atomic % of C,N and O are 80.12, 7.50 and 12.38 respectively. Recorded EDAX spectrum reveals that there is no evidence of other impurities.
3.8. Optical Image Microscope
The crystals are photographed using optical microscopy LX 400. The GATN crystals are very transparent. The photographs of the crystals are shown in the Fig.11.
[image:6.595.74.269.520.688.2] [image:6.595.303.485.529.689.2]Fig.10.EDAX spectrum of GATN Table.3. Elemental Data of GATN
Fig.11.Optical Microscopic image of GATN
CONCLUSION
Due to the addition of amino acid Glycine, there is no specific strong or weak attraction between Atenolol and Glycine which was shown by UV spectral studies. The wider Band gap value attributed to the variation of disorder and defects presented by doping. The thermogram reveals the decomposition pattern of GATN. Single crystal XRD revealed that GATN belongs to monoclinic structure. SEM images confirming the roughness of the crystal.
REFERENCES
[1]R.Hilfiker, “Polymorphisim in the pharmaceutical Industry” JohnWiley and Sons Inc; Weinhein, 2006, Chapter 10.
[2]Bernstein, J.Polymorphism in molecular crystals, clarendon press;Oxford, 2002, Chapter 3. [3]D.S Bose , Narsaiah, A.V., Bloorg. Med.Chem Vol.(13), 2005, p627.
[4]A.Pearson , T.Gaffney, T.Walle, P.Priviteria, J.Pharmocol. Exp. Ther. Vol. (250), 1989, p759. [5]Molecular expression: The Amino acid collection. in
http:// micro.magnet.fsu.edu/aminoacids/pages/glycine.html.
[6]S.M.Paul, Gaba and Glycine, in Psycopharmacology, The Fourth Generation of progress, edited by F.E.Bloom and D.J.Kupfer (Raven press, Newyork.), 1995,p87-94.
[7]R.A. Davidoff, R.P .Shank, Graham. Jr., M.H.Aprison, and R. Werman, Nature (London). Vol. (214) , 1967, p680.
[8]M.Senthilpandian, P.Ramasamy, J.Cryst.Growth, Vol.310, 2008, p2563.
[9]N.R.Dhumane, S.S.Hussaini, V.G. Dongre, Mahendra D. Shirsat, Optical Materials, Vol.31, 2008, p328. [10]M.R.Suresh Kumar, H.J.Ravindra, S.M.Dharmaprakash, J.Cryst.Growth, Vol.306, 2007, p361.
[11]R.Sankar, C.M Ragahvan, R.Mohan Kumar, R. Jayavel, J.Cryst. Growth, Vol.309, 2007, p30.
Element Wt% At%
CK 76.05 80.12
NK 08.30 07.50
OK 15.65 12.38